CITIZEN ENGAGEMENT THROUGH CITY APPS –
TECHNOLOGY ADOPTION APPROACH
Rita de Orey Botelho Simões Roque de Pape
Dissertation submitted as partial requirement for the conferral of Master in Management of Services and Technology
Supervisor:
Prof. Doutor Carlos J. Costa, Prof. Associado, ISEG Lisbon School of Economics and Management, Universidade de Lisboa
Co-Supervisor:
Prof. Doutora Manuela Aparício, Prof. Auxiliar, ISCTE Escola de Tecnologia e Arquitectura, Departamento de Ciências e Tecnologia de Informação
Abstract
Metropolitan areas are constantly evolving, and the smart city concept is gaining traction throughout local governance. The new paradigm for cities lands on an organic, efficient and interconnected structure, where the citizen is placed at the centre. Information and communication technologies (ICT) are the main technological enablers for this change and for citizen engagement, city services and applications (Apps) as one of the channels possible to use. The main objective of the present study is to find the key determinants that enable the adoption of city mobile apps. A theoretical model was created, and an online survey conducted to gather insights of the citizens’ perspectives regarding the city apps. The results indicate the model is valid and that perceived usefulness and perceived ease of use are important components to the adoption of city apps. In addition, it was possible to identify some organizational and individual impacts recurring from the use of these apps. This study contributes to a new model of city apps adoption and provides evidence to organisms involved on the implementation and development of these apps.
Keywords: smart cities, technology adoption, innovation, citizen engagement, gamification,
mobile apps, e-government.
Resumo
As áreas metropolitanas estão em constante desenvolvimento e o conceito de smart cities tem vindo a ganhar força entre organismos de governação local. Este novo paradigma para as cidades assenta numa estrutura orgânica, interconectada e eficiente, onde o cidadão é colocado no centro. As tecnologias de comunicação e informação são consideradas os principais facilitadores para esta mudança e envolvimento do cidadão, sendo os serviços e aplicações (apps) disponíveis um dos canais utilizados. O objectivo principal do presente estudo é determinar o que proporciona adopção de apps citadinas. Um modelo teórico foi desenhado e um questionário online realizado, de modo a recolher as percepções dos cidadãos, relativamente ao uso destas aplicações mobile. Os resultados indicam que o modelo é válido e que a percepção de utilidade e de facilidade de utilização são importantes componentes na adopção de apps citadinas. Adicionalmente, foi possível identificar algum impacto individual e organizacional promovido pelo uso destas apps. Este estudo vem contribuir para um novo modelo de adopção a apps citadinas e facilitar informação aos organismos envolvidos no desenvolvimento e implementação das mesmas.
i
General Index
Chap. 1 – Introduction ... 1 1.1 Scientific Motivation ... 1 1.2 Research objective ... 2 1.3 Methodology ... 2 1.4. Thesis Structure ... 3Chap. 2 – Literature Review ... 4
2.1 Smart cities... 4
2.2 Citizen engagement and participation ... 7
2.3 E-government services ... 8
2.4 Gamification and citizen engagement ... 9
2.5 Technology adoption and Success ... 10
Chap. 3 – Research Methodology ... 15
3.1 Research dimensions ... 15
3.2 Research model ... 16
Chap. 4 – Empirical work ... 20
4.1 Sample Characterization ... 20
4.1.1 Lisbon | Lisbon Mapping ... 20
4.1.2 Lisbon and the smart cities dimension ... 22
4.1.3 Lisbon’s e-government services and applications provided ... 25
4.2 Operationalization of the study ... 26
4.2.1 Data collection approach ... 29
4.3 Data treatment approach ... 31
Chap. 5 – Data Analysis and results ... 32
5.1 Sample analysis ... 32
ii
5.2.1 Measurement Model ... 33
5.2.2 Structural model ... 36
Chap.6 – Discussion ... 38
6.1 Hypotheses discussion ... 38
6.2 Limitations and future work ... 40
Chap. 7 – Conclusions ... 41
References ... 42
iii
Table Index
Table 1 - Proposed definitions for Smart City concept ... 5
Table 2 - Dimensions for Smart Cities ... 7
Table 3 - Research Dimensions ... 15
Table 4 – Likert Scale used on the model operationalization ... 26
Table 5 - Model Operationalization ... 27
Table 6 - Sample size recommendation in PLS-SEM for a statistical power of 80%. Cohen (1992) ... 32
Table 7 - Sample characterization... 33
Table 8 - Evaluation of the measurement model ... 34
Table 9 - Discriminant Validity according to Fornel & Larkert (1981) ... 34
iv
Figures Index
Figure 1- Evolution of diffusion through individual adoptions (Straub, 2009) ... 12
Figure 2 - stages of adoption ... 12
Figure 3 - Research Model ... 19
Figure 4 - Portugal demographic indicators. Source: INE ... 20
Figure 5 - Urban and rural population evolution in Portugal. Source: United Nations ... 21
Figure 6 - Lisbon Demographic indicators (based on Censos 2011) ... 22
Figure 7 - City Services Diagram ... 25
v
Abbreviation List
Apps Mobile and web applications
EU European Union
ICT Information and communication technologies
IDT Innovation Diffusion Theory
IT Information technology
IoT Internet of things
IS Information systems
SC Smart city (cities)
TAM Technology Acceptance Model
PLS-SEM Partial least squares structural equation modeling
AVE Average variance extracted
1
Chap. 1 – Introduction
1.1 Scientific Motivation
All over the world the human population is concentrating in relatively few large cities. These large cities are seen has better life prospects due to its high economical productivity and apparent urban plan. This increase in the flow of new citizens (Caragliu, del Bo, & Nijkamp, 2011) is bringing uncertainty and pressure on the metropolitan areas. Cities grow at a pace that demands for more complex planning and governance.
Positive benefits generated from dense and diverse cities are leveraged by an equal form of negative impact (Harrison & Donnelly, 2011) – from mobility, traffic management, food and energy supply, to crime. The demand for services also increases, especially the ones related to the operation of urban infrastructures which relates to the new concept of smart cities.
Nowadays we are approached by terms such as smart cities (SC), innovation, digitalization, as key drivers for the societies of the future, but we come short of what these concepts entail. We also miss to fully understand the role city’s play in shaping a rapidly urbanizing world, and how they can help to create smarter, more sustainable and resource-efficient communities.
We live in a society eager to transform itself into an interconnected and organic structure. The smart city concept brought a view of a place where all is efficient and cost-effective, where citizens are placed at the center and information technology (IT) plays a key role.
The purpose of this research is to look at the city of Lisbon, Portugal, and study which initiatives has the local council take in order to engage with its citizens to achieve a better performing city structure and citizen involvement. The initiatives studied are information technology based, mainly through mobile and web applications (apps), that enable a “just-in-time” interaction between parties. This research aims to understand how citizens perceive the city’s apps and if they understand how it impacts the city’s performance, reflecting their engagement on improving the city’s efficiency.
2 1.2 Research objective
Different studies have been conducted on the adoption of new information systems (IS) and the impact of the new SC trend in our society. But a study on how Lisbon is progressing towards a new age of interconnected, efficient and sustainable cities is still to be conducted. The aim of this research is to study specifically the impact of city apps on Lisbon’s transition to a SC, measured by the awareness, perceived satisfaction, use and net benefits (city and individual impact) of city apps. The research objectives are:
Identify the main dimensions leading to the city apps use/adoption;
Construct a model that allows the analysis of the inter-relations and influence of the identified dimensions on the city apps adoption;
Operationalize the constructed model through data collection; Validate the model through the data collected.
1.3 Methodology
For this research a 6-step methodology was followed: i) identification of the research objective; ii) literature review; iii) research model construct; iv) operationalization of the research model; v) validation of the research model; vi) discussion of the results achieved.
A review of the existing literature starting on the technology adoption scope, with Everett Rogers’ Innovation Diffusion Theory (1969), followed by studies on the smart city concept, with contributions from different authors such as Andrea Caragliu (2011) and Rob Kitchin (2019). Entering the smart cities scope the literature research diverted to important dimensions such as citizen participation, e-government and gamification. With the findings from the literature review a research model was constructed and operationalized through an online survey. An additional inventory on the city of Lisbon’s SC strategy and apps available was made along with interviews to specific city apps users, for the purpose of gathering a more holistic approach to the research objective. Once the data collection was terminated, an analysis was conducted using structural
3
equation modelling, using statistical method of partial least square regression. Once the model validation was concluded the results were discussed against the hypothesis supporting the research model.
1.4. Thesis Structure
This study is structured into 9 chapters: 1) introduction; 2) literature review; 3) research methodology; 4) empiric work; 5) data analysis and results; 6) discussion; 7) conclusion.
On the first chapter, the introduction, brief overview of the scientific motivation for the study is made outlining the research objectives;
On the second chapter, the literature review, a summary of key related research used as foundation for this dissertation is presented introducing the SC concept and approaching, not only the evolution of technology adoption theories and models, but the identification of new paradigms such as citizen participation and the influence of gamification elements on it.
On the third chapter, the research methodology, it is explained the context and how the research dimensions were defined along with the model and hypotheses construct.
On the fourth chapter, empiric work, a description of how the model was operationalized, through data collection, is indicated along with a characterization of the city of Lisbon. This characterization is done in different scopes – demographic, governance, and then more specifically within the smart cities scope and the offering on city apps.
On the fifth chapter, data analysis and results, the study sample is characterized, the hypothesis tested, and the research model validated.
On the sixth chapter, the discussion, the results obtained are reviewed against the different hypothesis and the study limitations and future work addressed.
On the seventh chapter 7, conclusion, final conclusions on the findings of the research are made and assessment of their contribution to the proposed initial objectives.
4
Chap. 2 – Literature Review
2.1 Smart cities
The term and definition of a Smart City (SC) has been subject of many conceptualizations. A city in which smart technologies foster sustainability (Chourabi et al., 2012), safety and comfort and grant citizens more control over their surroundings. An icon of sustainable and livable city. SC conceptualization gain attention not only from academia, but also from business and governments, in a quest to describe the new trend of cities that are composed and monitored by technology (Kitchin, 2014), where innovation is the leading agent for both governance and economy, and a new “smart role” of the citizen as the foundation for creativity and entrepreneurship. SC are categorized as using digital technologies to improve performance, reduce costs, reduce and manage resource consumption and engage more actively with its citizens. The pressure to use this type of technology comes in the form of population increase (at a rapid pace), city is seen as the main contributors to climate change and in fact cities play a role as major economic hubs in the world. The future strategies for our cities (de Castro Neto & Rego, 2019; Snow, Håkonsson, & Obel, 2016) are to operate intelligently to ensure the efficient flow and management of infrastructures, goods and services, and also to respond to the search of quality of life from the citizens. Some authors believe it is fundamental to look at why cities are considered important when it comes to strategy planning for the future. Worldwide cities (Mori & Christodoulou, 2012) have a key role on social and economic contexts and environmental sustainability impact. Global population is accelerating to urban areas and the existence of large cities with more than 10 million citizens is already upon us. This new pattern draws attention to the city’s physical and economical risks, as well as energy consumption and CO2 emissions, pushing the cities to find innovative ways to tackle these issues. And here lies the rise of the SC concept (Albino, Berardi, & Dangelico, 2015), where new approaches to urban infrastructures and services are based in technology and efficiently delivered. On the other hand, having the concept of SC totally technology based also does not seem entirely correct hence the challenge on defining it. Unfortunately, so far there has not been agreement on a common definition.
5
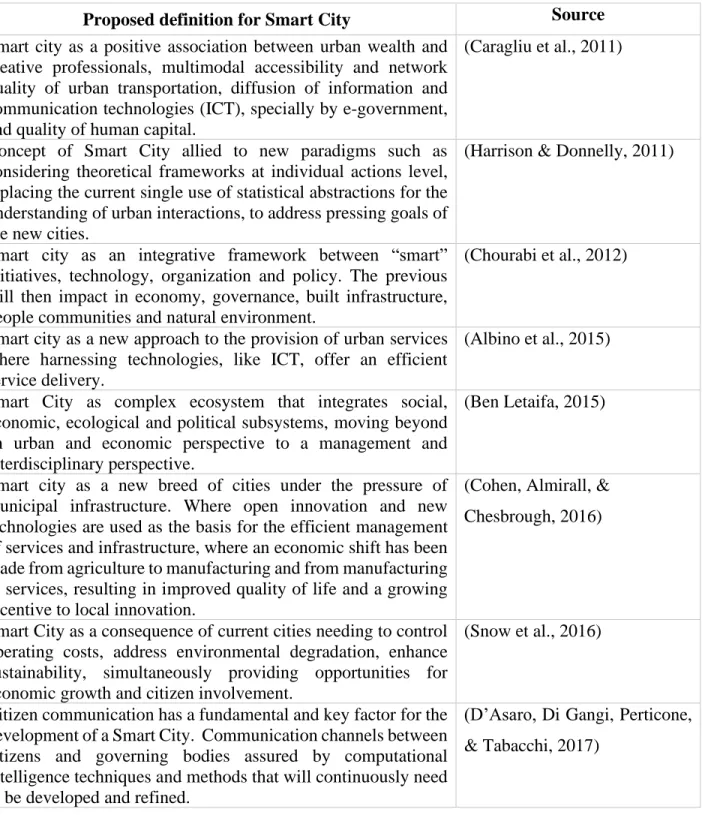
Table 1 summarizes some of the definitions found on the literature researched and embodies the evolving understanding of the SC concept.
Table 1 - Proposed definitions for Smart City concept
Proposed definition for Smart City Source
Smart city as a positive association between urban wealth and creative professionals, multimodal accessibility and network quality of urban transportation, diffusion of information and communication technologies (ICT), specially by e-government, and quality of human capital.
(Caragliu et al., 2011)
Concept of Smart City allied to new paradigms such as considering theoretical frameworks at individual actions level, replacing the current single use of statistical abstractions for the understanding of urban interactions, to address pressing goals of the new cities.
(Harrison & Donnelly, 2011)
Smart city as an integrative framework between “smart” initiatives, technology, organization and policy. The previous will then impact in economy, governance, built infrastructure, people communities and natural environment.
(Chourabi et al., 2012)
Smart city as a new approach to the provision of urban services where harnessing technologies, like ICT, offer an efficient service delivery.
(Albino et al., 2015)
Smart City as complex ecosystem that integrates social, economic, ecological and political subsystems, moving beyond an urban and economic perspective to a management and interdisciplinary perspective.
(Ben Letaifa, 2015)
Smart city as a new breed of cities under the pressure of municipal infrastructure. Where open innovation and new technologies are used as the basis for the efficient management of services and infrastructure, where an economic shift has been made from agriculture to manufacturing and from manufacturing to services, resulting in improved quality of life and a growing incentive to local innovation.
(Cohen, Almirall, & Chesbrough, 2016)
Smart City as a consequence of current cities needing to control operating costs, address environmental degradation, enhance sustainability, simultaneously providing opportunities for economic growth and citizen involvement.
(Snow et al., 2016)
Citizen communication has a fundamental and key factor for the development of a Smart City. Communication channels between citizens and governing bodies assured by computational intelligence techniques and methods that will continuously need to be developed and refined.
(D’Asaro, Di Gangi, Perticone, & Tabacchi, 2017)
6
A new Smart City paradigm by focusing on the pillars – metabolism (pathway for introduction of new technology), culture (preserve unique cultural and historical elements) and governance (economic development balancing improvements with opportunities) – evolving from the ICT paradigm. The three elements being considered always interconnected.
(Allam & Newman, 2018)
Smart cities in the EU, as places where urban networks, infrastructures and services are constantly improved and more efficient, with the support of ICT, to provide increased benefits to citizens and businesses. The EU as financing supporting mechanism for ICT research and development, as well as policy development to ensure citizen welfare and the achievement of the proposed Europe’s 20-20-20 sustainability objectives.
(Alaverdyan, Kučera, & Horák, 2018)
Smart City as a deep symbiotic system between citizens, IoT and ambient spaces, giving form to new forms of data. The flow of data being the new foundation of the future dynamic city for an information society as a human, social and technological construct.
(McKenna, 2019)
Different perspectives have been suggested for the SC but it’s clear the purpose of the introduction of this new concept was to encompass and framework the modern forces shaping the new urban reality - highlighting the importance of the role played by ICT’s for accelerating the city’s competitive and efficient profile (Cartaxo et al., 2017).
Along with the ICT’s, IoT/sensoring is also mentioned. Sensoring provides real-time data (“big data”) that is used, and interconnected with ICT, (Caragliu et al., 2011) to enable the development of a more efficient logistical infrastructure. Decision-making processes based on “big data”, supported by systems and algorithms that provide an evidence-based management, and compose a unified system linking all relevant actors – providing a situational awareness that also fosters control and coordination mechanisms.
Based on the above, it is possible to identify dimensions and components of the SC. They just provide frame and context to what we will be analyzing when trying to understand the SC approach.
7
Table 2 - Dimensions for Smart Cities Dimensions of the Smart City Concept
Primary Secondary
Economic development Culture
Sustainability Technology
Increased quality of life Human capital
Urban wealth Mobility
Environment Participatory policies
Urban infrastructure Innovation
Interconnection Data
Governance Metabolism
This new way to promote knowledge within the city goes hand in hand with innovation – either disruptive or incremental. At the end, most SC definitions seem to conclude with a common goal, to foster better living conditions for its citizens - improving their engagement, mitigate inefficiencies and environmental damages, whilst fostering economic growth and opportunities. A focus on welfare and social innovation/technologies – where the urban structure aligns with cross-sector solutions and services, seems to be of utmost importance.
2.2 Citizen engagement and participation
Taking the above, and continuing this review based on ICT, data-driven, efficiency, engagement and quality of life, the SC approach also seems to request for a dialogue between actors. Dialogue (Caragliu et al., 2011) facilitated by digital tools that support involvement and exchange of information and ideas. The concept of citizen participation has been evolving with time (Arnstein, 1969) as the redistribution of power to include citizens on the political and economic processes seems to be a cornerstone on democracy and a very applauded idea by virtually everyone. The theory that individuals should be given a chance to participate in their governance (Callahan, 2007), besides appealing to democratic ideals and being globally appraised, seems to be little
8
agreement on the mechanisms to use to achieve meaningful involvement. Public organizations, government bodies, (Schmidthuber, Hilgers, Gegenhuber, & Etzelstorfer, 2017) are using ICTs to open and integrate external stakeholders into their processes. They do so to improve citizen-government relationships, to clarify public information, to benefit decision-making processes. These new types of endeavors include citizen-sourcing activities – where the public administration calls for the citizens to engage in problem-solving or task execution activities. This type of enrolment proves to increase responsiveness and effectiveness due to the empowerment of the citizen’s input for public innovation and service improvement. Also knowing the users’ motivations helps to develop and implement initiatives more effectively due to the increased participation.
Data exchanges and interconnectedness are then key for citizen sourcing and participation. We can then context the SC on a different concept of communication, aligning traditional infrastructures (telephone, mobile, web access) to new means of fast data gathering mechanisms (sensors and intelligent components addressing IoT) that integrate everything from personal assets to urban structures (de Castro Neto, Rego, Neves & Cartaxo, 2017). We’re moving towards an integrated communication across devices and users to form a new “citizen communication”. This term can be viewed as an automated and transparent process that enables a free-flow of information. Citizen communication is key (D’Asaro et al., 2017) for development plans, and recognized as an enabler for citizens’ institutions and business to access information. The development of new information sources and the constant exchange greatly impacts development potential but also the access to new opportunities for improving everyday life. Citizen communication and participation also takes shape by the use of terms such as “e-citizenship”. On a digital era, (Posch, 2002) the e-citizen concept reflects the participation of citizens with e-technologies - ICT based technologies that integrate with the network to foster all levels of activities, from government to commerce. Literature suggests further research needs to be conducted on participatory and collaborative governance (Gustafson & Hertting, 2017) as there is still lack of clarification regarding the motives that trigger citizen participation on new governance arrangements.
9
As we have been discussing, the rise of ICT has impacted the traditional top-down management approaches into a more bottom-up decision-making process. Public administration (Khan et al., 2017), by providing new web-based IT tools, has enabled citizens to take part in a participatory city planning process and services offering. E-government services can range from different public services offered like renewing your identification card, passport, driving license to applying to a commercial registration or managing your parking meter. Even though there seems to be a great benefit on facilitating this type of services and information flow, active citizenship and trustworthiness seems to affect the use of e-government services. The use of ICTs has unarguably improved public administration, but studies suggest the adoption of e-government services remain shy of their full potential (despite the efforts). The successful implementation of e-government, the reflection of trust in both government, technologies, citizen beliefs and actions, is tightly linked to the adoption of the e-government services.
If we conceptualize active citizenship as the empowerment and engagement of citizens, some studies suggest (Fakhoury & Aubert, 2015) indeed developing trustworthiness and active citizenship, increases the behavioral intention to use e-government services.
2.4 Gamification and citizen engagement
As mentioned before, despite the improvement and innovation of ICTs to increase the offer on the tools and services that facilitate citizen engagement (Gustafson & Hertting, 2017), the adoption rate of these solutions is still low. In order to overcome this challenge different studies have been conducted to better understand which factors could improve usage behavior. Participation is seen as a two way education process (Irvin & Stansbury, 2004) where, for citizens, it is an opportunity to learn about complex trade-offs, and for the decision-makers, to learn about negative outcomes that can derive from some actions, and to anticipate or avoid them. However involving citizens is proven to be a not so linear process, (Aubert & Lienert, 2019) both on adoption rates obtained, costs and resources invested, but also on the method applied. On this dimension a new approach has been the topic of recent studies and research, to see if improves adoption and usage rates of citizen participation – gamification. Gamification has been under some attention, both from academia and businesses, in topics related to education, health, human-computer relations, among
10
others (Costa & Aparicio, 2018; Costa et al., 2017; Piteira et al, 2018). The concept itself, like the SC, is also used with different meanings limiting the guidelines for application. Even though the reporting on successful outcomes, (Seaborn & Fels, 2015) further studies are still needed to validate gamification – both on concept level but also on evidences of its effectiveness as to motivating and engaging users in different contexts. Nevertheless, it is impossible to argue the shortcomings we have seen in the last decades in the digital gaming and commercial entertainment industries. Development of new games (McGonigal, 2011) has always been a part of the human behavior and evolution history - for entertainment, socializing, training and even survival. Games are still important in human culture greatly influencing our social and leisure behaviors. Now greatly impacted by ICTs we are moving into a digital area where gaming gains are promoting adoption – hence the emerging concept of gamification and the curiosity on using this “power” to other applications. Gamification as to bringing game elements and game designs to a system that it is not a fully-fledge game end product or service, games as a source of “heuristics for enjoyable interfaces”, to motivate desired behaviors. Gamification tools (Deterding, 2012) can range from goal setting, real-time feedback, transparency, to mastery, competition, teams and more. Gamification to identify and unlock the motivations inherent to a desired activity. Gamification is promoting a shift in the paradigm that only money-based rewards are worth following. Businesses are now testing gamification programs’ design to engage and motivate clients and employees. There have also been academic and business efforts to develop a deep understanding of users and their motivations. If this is accomplished, a view of what the stakeholders have in mind, it is easier to work on how to create an experience that engages users whilst aligning with the business objectives. This also brings to light another key aspect on the use of a gamification approach – intrinsic value – both on the business offer but also on the users’ desire. If both are synchronized (Bunchball, 2010) using gamification can deepen the engagement. Gamification is indeed a motivational design process. Entities that are able to understand how to effectively use gamification to unlock the motivational drivers of their employees and clients, will have longer user engagements and therefore a unique competitive advantage, compared to others in the market.
11
Knowing whether an individual will engage with a particular technology, and the time it takes for that adoption to happen, as been greatly studied and discussed at all levels. This phenomenon is evident as the adoption of technology impacts our daily lives (from education to economy). The introduction of a new technology might be presented to us beyond our control but the outcome of the implementation, whether it was successful or not, sure is. What makes an individual adopt a certain technology? (Straub, 2009) Factors such as regulatory contexts, social pressures and pure curiosity for trying new things have already been identified.
The dimensions that affect adoption and diffusion have been broadly studied by academia and different theories for this effect have been formulated. The most accepted and broadly used is the Innovation diffusion theory (IDT), developed in 1962 by Everett Rogers. Its goal was to explain how an idea, behavior or product (Rogers & York, 1995) gains traction and diffuses over time, through a population or social system. The adoption process is limited by the different characteristics of the individuals and personal motivations, which made Rogers establish five adoption categories:
1. Innovators – the first who want to try new ideas, risk-takers;
2. Early adopters – opinion leaders, look-out for change opportunities; 3. Early majority – adopters when innovation takes momentum; 4. Late majority – skeptics, follow the majority;
12
Figure 1- Evolution of diffusion through individual adoptions (Straub, 2009)
Different strategies are used to target the different adoption groups from evidences, information sheets, social pressure, fears, etc. Independent of the strategy, researches defend adoption of innovation responds to five factors, all related to the innovation itself:
1. Relative advantage – when compared to the solution/idea/behavior it replaces; 2. Compatibility – with values held by individuals;
3. Complexity – easiness of use and understanding; 4. Triability – possibility to be tested;
5. Observability – tangible results.
When a response is triggered the adoption stages proceed as follows:
Figure 2 - stages of adoption
It’s through this 4 stages process (Rogers & York, 1995) that diffusion is accomplished. Adoption and diffusion are seen as inseparable as the latter is the consequence of the former. Roger also saw diffusion as a particular form of communication. A form composed by 4 primary components:
(a) The innovation – whose factors, which affect adoption, were already described above; (b) Social System – context, culture, environment – all affecting how innovation penetrates a
population;
(c) Time – as shown also above, Roger categorizes its adopters based on volume of adopters versus time - the diffusion curve (figure 1).
(d) Communication Channels – tools, means, mechanisms used to inform a specific population about a particular innovation.
Continued use Initial use Decision to adopt Awareness
13
IDT reflects on the impact of the communication channels as it defines the level of access to information, related to an innovation, an individual can have and how it’s interconnected to the diffusion effect. Roger and York (1995) defend that in order for a new concept to circulate within a population the best channel is word of mouth. One of the things that symbolizes our current modern civilization is the exponential growth in technology development and innovation. On the one hand humankind is eager to discover new solutions, on the other hand the same can’t be said for the adoption of those solutions. It is a reality that adoption behaviors are slower and incremental. Even when we are considering a disruptive innovation with higher performance than the actual, the adoption still comes with delay. What explains this conservative reaction to technology adoption? The answer lies in different parameters and uncertainties. The changing demographic characteristics and cultural patterns have led to a shift on the attributes of the population. Age differences and gender have been attributes for research studies on the influence of technology adoption.
Due to our society’s fast-paced pattern, complex and changing work environment, (Czaja & Sharit, 1993) where information technologies are at the core of how we run our businesses – there is evidence that age difference impacts the usage of technology in the workplace. This evidence suggests that information processing has an impact on older workers’ performance of computer-based activities. Another study, computer-based on the correlation between age differences and impact on individual adoption and sustained usage of technology in the workplace, (Venkatesh, Morris, & Ackerman, 2000) suggests that technology usage decisions on younger workers were strongly influenced by attitude towards using the technology when compared to older peers. On the other hand, older workers were more strongly influenced by perceived behavioral control.
The same authors who conducted the above-mentioned study conducted a parallel study, but this time focused on gender. Supporting the study on the theory of planned behavior and still within the usage of technology in the workplace context, when the decisions between men and women were compared, the decisions of men were strongly influenced by their attitude toward using the new technology. On the other end, women (Venkatesh et al., 2000) seemed to be more strongly influenced by subjective norm and perceived behavioral control. This evaluation seemed consistent across income, job position, education and computer knowledge. Findings do support sustained technology usage behavior is influenced by gender-based early assessments of new
14
technologies, impacting directly early usage behavior. This research has particular impact as it dismisses some most-used study attributes such as – social class, education, social status and computer skills.
Another adoption factor also approach by Rogers is timing. The optimal timing for technology adoption has also been topic of research. Within the context of irreversible technology choice, on a competitive firm that is facing a randomly determined innovation process with undefined speed of the arrival and degree of improvements generated by the new technology. Using a numerical example to illustrate the optimal decision rule and the net present value, (Farzin, Huisman, & Kort, 1998) the study suggests that the optimal decision rule implies a slower pace of adoption. It shows that the optimal timing decision is affected by changes in variables that reflect the market conditions, the company’s initial technology profile and the characteristics of the innovation process.
Another attribute that seems relevant to mention for the purpose of this study are externalities. In the case of an industry a research study suggests that the pattern of adoption was highly influenced by the existence of a sponsor for a specific technology. A sponsor (Katz & Sharpiro, 1986) is seen as an entity who owns the rights for a specific technology and makes investments to promote it. The key findings of Michael Katz and Carl Shapiro study were:
1. In the absence of sponsors, the technology seen as superior has a strategic advantage and it is likely to gain more market traction;
2. Between rival technologies, the sponsored one has a strategic advantage and may be adopted even if it has an inferior performance;
3. Between rival technologies, both sponsored, the one with perceived superior performance for the future has a strategic advantage;
All these studies give us context to understand what might influence the adoption process of the city apps supplied by Lisbon council.
15
Chap. 3 – Research Methodology
3.1 Research dimensions
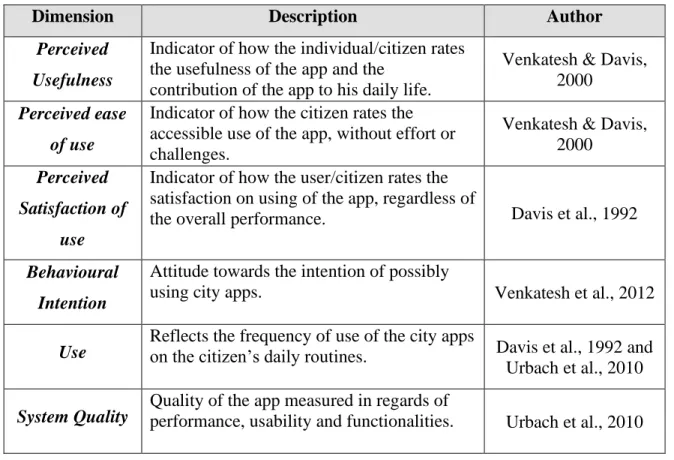
The research model proposed is based on the literature reviewed and has three main components: technology, services and gamification. The components are all related since the use of city apps addresses both a technological adoption to new concepts, as well as a service being provided to them, furthermore we would like to assess whether the inclusion of gamification elements affects frequency of usage and satisfaction. All three components are supported by 9 dimensions: perceived usefulness, perceived ease of use, perceived satisfaction of use, behavioral intention, use, system quality, information quality, service quality, user satisfaction, attitude towards behavior, individual impact, organizational/city impact and gamification. The table below (table 3) represents the concept for the model.
Table 3 - Research Dimensions
Dimension Description Author
Perceived Usefulness
Indicator of how the individual/citizen rates the usefulness of the app and the
contribution of the app to his daily life.
Venkatesh & Davis, 2000
Perceived ease of use
Indicator of how the citizen rates the accessible use of the app, without effort or challenges.
Venkatesh & Davis, 2000
Perceived Satisfaction of
use
Indicator of how the user/citizen rates the satisfaction on using of the app, regardless of
the overall performance. Davis et al., 1992
Behavioural Intention
Attitude towards the intention of possibly
using city apps. Venkatesh et al., 2012
Use Reflects the frequency of use of the city apps on the citizen’s daily routines. Davis et al., 1992 and
Urbach et al., 2010
System Quality
Quality of the app measured in regards of
16
Dimension Description Author
Information Quality
Quality of the app measured in terms of
content provided to the citizen. Urbach et al., 2010
Service Quality
Quality of the customer service considering time to respond, empathy and ability to solve problems.
Urbach et al., 2010
User Satisfaction
Positive experience of the citizen interacting with app. An indicator of the relevance, competence and efficiency of the app.
Urbach et al., 2010
Attitude towards behaviour
Perception and attitude towards city apps in
terms of necessity, value and convenience. Mishra, Akman and Mishra, 2014
Individual Impact
Indicator of the individual impact on the citizen from using city apps. Impact based on the positive performance and contribution to the citizen’s daily life.
Urbach et al., 2010
Organizational/ City Impact
Indicator if the global impact on the
city/community from using city apps. Impact based on the positive performance and contribution to the city’s governance.
Urbach et al., 2010
Gamification Attitude towards gamified elements as adoption, usage and satisfaction contributors. Aparicio, Oliveira, Bacao, & Painho,
2019
3.2 Research model
City apps are technological enablers for both communication and services between citizens and governing bodies, therefore predicting their use is of interest. The technology acceptance model (TAM) proposed by Fred Davis (1989), suggests to determine how and when a new technology will be used, the individuals’ beliefs, behaviors and intentions need to be assessed. TAM aims to explain the determinants of acceptance of new IT, introducing variables that influence the use of a system. As a result of his research, perceived ease of use, an individual’s attitude towards using a system and its perceived usefulness to be important and determinant towards explaining technology use. Later studies also have supported this such as Schmidthuber et al. (2017) in their study of determinants of citizen participation in online service reporting. A high level of citizen
17
participation on online reporting was linked to perceived ease of use and perceived benefit, (Schmidthuber et al., 2017) but also individuals who experienced enjoyment whilst using the platform showed a higher level of utilization. Based on this construct we expect to determine the factors influencing perceived satisfaction and perceived ease of use that will trigger an intention of use and consequently use. The use of a city app will then reveal an individual and organizational impact. This impact being represented by the perceived benefits of the interaction between citizen and local government. Perceived satisfaction is connected to an internal motivation and perception, based on an individual’s experiences and beliefs (Venkatesh, Davis, & Morris, 2007), as the pleasure of using an application regardless of the overall performance it might have. We expect to determine if both information quality (hypothesis 1) and gamification (hypothesis 2) influence perceived satisfaction. A usage that generates pleasure, satisfaction and fun, generates adoption. Gamification proposes the addition of entertainment and engagement elements (Aparicio et al., 2019; Piteira & Costa, 2017; Rodrigues et al., 2014) to activities that could be considered less appealing initially. We expect this additional layer of appealing and differentiating elements affect positively the perceived satisfaction and use of city apps. Regarding the access to relevant information, even though studies suggest the impact is relatively low (Urbach, Smolnik, & Riempp, 2010), due to the new times we live in, where ICTs enable a quick search and access to information, we expect to gather more insights that either support or suggest a different direction. Therefore, it is hypothesized that:
(H1a). Information quality affects positively perceived satisfaction towards city apps. (H1b). Information quality affects positively the use of city apps.
(H2a). Gamification affects positively perceived satisfaction towards city apps. (H2b). Gamification affects positively the use of city apps.
When presented to a new solution (technology/service/product), individuals tend to intuitively assess (Davis, 1989) whether the use of that solution will help them perform better in any sense (job, routines, search/access for information, etc.). That believe of usefulness impacts the use or not use of an application. Therefore, it is hypothesized that:
18 (H3). Perceived usefulness affects positively the intention of use of city apps.
After an initial contact with a new solution, the individual forms a belief of usefulness (Davis, 1989) followed by an assessment of complexity of use. An individual may believe a solution is of utmost importance (usefulness) but if the use is foreseen as challenging and confusing, the ponderation between performance benefits and effort for using that solution may result on non-use. We expect a positive perception of ease of use affects positively the intention of adopting new applications. Therefore, it is hypothesized that:
(H4). Perceived ease of use affects positively the intention of use of city apps. (H5). Intention of use affects positively the use of city apps.
Studies conducted by Urbach et al. (2010) suggest an interdependence between perceived satisfaction and use. The satisfaction of using a solution, closely dependent to the use of that same solution, (Urbach et al., 2010) have also been identified as influencing individual impact. Simultaneously, individual impact also influences significantly on organizational impact. Organization and individual impact being the final dependent variable of our model, merged under “net benefits”. Therefore, it is hypothesized that:
(H6). Perceived satisfaction affects positively the use of city apps.
(H7). Perceived satisfaction affects positively the net benefits of city apps. (H8). Use affects positively the net benefits of city apps.
Further developing the assessment of use and user satisfaction on using city apps, DeLone & McLean (2008) model for IS success seemed relevant. The model initially implied individual and organizational impact was indirectly affected by system and information quality through the reciprocally independent dimensions of user satisfaction and use (Petter, DeLone, & McLean, 2008). The model was later reviewed to include new visible relations for research and the dimensions for success being: System quality, Information quality, Service quality, System use,
19
User satisfaction and Net benefits. This multidimensional and interdependent model has proven to be a robust framework when assessing IS success measurements. For our research we would like to address the impact of gamification on the perceived satisfaction and use of city apps. To address this question, and based on previous modelling research by Davis (1989) and DeLone & McLean (2008), a theoretical model is presented (figure 3):
Figure 3 - Structural model proposal of smart cities success mobile applications
The model aims to evaluate the impact of information quality, gamification, perceived usefulness, perceived ease of use, on the intention of use and use of city apps and on user perceived satisfaction, that will construct the individual and organizational impact, merged into net benefits, of the use of this type of citizen engagement platform.
20
Chap. 4 – Empirical work
4.1 Sample Characterization 4.1.1 Lisbon | Lisbon Mapping
The city chosen for this research was Lisbon, not only for proximity, but also for the new trend of city apps/services that the city is being exposed to. Every day citizens are informed of new innovations and improvements to the city’s environment. No studies have been conducted in this dimension so far, making it a perfect candidate for this research.
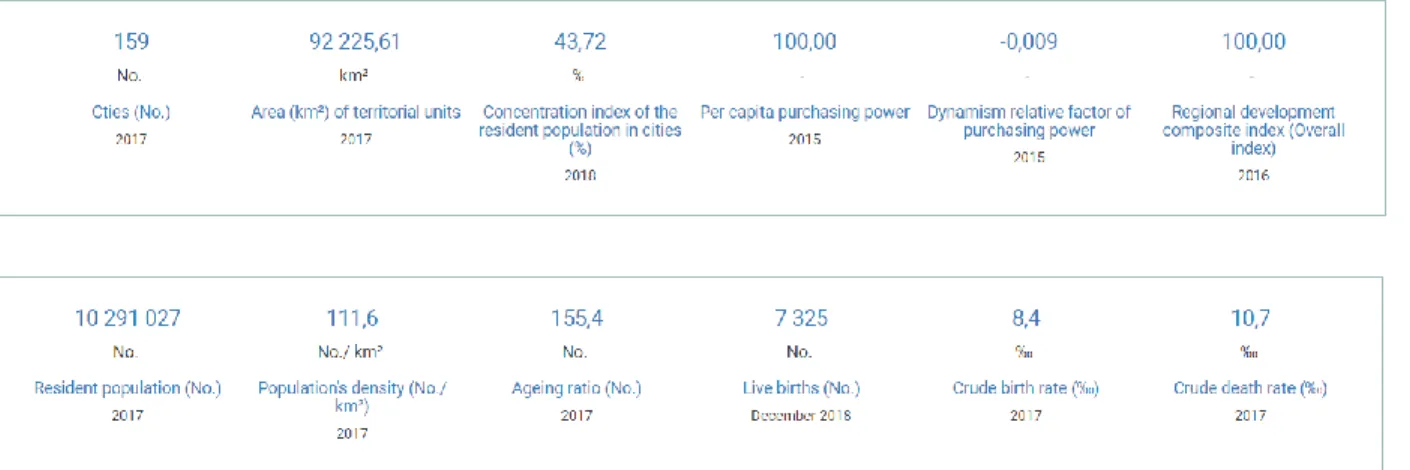
Lisbon is the capital city of Portugal, one of the member states of the European Union (EU), situated on the Iberian Peninsula and with a territory print of around 92 225 km2.
Demographics-wise the latest indicators according to Portugal’s National Institute of Statistics (Instituto Nacional de Estatística, 2019) are as follows:
Figure 4 - Portugal demographic indicators. Source: INE
Lisbon is the largest urban area in Portugal. The city is considered a hub for both residents and international guests – tourism and business – with around 140.000 people visiting the city each year (“Lisbon Population 2019 (Demographics, Maps, Graphs),” 2019). Demographics wise its key to consider beyond the city limits. Based on the 2011 census (Censos 2011, 2019) there are around 545.000 people in Lisbon but if we consider the whole urban areas surrounding the city
21
limits, that are considered Lisbon’s metropolitan area, this number raises to around 2.800.000 people. It is important to consider the metropolitan area as most citizens live on the suburban areas of Lisbon but commute to the city center for work and studies. Not considering this section of the population would be critical to deepen the understanding of the variables of our study. Therefore, Lisbon’s population makes up around 27% of the country’s total population. This number might increase with the current urbanization pattern (United Nations, 2019), also illustrated by the United Nations’ Population Division report:
Figure 5 - Urban and rural population evolution in Portugal. Source: United Nations
Regarding demographic information we will consider the city of Lisbon’s metropolitan area – which is categorized by the following demographic indicators (Censos 2011, 2019):
22
Figure 6 - Lisbon Demographic indicators (based on Censos 2011)
Based on the above indicators we can conclude Lisbon is a driving power in Portugal’s economy, composed by a young and academic educated work force, with a very interesting employment rate – probably making the city a point of interest for citizens looking for job positions.
4.1.2 Lisbon and the smart cities dimension
Lisbon Municipality is composed by 24 parish councils, dividing the city in 24 smaller areas and representing a first tier of local government. The parish councils have responsibilities such as: maintenance and cleaning of common spaces; management of public facilities and equipment; licensing and housing and community action. The list of parish councils are as follows:
Ajuda Alcântara Alvalade Areeiro Arroios Avenidas Novas Beato Belém Benfica Campo de Ourique Campolide Carnide Estrela Lumiar Marvila Misericórdia Olivais
Parque das Nações Penha de França Santa Clara
Santa Maria Maior Santo António
São Domingos de Benfica São Vicente
Total M F 0-14 15-24 25-64 65 or more Iliterate High School University Education
2,821,876 1,334,605 1,487,271 437,881 295,043 1,575,110 513,842 81,807 550,109 593,917
47% 53% 16% 10% 56% 18% 3% 19% 21%
# citizens employed 1,405,058 # citizens unemployed 181,782
23
The Lisbon Municipality is represented by President Fernando Medina executive, in power until 2021. The city council has a concrete strategic vision of where the executive aims to bring the city to. Their vision (CML, 2019) lands in 6 pillars:
1. Ambition and Leadership: ambition and strategic drive to transform Lisbon into an Innovation, entrepreneurial and creative international Hub;
2. Grids and Connectivity: physical and digital connectivity between actors and partners, stimulating both innovation and entrepreneurship ecosystems.
3. Openness and Facilitation: openness to new ideas, concepts, experiences and business. Lisbon as a city lab;
4. Global and Local: position Lisbon as the international center for businesses and innovation, never neglecting the investment in projects and initiatives with local impact;
5. Attractiveness and Hospitality: create conditions to host and accelerate new businesses with high growth potential and job creation;
6. Co-Creation and Participation: conception and implementation of projects involving public entities, businesses, universities, non-profit organizations and citizens.
It is possible to identify Lisbon’s council strategy very much aligned with the smart city concept and dimensions. Within the smart city scope the municipality has been co-financing and participating in the following projects (not extensive, just some examples):
CITY SDK – international consortium on an EU supported project, with a sole purpose of creating
a bundle of tools that promote the development of digital services for the cities involved - Helsinki, Barcelona, Amsterdam, Manchester, Lamia, Istanbul, Lisbon and Rome. CitySDK allows a more efficient use of groups of programmers for the development of new applications (apps). Data in an open format that can be used by apps, for smartphones and tablets, that enable the citizens to access services and key information, for who lives, studies, works or visits those cities.
OPEN DATA LX – Lisbon municipality project developed along with Agência para a
Modernização Administrativa (AMA), to make available to all citizens data collected about the city of Lisbon, so it can be used for different purposes – from research studies to the development of IT apps that can be of use for the city. Open Data projects aim to open to citizens the data that was collected along the years by different organizations and were recorded in closed databases.
24
Increase transparency, foster citizen participation and promotion of innovation and creativity as the main objectives for these types of initiative.
FLOW - Furthering Less Congestion by Creating Opportunities For More Walking and Cycling,
project funded by H2020. Focuses on placing pedestrian and cycling mobility at the same level as motorized vehicles as an improver of the city’s mobility management. Development of a methodology that promotes all forms and best ways to manage urban traffic congestion.
APProach - “Connecting EU mobile citizens with their welcoming cities”. Coordinated in
partnership with ALDA – European association for local democracy, aims to facilitate the right of free mobility of the EU citizens and their families. The goal of the project is to improve the communication between EU Mobile Citizens and their fostering cities and councils. Through these new improved communication channels citizens’ rights such as voting, education and active participation on their communities will be facilitated, improving their local integrations.
Selective Waste Collection: proximity and Innovation – EU supported project to promote the
scalability of selective waste collection and introduction of new technologies embed with information, to foster citizen engagement on the development of policies to the council’s sustainability. The project will work in 3 fronts: scale the selective waste collection in Lisbon; scale the selective waste collection to organic residues and develop a mobile app called “smart waste management” to promote citizen engagement on sustainability policies.
CCCB City Changer Cargo Bike – H2020 supported project that aims to promote the
introduction of cargo bikes on the city’s micro logistics. It is believed this will impact on the number of bicycle users, urban space is used more efficiently, air quality improves, road safety as well and finally life quality improves in general.
FORCE/Cities Cooperating for Circular Economy – H2020 financed project involving 4
European cities, 22 European partners, that aims to respond to the circular economy priorities defined by the EU.
RESCCUE – resilience to cope with climate change in urban areas, is a multisectoral, strategic
and innovative approach, aiming to design and implement information models and tools, focused on the water sector. The goal is to evaluate the impact of climate change in different sectors, connect them and then evaluate urban resilience in future scenarios.
25 POP-Alert – population alerting, linking emergencies, resilience and training through a behavioral
study and ICTs for crises management. This project aims to search and diagnose the city’s capacity for handling large scale disasters, considering different risk acceptance levels and availability to adopt prevention and repair measures.
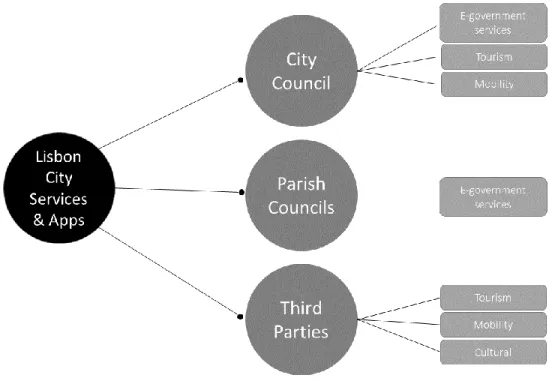
4.1.3 Lisbon’s e-government services and applications provided
Regarding the e-government services and apps provided by the city of Lisbon, searched online (CML, 2019), we grouped them into 3 layers. One layer related to specific council services, a second layer for parish councils’ services and a third layer of services provided by third parties to the citizens, but with the council’s authorization and, in some cases, support (council owned companies, partnerships, etc).
Figure 7 - City Services Diagram
On the city council services and apps, the municipality tries to engage with its citizens through web-based services and mobile applications. The web-based services are all integrated within the municipality’s webpage. They provide a range of services from online customer service, to
26
simulation tools, municipal archives and library, geographical mapping of the city, platforms to apply for different municipal subsidies and a one-stop-shop for requesting certificates, documents and follow urbanistic processes. Regarding mobile apps provided by the city council they are only 3, each addressing a singular vector – tourism, urban occurrences and Lisbon’s budget planning and participation. The parish councils provide services to their local citizens as well. Most of them have a website with informative content and an app available for the reporting of any urban occurrence. When looking at city services and apps provided by third partied the offer increases dramatically. If we consider the SC scope is easy to understand as, for instance, for traffic reporting a high number of apps can be available for that single purpose. For this study we will focus on only the ones with an obvious link to the Lisbon Municipality – either through a protocol, partnership, project or because they were developed by a company owned by the municipality. Under this umbrella the verticals approached are wider. We can find webservices and mobile applications for uses such as – traffic control, reporting urban issues, electric mobility, parking management, public transport timetable, taxis, sightseeing, route planning, museums and cultural events.
4.2 Operationalization of the study
In order to carry out the operationalization of the model and to quantify the dimensions it was used a Likert scale, represented on table 4.
Table 4 – Likert Scale used on the model operationalization
Scale (1 to 7)
Agreement
Disagree Don’t know Strongly Agree
1 4 7
Dimensions PU, PEOU, PSOU, BI, UA, UB, SQ, IQ, SerQ, US, ATB, II, CI, Gam.
27
With the support of the Likert scale and using a framework of 56 items, assessing 14 dimensions of technology adoption and gamification, as shown on table 5, the intentions of use and perceived usefulness, when applied to a specific city app, were assed with the aim of providing insight into the individual and organizational impact. The individuals participating on the survey were asked to choose a specific app and then make their personal evaluations of it.
Table 5 - Model Operationalization
Dimension Code Indicator Author
Perceived Usefulness
PU1 Using the app improves the performance of my city.
Venkatesh & Davis, 2000 PU2 Using the app in my city increases my
productivity
PU3 Using the app enhances effectiveness on my city.
PU4 I find the app useful for my city.
Perceived ease of use
PEOU1 My interaction with the app is clear and understandable
Venkatesh & Davis, 2000 PEOU2 Interacting with the app does not require
a lot of my mental effort PEOU3 I find the app to be easy to use.
PEOU4 I find it easy to get the app to do what I want it to do.
Perceived Satisfaction
of use
PSOU1 The experience of using the app is fun.
Davis et al., 1992 PSOU2 The experience using the app is
enjoyable.
PSOU3 The experience of using the app is exciting.
PSOU4 The experience of using the app is interesting.
Behavioural Intention
BI1 I intend to continue using the app in the future.
Venkatesh et al., 2012 BI2 I will always try to use the app in my
daily life.
BI3 I plan to continue to use the app frequently.
Use (A)
UA1 At the present time I consider myself to
be a frequent user of the app. Davis et al.,
1992
UA2 Last month how many times have you
28 Use (B)
UB1 Indicate the extent to which you use the app to retrieve information.
Urbach et al., 2010 UB2 Indicate the extent to which you use the
app to publish information.
UB3 I use the app to communicate with city local government, and to citizens in general.
UB4 I use the app to store and share documents.
UB5 I use the app to give suggestions or complains to city hall.
System Quality
SQ1 The app is easy to navigate.
Urbach et al., 2010 SQ2 The app allows me to easily find the
information I’m looking for. SQ3 The app is well structured. SQ4 The app is easy to use.
SQ5 The app offers appropriate functionality. SQ6 The app offers comfortable access to all
the features I need.
Information Quality
IQ1 The information provided by the app system is useful.
Urbach et al., 2010 IQ2 The information provided by the app
understandable.
IQ3 The information provided by the app is interesting.
IQ4 The information provided by the app is reliable.
Service Quality
SerQ1 The responsible service personnel are always highly willing to help whenever I need support with the app.
Urbach et al., 2010 SerQ2 The responsible service personnel
provide personal attention when I experience problems with the app. SerQ3 The responsible service personnel
provide services related to the app. SerQ4 The responsible service personnel have
sufficient knowledge to answer my questions in respect of the app.
User Satisfaction
US1 The app is efficient. Urbach et al.,
2010 US2 The app is effective
29
US3 The app satisfies me on the whole.
Attitude towards behaviour
ATB1 This type of app is convenient to me. Mishra, Akman
and Mishra, 2014 ATB2 This type of app is necessary to me.
ATB3 This type of app is worth it.
Individual Impact
II1 The app enables me to accomplish changes more rapidly.
Urbach et al., 2010 II2 The app increases my citizenship.
II3 The app makes it easier to accomplish tasks.
II4 The app is useful for my citizenship role.
Organization al/City Impact
CI1 The app has helped my city improve the efficiency of internal operations.
Urbach et al., 2010 CI2 The app has helped my city improve the
quality of working results.
CI3 The app has helped my city enhance and improve coordination within the city. CI4 The app has helped my city make itself
an overall success.
Gamification
Gam1 Learning how to use this app with gamified elements would be most agreeable.
Aparicio, Oliveira, Bacao,
& Painho, 2019 Gam2 I enjoy using an app with gamified
elements.
Gam3 I would like to participate in games in a city app.
Gam4 I think that a city app with animated content is safe.
Gam5 City apps should award their users with points.
Gam6 I enjoy playing a game with a city app.
4.2.1 Data collection approach
For the purposes of this study, it was used a quantitative research. The need to interact with citizens, in order to collect insights on the research topic, was key. These insights, collected in a mathematical form, to enable modelling possible causes and relationships between events. Having this in mind, primary data (raw data) was collected using online surveys – distributed through
30
personal networks and social media. To develop this survey, interviews were made to city apps users in order to guide us on the dimensions to use. A qualitative research, using secondary data gathered from available information on the web, was also conducted just to provide more context to the main research. More specifically a study of all the services available in Lisbon, as well as the city’s characteristics.
i) Interviews
Interviews were conducted as a qualitative research, prior to the construct of the online survey. The interviews were done in person and booked at the interviewee’s convenience. The target was city app users and all 3 layers of apps available in Lisbon were covered. The questions were adapted from Krueger & Casey (2002) – from the paper “Gamification: A framework for designing software in e-banking” and split into two groups. First group consisted of demographic questions to help categorize the study sample and the second group consisted of 6 questions proposed by Krueger & Casey (2002). Six people were interviewed with clear understanding of the questions and no clarifications required. The apps assessed were Emel, Giral, Na minha rua, Orçamento participativo and iPenha. All materials can be found on the appendixes 4 and 5.
ii) Survey
The survey was built using Survey Monkey and made available online. The template designed can be found on the appendix 3 and is structured into 3 groups – demographic questions, city app used and questions from the research model – for a total of 56 questions. The survey was distributed by social media – Facebook, LinkedIn and Instagram, but also personal and professional contacts were made via e-mail, instant messaging and personal contact. The answers were collected between the end of April 2018 up until August 2019. During this period 237 answers were collected, 31,6% replied they do not use city app, 68,35% replied they did, for a total of 162 responses, but only 88 responses were valid.
iii) Inventory
Another layer of data analyzed were the services and applications available in Lisbon. This research was based on information found online and on IOS App store. As previously mentioned, the inventory was organized based on 3 layers of suppliers of services and applications in Lisbon – provided by the council, by parish councils and by third parties, found on appendix 1.
31 4.3 Data treatment approach
For the analysis of results, it was used the method of partial least squares structural equation modeling (PLS-SEM), to assess what influences the adoption of city apps. The PLS-SEM, has been broadly used in IT research and is most commonly used in exploratory researches’ theories (Hair Jr, Hult, Ringle, & Sarstedt, 2014), by explaining the variance of the model’s dependent variables. The most often reasons for applying PLS-SEM is mostly because of data characteristic such as minimum sample size, non-normal data and scale of measurement. For this research was due to the minimum sample size and predicting specific key dimensions for adoption of city apps. PLS-SEM initiates on path models with latent variables. Path models (Hair Jr et al., 2014) are representations of the hypotheses and variable relationships that are examined by the application of the structural equation modeling. The data analysis is then divided into two evaluations: the structural model (inner model, represents the dimensions/constructs being evaluated and the relationships between them); the measurement model (outer model, displays the relationships between the constructs and the indicator variables).
The measurement model is the first to be evaluated through the analysis of convergence validity (through the average variance extracted (AVE)), reliability analysis (through Alpha Cronbach and composite reliability) and discriminant validity (through cross-loading and Fornell and Lackner criteria). The structural model is evaluated secondly through the analysis of the Pearson’s determinant coefficients (R2, variance portion of the latent variables explained by the model) and analysis of the significance (correlations and regressions between latent variables).
32
Chap. 5 – Data Analysis and results
5.1 Sample analysis
For this research we target an active adult population that lives, works and/or studies in the city of Lisbon. In order to analyze the net benefits of using city apps we are dependent on
individuals’ behaviors. The survey reached 237 individuals but only 88 responses were
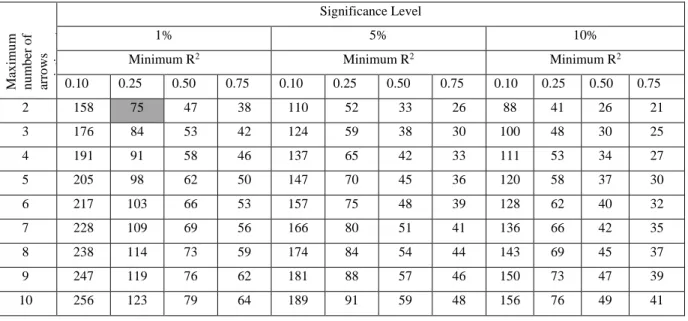
considered valid. In order to use PLS-SEM, Cohen (1992) suggests the ideal sample size to be of 75 samples for an 80% statistic power, for a maximum of two relationships per construct. Since our sample has 88 samples, (Cohen, 1992) the expected significance is of 1% and a R2 of 0,25 as shown on table 6.
Table 6 - Sample size recommendation in PLS-SEM for a statistical power of 80%. Cohen (1992)
M ax imu m n u m b er o f arro ws p o in ti n g a t a co n stru ct Significance Level 1% 5% 10%
Minimum R2 Minimum R2 Minimum R2
0.10 0.25 0.50 0.75 0.10 0.25 0.50 0.75 0.10 0.25 0.50 0.75 2 158 75 47 38 110 52 33 26 88 41 26 21 3 176 84 53 42 124 59 38 30 100 48 30 25 4 191 91 58 46 137 65 42 33 111 53 34 27 5 205 98 62 50 147 70 45 36 120 58 37 30 6 217 103 66 53 157 75 48 39 128 62 40 32 7 228 109 69 56 166 80 51 41 136 66 42 35 8 238 114 73 59 174 84 54 44 143 69 45 37 9 247 119 76 62 181 88 57 46 150 73 47 39 10 256 123 79 64 189 91 59 48 156 76 49 41
The population sample exhibits 61.18% of female responders, with predominant ages between 19 and 48 years of age and 88.18% having an education corresponding to a bachelor’s degree or higher. From the individuals approached 80.59% lived in Lisbon and the city app most used was Emel, with 67.05% of the answers (table 7).