Repositório ISCTE-IUL
Deposited in Repositório ISCTE-IUL:2020-04-03
Deposited version:
Post-print
Peer-review status of attached file:
Peer-reviewed
Citation for published item:
Gulamhussen, M. A. (2007). Choice of scale by banks in financial centers. International Business Review . 16 (4), 507-525
Further information on publisher's website:
10.1016/j.ibusrev.2007.04.002
Publisher's copyright statement:
This is the peer reviewed version of the following article: Gulamhussen, M. A. (2007). Choice of scale by banks in financial centers. International Business Review . 16 (4), 507-525, which has been published in final form at https://dx.doi.org/10.1016/j.ibusrev.2007.04.002. This article may be used for non-commercial purposes in accordance with the Publisher's Terms and Conditions for
self-archiving.
Use policy
Creative Commons CC BY 4.0
The full-text may be used and/or reproduced, and given to third parties in any format or medium, without prior permission or charge, for personal research or study, educational, or not-for-profit purposes provided that:
• a full bibliographic reference is made to the original source • a link is made to the metadata record in the Repository • the full-text is not changed in any way
Choice of scale by banks in financial centers*
Mohamed Azzim Gulamhussen**
Abstract
The paper develops a theoretical link between foreign investment, scale and reversibility in the banking industry. This link is used to formulate hypotheses that are empirically examined with a unique data set collected through interviews with senior managers of multinational banks in London. Findings reveal that banks do not set up large operations to service domestic customers or get a foothold, but do so to create hubs. Banks with confident beliefs set up large operations, and use large offices to lock themselves into the market. These results explain the cross-sectional variation in the size of foreign
investments in the industry. Robustness checks do not reveal presence of influential data points; regressions are stable over time and consistent with what we know from
secondary samples.
JEL classification: F21; G20;
Keywords: International investment; financial institutions and services.
* I am grateful to the managers who participated in the study. I benefited from detailed comments made by
Raj Aggarwal, Peter Buckley, Mark Casson, Geoffrey Jones, Lars Oxelheim, Brian-Scott Quinn, three anonymous referees and participants at the Bank of England Financial Stability Seminars in 2002, the 31st
Australasian Conference in Banking and Finance in 2003 and EFMA meetings in Basel in 2004. I acknowledge the financial support from the International Securities Market Association. The usual caveat applies.
** ISCTE BUSINESS SCHOOL Av Forcas Armadas 101 B 1649-026 Lisbon Portugal
Choice of scale by banks in financial centers 1. Introduction
The theory of internalization applied to the banking firm explains the ownership and location of bank offices in foreign markets (Buckley and Casson, 1976; Aliber, 1976; 1984). The assumption is that the source country bank owns a monopolistic advantage which it can choose to employ either in the domestic or foreign market at a low to zero marginal cost. The domestic bank can appropriate greater rent by exploiting the
advantage through an internal market rather than the external market. In addition, the lack of patent or copyright protection on most banking innovations means that banks are often constrained from exploiting ownership advantages abroad through licensing, franchising or joint venture arrangements (see for example Esperanca and Gulamhussen, 2001).
Among various location factors that attract banks to foreign markets are those of a regulatory nature and those connected to the distinctive features of the financial market (Dunning, 1977). A market where the banking sector is protected or other inefficiencies are present, offers greater opportunities for new entrants (Williams, 1997). By contrast, financial centers are markets where the banking sector is well developed and attracts foreign banks due to external economies of agglomeration. These markets are
characterized by a stable legal and regulatory environment that permits entry of foreign banks; they also have an adequate infrastructure, particularly for physical and electronic communication. (Kindleberger, 1974; Davis, 1990). The presence of several sellers of similar but not identical services in one location increases the number of competitors for the existing business with a concomitant increase in the total market size due to a
Banks derive revenues in these centers from activities that are independent of the presence of other banks and from activities that are enhanced by the agglomeration of other banks (Choi, Tschoegl, and Yu, 1986). Activities that are independent of the presence of other banks comprise trade related finance and services to domestic customers with whom they have information processing advantages. Major cities that host financial centers provide a convenient location for such activities. They are often the site for many corporate headquarters, major distribution points, and centers for
communication networks. Foreign banks can establish offices and operate profitably in the activity of servicing domestic customers without being affected by whether or not there are other banks engaging in similar activities. All that banks require is an office to facilitate contact with their domestic customers (Ursacki and Vertinsky, 1992).
Agglomeration of banks enables the emergence of activities that are related to foreign exchange and money market trading and those that are independent of trading. These latter activities comprise deposit taking, lending, syndicated loans, management of Eurobond issues and derivatives to diverse and geographically disperse customers
(Benston and Smith, 1976). Size is a prerequisite for involvement in these activities since it is perceived as an indicator of asset quality (Campbell and Kracaw, 1980). This
signalling advantage is valued by customers seeking international banking relationships as a means of certifying to the financial markets that they are conducting themselves appropriately (Berlin, 1987).
Banks that do not intend to commit all resources at the outset (or do not have resources to set up large operations) specialize in offering similar but not identical tailor-made financial packages (Diamond and Dybvig, 1983) and monitoring of market
conditions (Diamond, 1984). In this case a small foothold is sufficient to aid physical interaction and face-to-face communication. Banks that engage in activities that require a sizeable presence are also likely to vertically integrate both upstream activities such as deposit taking with downstream activities such as financial advisory activities (Casson, 1990).
Offices set up to provide specialized services or to monitor markets are more flexible than offices set up to engage in activities that require sinking a significant amount of resources. Staff hiring and training costs; time and effort spent in building local contacts and reputation are examples of sunk costs. Opening small offices when business
conditions are risky gives banks the flexibility to pack and leave without loss of reputation when market conditions turn out sour.1 Small offices also require less regulatory maneuvering and cause fewer problems if closed down. Banks that set up small offices also have the flexibility to quickly expand the scale of operations if market conditions turn out propitious.
Large offices can be important in building and defending market power, thereby limiting the entry of rival banks. Large offices signal commitment to competitors and credibility to customers. But opening large offices at the outset increases the risk of making entry mistakes equated in terms of loss of reputation in case of closure (Cabral, 1993).2
1This picture of foreign investment is consistent with both the internationalization process of firms and the
theory of internalization with their emphasis on psychic distance that generates costs of doing business abroad (Johanson and Vahlne, 1977; Casson, 1995; Nachum, 2003). However, in this paper it is the perceived business risk that induces banks to exercise caution by undertaking small foreign investment.
2 Remaining tactically flexible is one way in which banks can minimize entry mistakes. Unlike banks that
set up highly specialized offices, banks setting up versatile offices that engage, for example, in both upstream and downstream activities have more flexibility to cope with uncertain market conditions (Clark,
This paper analyzes the cross sectional variation in scale of bank offices, which is in line with the research agenda set out by Buckley and Casson (1998) and Rugman and Li (2005). The next section develops the hypotheses. Section 3 describes the data collection procedure, the descriptive results of the data set and the method employed to empirically examine the model. Section 4 shows why the empirical findings reported in section 5 can be generalized to the population. Section 6 summarizes the main conclusions and
suggests avenues for future research.
2. Hypotheses
The paper in hand tests seven hypotheses: three relate the strategic orientation of foreign investment to the size of operation (H1-H3); two relate perceived business risk and lock-in to the size of operation (H4-H5); one relates to the decision to expand the size of operations after the initial establishment of an office (H6); and the last relates size to entry mistakes (H7).
One of the most important monopolistic advantages in the expansion of banks in foreign markets is the reputation amongst domestic customers and a special
knowledge of their needs. This resource, based on relational contracting, gives banks a privileged opportunity to follow their customers abroad. Empirical evidence based on aggregate data confirms the positive relationship between trade and
manufacturing investment (variables that are used as proxies for measuring advantages
exploit flexibility. These hubs have low transport costs to a wide range of destinations. If production is concentrated, distribution can be handled at arm’s length or through satellite offices. As long as business risks affecting regional markets are independent or less than perfectly correlated, hubs generate gains from product diversification (Buckley and Casson, 1998; Sassen, 1999). Hubs work best under two conditions of flexibility: the office’s ability to switch from producing one product to another and its ability to source different regional markets from the hub (Casson and Gulamhussen, 1998). Dunning (1988) claims that increased risk of doing business in international markets leads firms to engage in rationalization across markets and pursue regional market sourcing strategies.
derived from provision of services to domestic customers) and foreign investment of banks. Goldberg and Saunders (1980; 1981a; b), Hultman and McGee (1989), Grosse and Goldberg (1991), Heinkel and Levi (1992) and Fisher and Molyneux (1996) confirm the positive relationship between trade and investment, and foreign bank activity. Thus one would expect that the greater the number of domestic customers in a particular market, the larger would be the size of the office.
Hypothesis 1: The relationship between the strategic orientation to follow domestic customers and the initial size of investment will be positive.
Banks that intend to engage in activities that are not independent of the presence of other banks but want to be cautious (or do not have the resources to set up large offices) will initially specialize in the provision of similar but not identical tailor made value-added products, and monitoring of markets feeding parent banks with quick and decisive information. A small foothold in the market should suffice to engage in these activities. Ball and Tschoegl (1982) find that US banks initially set up small offices in Tokyo and only in later years started to engage in activities that require the commitment of
significant resources. This picture of cautious-incremental foreign investment is consistent with the Scandinavian literature on the internationalization process of firms (Johanson and Vahlne, 1977) and the theory of internalization (Casson, 1995).
Hypothesis 2: The relationship between the strategic orientation to get a foothold to service foreign markets and size of investment will be positive.
Banks with an intention to engage in innovative financial products such syndicated loans, Eurobond issues, portfolio management or derivatives need to sink significant resources in accumulating a reputation in the provision of state of the art products and
services. Size acts as an important signal for customers that shop for such sophisticated products at financial centers. Advances in information technology facilitate the
centralization of large information resources in areas such as derivatives trading and market forecasting on a global basis at financial centers (Pozzolo and Focarelli, 2001).
Ursacki and Vertinsky (1992) find a positive relationship between capitalization ratio (capital: assets) and scale of foreign bank offices in Tokyo. Brealey and Kaplanis (1996) could not explain the abnormal scale of foreign banks in financial centers on the basis of levels of trade and manufacturing foreign investment and market size of financial centers. Why banks set up large operations in financial centers is an issue that is well grounded in theory (see for example Casson, 1990) but open to empirical clarification.
Hypothesis 3: The relationship between the strategic orientation to create hub and the initial size of investment will be positive.
Business risk is an important element in the location of bank offices. The size of investment hinges critically on managers’ subjective beliefs about the true state of foreign demand conditions. It is on the basis of these subjective beliefs that banks choose the appropriate size of investment. Banks that perceive low business risk (or have confident beliefs) will set up large operations whereas banks that perceive high risk (have
conservative beliefs) will set up small operations (Buckley and Casson, 1998).
Campa (1993) finds that foreign firms investing in the US wholesale trade industry faced heightened perceived business risk and sunk costs which led to a delay in entry (not analyzed in this study), and Kogut and Chang (1996) find that high perceived business risk resulted in Japanese electronic equipment manufacturers setting up small plants in the US.
Hypothesis 4: The relationship between perceived business risk and the initial size of investment will be negative.
Banks that undertake a small investment acquire an implicit option to either divest or expand in the future. This option exists because of the intrinsic nature of the office and not because of a contract with any other party. The office can be sold to another party but the right cannot be sold separately. A relevant feature of a small investment is that it reduces the cost of withdrawal from the foreign market later on. When banks undertake small investments, they avoid the sunk costs involved with large investments. However, in the face of competition, banks may have to lock themselves into an inflexible position by undertaking large investment (Schelling, 1960). Those banks are more likely to stay and fight new entrants than are banks that can easily close their offices. Small
investments will be more reversible than large investments (Casson, 2000).
Benito (2005) shows that firms pursuing regional sourcing strategies are more likely to be locked into foreign markets. Clare, Gulamhussen, and Pinkowska (2006) also estimate a three to one ratio for closure of small bank offices when compared to large offices in London.
Hypothesis 5: The relationship between lock-in and the initial size of investment will be positive.
Banks that set up small offices in foreign markets will at some point in the future decide to expand the initial scale of operations on the basis of demand conditions. If demand conditions are favorable banks with small offices will exercise the option to expand the initial scale of offices. Banks with large offices may at some time in the future need to expand the initial size of offices to maintain leadership in the market by opening
new desks. Ball and Tschoegl (1982) find that foreign banks in Tokyo expanded the initial size of investment in later years. Since both small and large offices can decide to expand in the foreign market a positive sign is expected for this hypothesis.
Hypothesis 6: The relationship between the decision to expand and the initial size of investment will be positive.
Mistakes can be observed in the form of heavy financial losses that banks suffer after entry or loss of reputation that banks have to endure for having to exit a particular line of activity due to lack of trust from transacting parties. Small investments are useful to avoid entry mistakes because they avert sunk costs associated with large investments. Large offices on the other hand are useful to signal market power and leadership in the business but can prove risky if market conditions turn sour and banks have to suffer heavy
financial losses or loss of reputation.
Hypothesis 7: The relationship between the entry mistakes and the initial size of investment will be positive.
3. Data and method
The primary data was collected through face-to-face interviews with senior
managers, who had a good understanding of the bank’s overall strategy; they took place on the banks’ premises in the City of London between August 1999 and January 2001. In future research it would be desirable to extend the analysis to the scale of bank offices in other financial centers. An empirical test of the factors that influence choice of scale of banks in a single host country controls for host country effects that can obscure bank-specific factors of interest to the study. Secondary data on financial ratios of banks was
extracted from the FITCHIBCA database. This secondary data set is analyzed in the next section. This exercise shows that the results can be generalized.
The semi-structured interviews were conducted with managers nominated by the bank. Two pre-tests of the questionnaire were done prior to final implementation. They were invited to discuss the list of questions that I mailed or faxed beforehand. The questionnaire included 19 questions. This study analyses 6 questions that yielded the 15 variables considered most appropriate according to the theory to analyze size of
investment. These 6 questions, the coding procedure adopted and the mnemonic used to identify the variable is summarized in Table 1. The coding procedure adopted was the one that managers felt most comfortable with. The remaining questions will be used to analyze the timing of entry and the ownership and entry mode in a different paper.The interviews were followed up with telephone interviews with the manager or other colleagues of the manager or the head of the corporate communications department. Besides the statistical analyses, face-to-face interviews enabled the preparation of
individual case histories averaging 4 pages containing details specific to each bank. These individual case histories allowed a proper understanding of the historical, country and bank-specific characteristics in which the set up of offices took place. In order to maintain confidentiality of certain data, and because it was considered inappropriate to publish evaluations and comparisons of specific institutions, the individual case studies and identities of the institutions are not being made available. A full explanation of the methodology, data set and variable specification can be obtained from the author. A very similar approach was employed by Rhoades (1998) to analyze the efficiency of bank mergers.
INSERT TABLE 1 ABOUT HERE
As generally happens with surveys, we relied on the willingness of banks to respond and provide extremely sensitive data. It is my belief that managers would not have
participated in the study if they did not intend to be truthful.3 Great care was also taken in designing the questions of the survey and conducting the pre-test. The interviews were conducted with senior managers appointed by the banks and who had a good
understanding of the entry decision. Furthermore, the initial interviews were followed up with interviews with the managers’ colleagues and the corporate communications
department that store the archival records. I am aware that the responses to the questions are on an ex post basis. It would be useful in the future to interview managers that actually made the decisions. The survey generates a unique output that not only
complements what we know from conventional secondary samples and clinical analyses but can also prove useful in building new theories (Friedman, 1953; Stigler, 1966; Shackle, 1970; Campbell and Harvey, 2001).
The sample is part of a population of investment banks that are affiliated to the International Securities Market Association (ISMA), the self-regulatory organization and trade association for the international securities markets. ISMA has about 800 members in 51 countries, 129 of which are in the United Kingdom. Of the latter, 59 banks agreed to participate in the study and nominated either the Chief Executive for Europe or a Managing Director, and in some cases both, to be interviewed. The sample represents 46% of the population approached to participate in the study. Even if one considers that
3 Casson and Wadeson (1999) contend that general persistent information is most suitable for memorizing
because it remains important for organizations for a long time. Transitory information is unsuitable for memorizing, although recording of transitory information that is continually updated may also prove useful
there are 250 investment bank offices in London, our sample represents 26% of this population. According to Graham and Harvey (2001) this is a very good response rate for surveys. The sample size in hand is roughly equivalent to the sample size of earlier micro analytic empirical studies: Ball and Tschoegl (1982) uses a sample of 95 US banks that set up offices in Japan and 48 Japanese banks (6 independent variables) that set up offices in the US (California); Ursacki and Vertisnky (1992) uses a sample of 66 banks that set up offices in Japan and 37 banks (5 independent variables) that set up offices in Korea; and Yamori (1998) uses a sample of 44 observations (8 independent variables) of Japanese banks that set up offices in foreign markets.
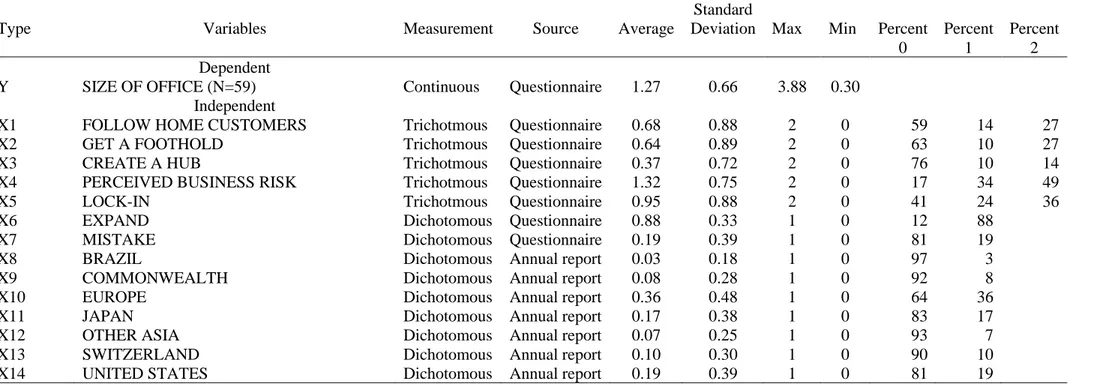
The data set for this paper comprises 1 dependent variable (Y) and 14 independent variables (X1- X14). Of these 14 independent variables, 3 variables (X1-X3) relate to strategic orientations; 3 variables (X4- X6) relate to perceived business risk, lock-in and if the bank expanded the initial size of the office; 1 variable (X7) relates to entry
mistakes; and 7 variables (X8- X14) relate to unobserved domestic market advantages. The data set is summarized in Table 2.
INSERT TABLE 2 ABOUT HERE
The responses show that banks initially set up offices with varying sizes (Y). I follow Urascki and Vertinsky (1992) and Brealey and Kaplanis (1996) in using the logarithmic transform. Strategic orientations – FOLLOW HOME CUSTOMERS (X1), GET A FOOTHOLD (X2), and CREATE A HUB (X3), were ascribed importance in descending order. The strategic orientation to FOLLOW HOME CUSTOMERS (X1) was considered to be important or very important by 41% of the banks; the strategic orientation to GET A FOOTHOLD (X2) was considered to be important or very important by 37% of the banks
in the sample; and the strategic orientation to CREATE A HUB (X3) was considered to be important or very important by 24% of the banks in the sample. Activities that involve providing services to domestic customers continue to be important in financial centers but other activities are also relevant. A significant proportion of banks in the sample set up offices to monitor the market. Few banks set up offices to service a wide range of markets and products.
The responses to the question on PERCEIVED BUSINESS RISK (X4) show that business risk is an important element in foreign investment: 17% of the banks in the sample perceived low risk or in other words had confident beliefs; 34% of the banks perceived medium risk or in other words were cautious; and 49% of the banks perceived high risk or in other words had conservative beliefs. The responses to the question on LOCK-IN (X5) suggest that a significant proportion of banks in the sample locked themselves to the market at the outset: 41% of the offices initially set up by banks were reversible; 24% were more or less reversible; and 36% were totally irreversible.
The arithmetic average of EXPAND (X6) reveals that 88% increased the size of their offices after the initial set up and 12% contracted the initial size of the office. None of the banks in the sample maintained their initial size or withdrew from the market.4 The arithmetic average of MISTAKES (X7) reveals that in light of what was learnt only 19% of the banks would proceed differently when setting up offices. Entry mistakes is a
4 EXPAND (X6) is a dichotomous variable that equals 0 if the bank contracted the initial size of the office
and 1 if the bank expanded the initial size of the office. The survey gave managers four alternatives to answer this question: 0 if the banks divested completely; 1 if the bank divested partially; 2 if the bank neither divested not expanded; and 3 if the bank expanded by undertaking additional investment. All banks in the sample either divested partially or expanded by undertaking initial investment. For this reason the
powerful concept in theory but difficult to estimate in practice. It would be desirable in the future to use other proxies that capture this effect.
Banks originating in countries that have a sound reputation for providing state of the art products and services in banking are significantly represented in the sample: 36% of the banks in the sample are from western European (X10) countries; 19% from the US (X14); 17% from Japan (X11); and 10% from Switzerland (X13). The presence of banks from other countries is relatively low: 8% are from Australia (2%) and Canada (6%), grouped as Commonwealth (X9); 7% from other Asian countries (X12); and 3% from Brazil (X8). I group Australia and Canada into Commonwealth countries in order to avoid losing degrees of freedom in the empirical estimations.
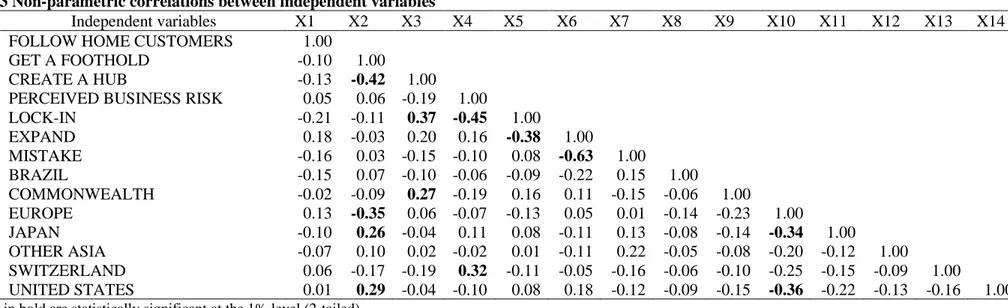
Non-parametric correlations between the independent variables are shown in Table 3. This table is a 14x14 matrix in which each of the cells represents the correlation of the variable in the column with the variable in the row. Bold letters show statistically significant correlations at 1% level (2-tailed test). It can be observed from the table that there are no correlations between independent variables that can create a potential bias in the estimation of parameters.
INSERT TABLE 3 ABOUT HERE
The model can be stated in the form tested and with the sign of each coefficient representing the direction of effect of each factor:
Y (INITIAL SIZE OF THE OFFICE) = a + bX1 (FOLLOW HOME CUSTOMERS) – bX2 (GET A FOOTHOLD) + bX3 (CREATE A HUB) – bX4 (PERCEIVED BUSINESS RISK) + bX5 (LOCKIN) /+ bX6 (EXPAND) + bX7 (MISTAKE) /+ bX8 (BRAZIL)
-/+ bX9 (COMMONWEALTH) --/+ bX10 (EUROPE) --/+ bX11 (JAPAN) --/+ bX12 (OTHER ASIA) -/+ bX13 (SWITZERLAND) -/+ bX14 (UK) -/+ bX15 (US)
Following Brealey and Kaplanis (1996), I estimate the relation between the independent variables and the initial size of investment through ordinary least squares regression. Corrected standard errors are computed in order to appropriately weight observations with high and low error variances using a procedure suggested by White (1978).5
The small sample size did not allow a direct test of choice of scale conditional on the organizational form (representative offices, branches, and subsidiaries). Such a test could be implemented by estimating the relationship through three-stage least squares or seemingly unrelated regressions. This would lead to considerable loss in the degrees of freedom in the estimations for the sample in hand. The sample is also censored. If data were available it would be more appropriate to use a double hurdle model where the first stage is the decision to enter London and the second hurdle is survival. These are
certainly promising avenues for future research.
I report the empirical findings in section 5. In the next section, I analyze the secondary sample and address other data issues.
4. Other data issues
5 In the case of non-constant variances, ordinary least squares estimation places more weight on
observations with high error variances than with small error variances. The weighting occurs because the sum-of-squared residuals associated with large error terms are likely to be substantially higher than the sum-of-squared residuals associated with low variance errors. Consistent estimators (of the correct variances) can be obtained by substituting the square of each regression residual for its variance. An alternative is to estimate the relation between initial size of office and independent variables using a generalized least squares regression.
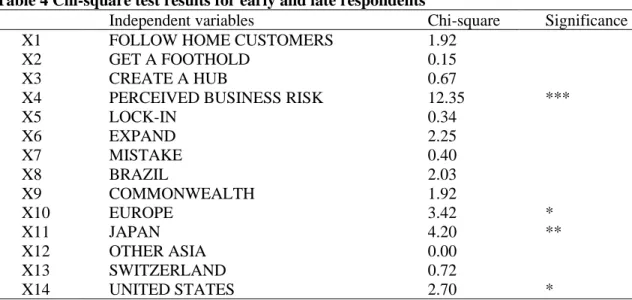
I conducted two experiments suggested by Graham and Harvey (2001) to investigate potential non-response bias to the results of the study.6 In the first experiment I compare the answers to the questionnaire of early respondents with those of late respondents (Wallace and Mellor, 1988). The late respondents can be thought of as part of the non-response group. To compare the non-responses of early and late respondents I computed chi-square statistics that are displayed in Table 4. Of the 14 variables compared, early and late respondents differ in the PERCEIVED BUSINESS RISK (X4) and early respondents from EUROPE (X10), JAPAN (X11) and the US (X14) differ from the late entrants. In the next section I also estimate partial regressions for early and late entrants.
INSERT TABLE 4 ABOUT HERE
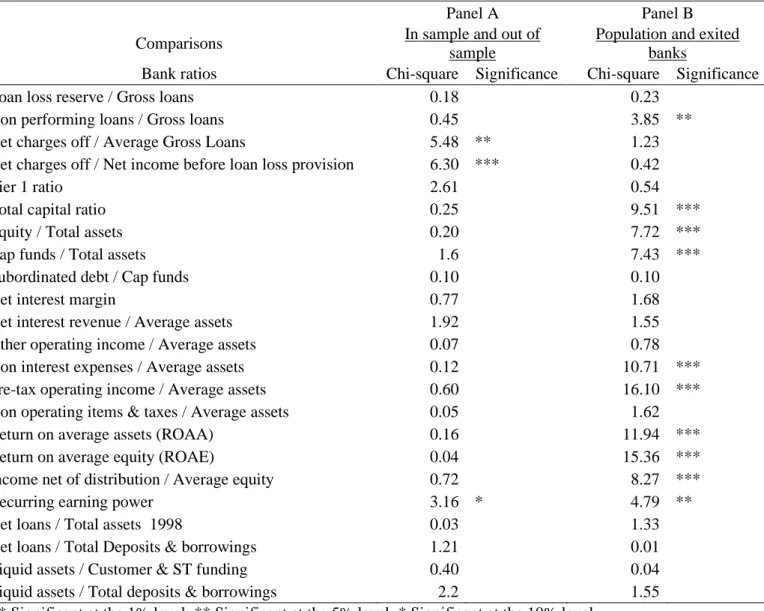
In the second experiment I use the secondary sample to compare the characteristics of respondent banks to the non-respondent banks (Moore and Reichert, 1983). If the characteristics of the two groups match, then the sample can be considered representative of the population. I extracted accounting ratios from the FITCHIBCA database (see Table 5) and compared the ratios of banks that responded to the questionnaire and ratios of banks that did not respond to the questionnaire (Panel A); and ratios of banks that are part of the population and ratios of banks that already withdrew from London (Panel B). I report the chi-square statistics in Table 5. In Panel A of Table 5, of the 23 ratios
compared, banks that are part of the sample and banks that are out of the sample differed only in 3 ratios (2 ratios relating net charges off and 1 ratio to recurring earning power) suggesting that the results can be generalised to the population.
In Panel B of Table 5, of the 23 ratios compared, banks that survived in London and banks that did not survive do not differ in 13 ratios (57%). Of the 10 out of 23 ratios (43%) in which these two groups of banks differ, 8 ratios (34%) are statistically significant at the 1% level and 2 ratios (9%) at the 5% level. Overall banks differ in 1 ratio that relates to asset quality (non performing loans to gross loans); 3 capital ratios (total capital ratio, equity to total assets and capital funds to total assets); and 6 operating performance ratios (non interest expenses and pre-tax operating income to average assets, return on average assets and equity, income to average equity and recurring earning power). Banks that belong to the population and banks that exited do not differ in
liquidity ratios. To understand the dynamics of exit it might be useful to interview banks that exit foreign markets. This is a fruitful area for future research.
INSERT TABLE 5 ABOUT HERE
5. Empirical findings
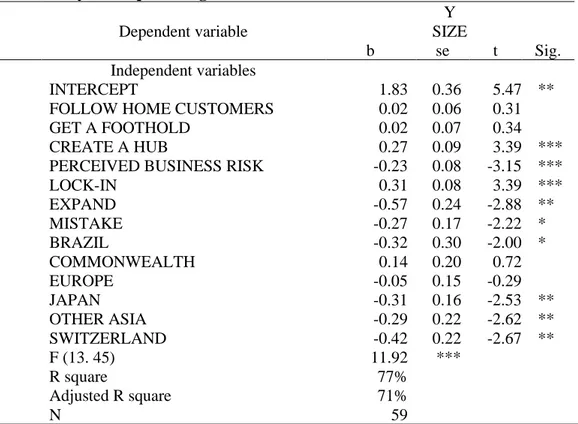
The empirical findings are reported in Table 6. The regression is significant at the 1% level and the coefficients explain 71% of the cross-section variation in the size of offices (Y) in London.7 The estimation confirms positive relationship between FOLLOW HOME CUSTOMERS (X1) and the initial size of the office. But this relationship is not
significant at a statistically meaningful level. Ursacki and Vertinsky (1992) find the presence of only small groups of domestic customers with whom foreign banks have an advantage in processing information in Tokyo. For this reason, in their paper also variables used to proxy the follow the customer hypothesis do not show sufficient
7 Ordinary least squares regressions in Ball and Tschoegl (1982) explain 51% (Japan) and 70% (California)
of the variation in the decision to expand and in Ursacki and Vertinsky (1992) explain 72% (Japan) and 60% (Korea) of the variation in the size of offices set up by foreign banks (measured as number of employees, a variable similar to the one used in this paper).
variation to be statistically significant at any meaningful level. GET A FOOTHOLD (X2) is positively related to the initial size of office. However, the relationship is not
significant. If the objective is to gather information on the foreign market, a small investment should suffice. It is the presence and not the size that is important in monitoring markets. The estimation also confirms a positive relation between the strategic orientation to CREATE A HUB (X3) and size of foreign bank offices. This relationship is significant at the 1% level of significance. Previous studies confirm the importance of the size of the local market but were not able to infer the strategic orientation from secondary data. The competitive environment in the international banking environment appears to have encouraged banks to move away from individual market sourcing strategies to regional market sourcing strategies by putting hubs in a location that is inherently flexible. Major structural changes in the nature of the international business environment have also forced firms in many other industries to engage in rationalization across different countries and to pursue global market sourcing strategies (Dunning, 1988).
The results confirm a negative relationship between PERCEIVED BUSINESS RISK (X4) and size of bank offices. Banks that perceived low risk or had confident beliefs set up large operations. Existing theories of international business emphasize the importance of psychic distance that increases the cost of doing business abroad. In order to reduce liability of foreignness, firms expand into foreign markets in a sequence where culturally similar markets are entered first. When business conditions are volatile banks expand in stages in a very similar but not identical manner to the existing creed in international business theory. The subjective assessment of business conditions determines the size of
investment. The results also confirm a positive relation between LOCK-IN (X5) and size. This finding is consistent with the historical account presented by Jones (1992) in that banks competing to invest in London were lured by pure prospects of profit from the size of the market. The initial tendency to centralize large information resources in London generated not only impetus for further growth but also reluctance to exit the market for fear of possible loss of reputation.
The findings show a negative relation between EXPAND (X6) and MISTAKES (X7) and the initial size of office. Interviews with managers revealed that contraction after the initial set up was related to closure of some desks. The negative relationship between MISTAKES (X7) and initial size of office suggests that banks that set up large offices would not proceed in a different way in light of what they learnt from the initial entry decision. Interviews with managers of large offices revealed that they did not consider occasional firing of staff related to closure of desks to be a mistake. Interviews with smaller entrants revealed that they considered their initial size a mistake because they could not engage in a range of profitable activities in which large banks could get involved.
Compared to banks from the US (X14), banks from BRAZIL (X8), JAPAN (X11), other ASIAN (X12) countries and SWITZERLAND (X13) set up small offices. This is a surprising result because these countries are at different stages of economic development. One possible explanation is the perceived business risk of banks originating from these countries. Non-parametric correlations between these variables and PERCEIVED BUSINESS RISK (X4) showed that banks from JAPAN (X11) and SWITZERLAND (X13) had conservative beliefs (positively related) whereas banks from BRAZIL (X8)
and other ASIAN (X12) countries had confident beliefs (negatively related). It would certainly be difficult to otherwise believe that banks originating from both developed and developing countries had similar behavior.
INSERT TABLE 6 ABOUT HERE
As expected few alternative institutional modes were observed. A dummy variable for joint ventures and acquisitions did not turn out to be significant at any statistically
meaningful level. One possible explanation is that regressions for ownership and location decisions have to be estimated separately.
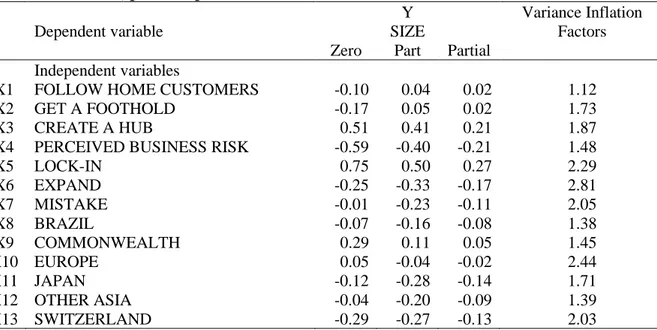
Zero-order, part and partial correlations and variance inflation factors reported in Table 7 reveal that the EXPAND (X6) may be linearly related to other variables. Re-estimating the model without this variable did not change the results. Analysis of
studentized residuals showed that for a cut off point of 2.5 there is only 1 influential case in the sample (Pindyck and Rubinfeld, 1991). Re-estimating the model without the influential case did not change the empirical findings.
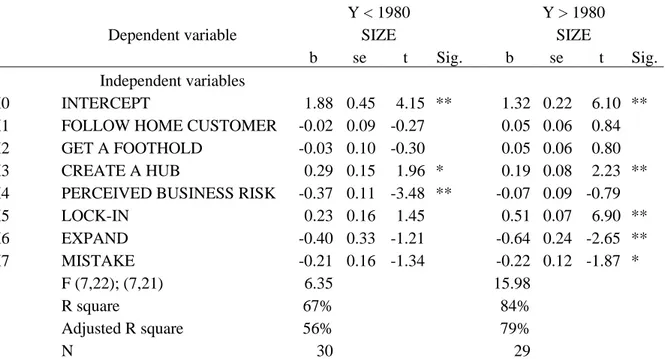
In order to verify the stability of the regressions, the sample was split into two at the midpoint (year 1980). The results are reported in Table 8. Panel A reports results for entries before 1980 and panel B reports results for entries after 1980. The decision to CREATE A HUB (X3) appears positively related to the initial size of office in both regressions. PERCEIVED BUSINESS RISK (X4) and LOCK-IN (X5) show similar signs in both regressions but PERCEIVED BUSINESS RISK (X4) is significant only in the regression before 1980 and LOCK-IN (X5) is significant only in the regression after 1980. EXPAND (X6) and MISTAKES (X7) also show similar signs but the variables are significant only in the regression after 1980. The regression coefficients show similar
signs to the regression coefficients for the full sample. The Chow-test does not lead to the rejection of the hypothesis that the coefficients are similar in the two periods. 8
INSERT TABLE 7, 8 AND 9 ABOUT HERE
The Big Bang would be a far more obvious break point in the history of multinational involvement in London. However, data limitations did not allow me to run the
regressions before and after this break point. I re-ran the regression with a dummy for Big Bang but it did not turn out to be significant at any statistically meaningful level.
6. Summary and conclusions
This paper empirically examines the choice of scale by foreign banks with a unique data set gathered through a survey on managers of banks in London. The findings show that strategic orientations to follow domestic customers or get a foothold to monitor markets remain important in the expansion of banks into foreign markets but do not require sizeable presence. The strategic orientation to create hubs to service regional markets does require a sizeable presence. Banks with confident beliefs set up large
operations, and these large offices lock them into the market. The unique findings explain the cross sectional variation in the scale of bank offices in London that otherwise could not be inferred from secondary sample analysis.
The existing literature explains foreign investment in banking under perfect certainty of demand conditions. In this setting the most important decision relates to the optimal timing of foreign investment. When demand conditions are risky the issue for banks is not only when to switch from exporting through correspondent banking relations to
8 + − − = = + + − − = + 4.69)/43 (1.62 4.69)/8 1.62 (5.74 F(8,43) 2k) -n )/(n ESS (ESS )/k ESS ESS (ESS 2k) -n n F(k, 2 1 UR2 ur1 UR2 ur1 R 2 1 = 0.4855 (<
foreign investment but also to choose a scale at the outset that offers fewer prospects for making mistakes. The present study shows that small offices can be used to provide specialized services or to monitor markets, and large offices to centralize resources useful in provision of sophisticated products of the kind shopped at financial centers. Unlike small offices, large offices lock banks to the market and increase the risks of making mistakes unless underpinned with product flexibility.
In order to improve the implications of the theoretical link developed in this paper, further research is desirable in certain areas. First, we need evidence on the scale of presence and strategic orientation of banks in other locations, especially emerging markets where the flexibility derived from foothold investments may be more appealing to banks at initial stages of entry. Second, it would be desirable to look at the initial strategic orientation and the decision to withdraw from foreign markets which is not done in this paper due to lack of data. Third, it would be desirable to look at the timing of entry and exit, especially whether perceived business risk and lock-in lead banks to delay entry or withdraw from the foreign market at a faster rate.
Bank mangers can use insights from the empirical findings in hand to manage risk in their foreign investment decisions. In absence of competitors managers can make a token commitment of resources at the initial stage of foreign investment and expand to its full size only after the investment ‘jumps’ a succession of hurdles. In presence of competitors banks can undertake large investments to signal market power and credibility to
customers. Policy-makers can expect closure of offices of small banks and consolidation of offices of large, though these large offices may go through occasional hiring and firing of employees to update their skill set.
References
Aliber, R. Z. (1976). Toward a theory of international banking. Economic Review, Spring, 5-8.
Aliber, R. Z. (1984). International banking: A survey. Journal of Money Credit and
Banking, 16/4, 661-78.
Ball, C. A. and Tschoegl, A. E. (1982). The decision to establish a foreign branch or subsidiary: An Application of Binary Classification Procedures, Journal of Financial
and Quantitative Analysis, 17/3, 411-24.
Benito, G. R. (2005). Divestment and international business strategy, Journal of
Economic Geography, 5, 235-251.
Benston, G. and Smith, C. (1976). A transaction cost approach to the theory of financial intermediation, Journal of Finance, 31, 215-31.
Berlin, M. (1987). Bank loans and marketable securities: How do financial contracts control borrowing firms? The Federal Reserve Bank of Philadelphia Business Review, July-August, 9-18.
Brealey, R. A. and Kaplanis, E. C. (1996). The Determination of foreign banking location.
Journal of International Money and Finance, 15, 577-597.
Buckley, P. J. and Casson, M. C. (1976) The Future of Multinational Enterprise. Macmillan Press, London.
Buckley, P. J. and Casson, M. C. (1998). Models of the multinational enterprise, Journal
of International Business Studies, 29/1, 21-44.
Cabral, L. (1993). Experience advantages and entry dynamics. Journal of Economic
Theory, 59, 403-416.
Campa, J, M. (1993). Entry by foreign firms in the United States under exchange rate uncertainty. The Review of Economics and Statistics, 75/4, 614-22.
Campbell, T. and Kracaw, M. (1980). Information production, market signalling, and the theory of financial intermediation, Journal of Finance, 35, 863-82.
Casson, M. C. (1990) Evolution of Multinational Banks: A Theoretical Perspective. In G. Jones (ed.) Banks as Multinationals. London: Routledge Publishing.
Casson, M. C. (2000) Economics of International Business: A New Research Agenda. Edward Elgar, Cheltenham.
Casson, M. C. and M.A. Gulamhussen (1998). Foreign direct investment and real options: Implications for globalization and regionalism. Presented at the Annual Conference of the ESRC International Economics Study Group, St. Anthony’s College, Oxford.
Casson, M.C. and N. Wadeson (1999). Bounded rationality, meta-rationality and the theory of international business. In Fred Burton, Malcolm Chapman and Adam Cross (Eds.), International Business Organization: Subsidiary Management, Entry
Strategies and Emerging Markets (pp. 119-40). London: Macmillan.
Choi, S., Tschoegl, A. E., and Yu, C. (1986). Banks and the world’s major financial centers: 1970-1980. Weltwirtschaftliches Archiv, 122 (1): 48-64.
Clark, G. L. ( 2002). London in the European financial services industry: locational advantages and product complementarities. Journal of Economic Geography, 2, 433-454.
Clare, A., Gulamhussen, M.A. and Pinkowska, E. (2006). Closure and survival of bank offices under uncertainty. Working paper, Cass Business School, City University. Davis, E. P. (1990). International financial centers – an industrial analysis. Bank of
England Discussion Paper 51.
Diamond, D. (1984). Financial intermediation and delegated monitoring. Review of
Economic Studies, 51, 393-414.
Diamond, D. and Dybvig, P. (1983). Bank runs, deposit insurance and liquidity, Journal
of Political Economy 91, 401-419.
Dunning, J. H. (1977) Trade, Location of Economic Activity and MNC: A Search for an Eclectic Approach. In B. Ohlin, P. O. Hesselborn, and P. M. Wijkman (eds.),
International Allocation of Economic Activity. London: MacMillan.
Dunning, J. H. (1988). The eclectic paradigm of international production and some possible extensions. Journal of International Business Studies, 29, 1-31.
Fisher, A. and Molyneux, P. (1996). A note on the determinants of foreign bank activity in London between 1980 and 1989. Journal of Applied Financial Economics, 6, 271-277.
Friedman, M. (1953) Essays in Positive Economics. Chicago: University of Chicago Press.
Goldberg, L. G. and Saunders, A. (1980). The causes of US bank expansion overseas: The case of Great Britain. Journal of Money, Credit and Banking, 12, 630-43.
Goldberg, L. G. and Saunders, A. (1981a). The determinants of foreign banking activity in the United States. Journal of Banking and Finance, 5/1, 17-32.
Goldberg, L. G. and Saunders, A. (1981b). The growth of organisational forms of foreign banks in the US. Journal of Money, Credit and Banking, 13/3, 365-74.
Goldberg, L. G. and Johnson, D. (1990). The Determinants of US Banking Activity Abroad. Journal of International Money and Finance, 9, 123-137.
Graham, J. R. and Harvey, C. R. (2001). The theory and practice of corporate finance: Evidence from the field. Journal of Financial Economics, 60, 187-243.
Grosse, R. and Goldberg, L. G. (1991). Foreign bank activity in the United States: An analysis by country of origin. Journal of Banking and Finance, 15: 1093-1112. Heinkel, R. L., and Levi, M. D. (1992). The structure of international banking. Journal of
International Money and Finance, 16, 251-72.
Jones, G. (1992) Multinational and International Banking. Aldershot: Edward Elgar Reference Collection.
Johanson, J. and Vahlne, J-E. (1977). The internationalization process of a firm - a model of knowledge development and increasing foreign market commitments. Journal of
International Business Studies, 8, 23-32.
Kogut, B. and Chang, S. J. (1996). Platform investments and volatile exchange rates: Direct investment in the U.S. by Japanese electronic companies. The Review of
Economics and Statistics, 28, 221-31.
Moore, J., and Reichert, A. (1983). An analysis of financial management techniques currently employed by large U.S. corporations. Journal of Business Finance and
Accounting, 10, 623-645.
Nachum, L. (2003). Liability of foreignness in global competition? Financial service affiliates in the City of London. Strategic Management Journal, 24, 1187-1208. Nigh, D., Cho, K. R. and Krishnan, S. (1986). The role of location related factors in US
banking involvement abroad: An empirical examination, Journal of International
Business Studies, Fall, 59-72.
Pindyck, R. S. and Rubinfeld, D. L. (1991) Econometric Models and Economic Forecasts. New York, McGraw-Hill, Inc.
Rhoades, S., (1998). The efficiency effects of bank mergers: An overview of case studies of nine mergers. Journal of Banking and Finance, 22, 273-91.
Ursacki, T. and Vertinsky, I. (1992). Choice of entry, timing and scale by foreign banks in Japan and Korea. Journal of banking and Finance, 16, 405-21.
Rugman, A. and Li, J. (2005) Real Options and International Investments. Edward Elgar, Cheltenham.
Sassen S. (1999). Global financial centers. Foreign Affairs, 78 (1) 75-87
Sabi, M. (1988). An application of the theory of foreign direct investment to multinational banking in LDCs, Journal of International Business Studies, 19, 433-447.
Shackle, G. L. S. (1970) Expectation, Enterprise and Profit. Cambridge: Cambridge University Press.
Schelling, T. (1960) The Strategy of Conflict. Cambridge, Harvard University Press. Taylor P. J., Beaverstock, J. V. Cook, G. A. S. and Pandit, N. R. (2003). Financial
Services Clustering and its Significance for London. Corporation of London: London.
Tschoegl, A. E., (1987). International retail banking as a strategy: an assessment, Journal
of International Business Studies 19(2), 67-88.
Wallace, R., and Mellor, C. (1988). Nonresponse bias in mail accounting surveys: A pedagogical note. British Accounting Review, 20, 131-139.
White, H., (1978). A heterosckedasticity consistent covariance matrix and a direct test for heterosckedasticity. Econometrica, 46, 817-38.
Williams, B., (1997). Positive theories of multinational banking: eclectic theory versus internalisation theory. Journal of Economic Surveys, 11, 71-100.
Yamori, N. (1998). A note on the location choice of multinational banks: The case of Japanese financial institutions. Journal of Banking and Finance, 22, 109-120.
Table 1 Questions analyzed in this paper
Question Variable Mnemonic Coding
1. What were the bank’s strategic objectives at the time the initial decision was made?
X1 X2 X3
FOLLOW HOME CUSTOMERS GET A FOOTHOLD
CREATE A HUB
Trichotomous
(0: not important; 1: important; 2: very important)
2. What was the size of the investment in number of employees? Y SIZE Continuous (number of employees) 3. How did the bank perceive the risk when it made the initial
investment?
X4 PERCEIVED BUSINESS RISK Trichotomous
(0: low risk; 1: mild risk; 2: high risk) 4. What options did the banks have in case this investment had not
performed according to expectation?
X5 LOCK-IN Trichotomous
(0: not locked-in; 1: more or less locked-in; 2: totally locked-in) 5. Has there been additional investment or divestment since the initial
investment was made?
X6 EXPAND Binary
(0: contract; 1: expand) 6. In light of what the bank has learnt would it proceed in a different
way?
X7 MISTAKE Binary
(0: would not proceed in a different way; 1: would proceed in a different way)
Table 2 Descriptive statistics of variables in the data set
Standard
Type Variables Measurement Source Average Deviation Max Min Percent Percent Percent
0 1 2
Dependent
Y SIZE OF OFFICE (N=59) Continuous Questionnaire 1.27 0.66 3.88 0.30
Independent
X1 FOLLOW HOME CUSTOMERS Trichotmous Questionnaire 0.68 0.88 2 0 59 14 27
X2 GET A FOOTHOLD Trichotmous Questionnaire 0.64 0.89 2 0 63 10 27
X3 CREATE A HUB Trichotmous Questionnaire 0.37 0.72 2 0 76 10 14
X4 PERCEIVED BUSINESS RISK Trichotmous Questionnaire 1.32 0.75 2 0 17 34 49
X5 LOCK-IN Trichotmous Questionnaire 0.95 0.88 2 0 41 24 36
X6 EXPAND Dichotomous Questionnaire 0.88 0.33 1 0 12 88
X7 MISTAKE Dichotomous Questionnaire 0.19 0.39 1 0 81 19
X8 BRAZIL Dichotomous Annual report 0.03 0.18 1 0 97 3
X9 COMMONWEALTH Dichotomous Annual report 0.08 0.28 1 0 92 8
X10 EUROPE Dichotomous Annual report 0.36 0.48 1 0 64 36
X11 JAPAN Dichotomous Annual report 0.17 0.38 1 0 83 17
X12 OTHER ASIA Dichotomous Annual report 0.07 0.25 1 0 93 7
X13 SWITZERLAND Dichotomous Annual report 0.10 0.30 1 0 90 10
Table 3 Non-parametric correlations between independent variables
Independent variables X1 X2 X3 X4 X5 X6 X7 X8 X9 X10 X11 X12 X13 X14
X1 FOLLOW HOME CUSTOMERS 1.00
X2 GET A FOOTHOLD -0.10 1.00
X3 CREATE A HUB -0.13 -0.42 1.00
X4 PERCEIVED BUSINESS RISK 0.05 0.06 -0.19 1.00
X5 LOCK-IN -0.21 -0.11 0.37 -0.45 1.00 X6 EXPAND 0.18 -0.03 0.20 0.16 -0.38 1.00 X7 MISTAKE -0.16 0.03 -0.15 -0.10 0.08 -0.63 1.00 X8 BRAZIL -0.15 0.07 -0.10 -0.06 -0.09 -0.22 0.15 1.00 X9 COMMONWEALTH -0.02 -0.09 0.27 -0.19 0.16 0.11 -0.15 -0.06 1.00 X10 EUROPE 0.13 -0.35 0.06 -0.07 -0.13 0.05 0.01 -0.14 -0.23 1.00 X11 JAPAN -0.10 0.26 -0.04 0.11 0.08 -0.11 0.13 -0.08 -0.14 -0.34 1.00 X12 OTHER ASIA -0.07 0.10 0.02 -0.02 0.01 -0.11 0.22 -0.05 -0.08 -0.20 -0.12 1.00 X13 SWITZERLAND 0.06 -0.17 -0.19 0.32 -0.11 -0.05 -0.16 -0.06 -0.10 -0.25 -0.15 -0.09 1.00 X14 UNITED STATES 0.01 0.29 -0.04 -0.10 0.08 0.18 -0.12 -0.09 -0.15 -0.36 -0.22 -0.13 -0.16 1.00
Table 4 Chi-square test results for early and late respondents
Independent variables Chi-square Significance
X1 FOLLOW HOME CUSTOMERS 1.92
X2 GET A FOOTHOLD 0.15
X3 CREATE A HUB 0.67
X4 PERCEIVED BUSINESS RISK 12.35 ***
X5 LOCK-IN 0.34 X6 EXPAND 2.25 X7 MISTAKE 0.40 X8 BRAZIL 2.03 X9 COMMONWEALTH 1.92 X10 EUROPE 3.42 * X11 JAPAN 4.20 ** X12 OTHER ASIA 0.00 X13 SWITZERLAND 0.72 X14 UNITED STATES 2.70 *
Table 5 Chi-square test results for in sample, out of sample banks and exited banks
Panel A Panel B
Comparisons In sample and out of
sample
Population and exited banks
Bank ratios Chi-square Significance Chi-square Significance
Loan loss reserve / Gross loans 0.18 0.23
Non performing loans / Gross loans 0.45 3.85 **
Net charges off / Average Gross Loans 5.48 ** 1.23
Net charges off / Net income before loan loss provision 6.30 *** 0.42
Tier 1 ratio 2.61 0.54
Total capital ratio 0.25 9.51 ***
Equity / Total assets 0.20 7.72 ***
Cap funds / Total assets 1.6 7.43 ***
Subordinated debt / Cap funds 0.10 0.10
Net interest margin 0.77 1.68
Net interest revenue / Average assets 1.92 1.55
Other operating income / Average assets 0.07 0.78
Non interest expenses / Average assets 0.12 10.71 ***
Pre-tax operating income / Average assets 0.60 16.10 ***
Non operating items & taxes / Average assets 0.05 1.62
Return on average assets (ROAA) 0.16 11.94 ***
Return on average equity (ROAE) 0.04 15.36 ***
Income net of distribution / Average equity 0.72 8.27 ***
Recurring earning power 3.16 * 4.79 **
Net loans / Total assets 1998 0.03 1.33
Net loans / Total Deposits & borrowings 1.21 0.01
Liquid assets / Customer & ST funding 0.40 0.04
Liquid assets / Total deposits & borrowings 2.2 1.55 *** Significant at the 1% level; ** Significant at the 5% level; * Significant at the 10% level
Table 6 Ordinary least squares regression for the size of office
Y
Dependent variable SIZE
b se t Sig.
Independent variables
X0 INTERCEPT 1.83 0.36 5.47 **
X1 FOLLOW HOME CUSTOMERS 0.02 0.06 0.31
X2 GET A FOOTHOLD 0.02 0.07 0.34
X3 CREATE A HUB 0.27 0.09 3.39 ***
X4 PERCEIVED BUSINESS RISK -0.23 0.08 -3.15 ***
X5 LOCK-IN 0.31 0.08 3.39 *** X6 EXPAND -0.57 0.24 -2.88 ** X7 MISTAKE -0.27 0.17 -2.22 * X8 BRAZIL -0.32 0.30 -2.00 * X9 COMMONWEALTH 0.14 0.20 0.72 X10 EUROPE -0.05 0.15 -0.29 X11 JAPAN -0.31 0.16 -2.53 ** X12 OTHER ASIA -0.29 0.22 -2.62 ** X13 SWITZERLAND -0.42 0.22 -2.67 ** F (13. 45) 11.92 *** R square 77% Adjusted R square 71% N 59
*** Significant at the 1% level; ** Significant at the 5% level; * Significant at the 10% level
Table 7 Zero-order, part and partial coefficients and variance inflation factors
Y Variance Inflation
Dependent variable SIZE Factors
Zero Part Partial
Independent variables
X1 FOLLOW HOME CUSTOMERS -0.10 0.04 0.02 1.12
X2 GET A FOOTHOLD -0.17 0.05 0.02 1.73
X3 CREATE A HUB 0.51 0.41 0.21 1.87
X4 PERCEIVED BUSINESS RISK -0.59 -0.40 -0.21 1.48
X5 LOCK-IN 0.75 0.50 0.27 2.29 X6 EXPAND -0.25 -0.33 -0.17 2.81 X7 MISTAKE -0.01 -0.23 -0.11 2.05 X8 BRAZIL -0.07 -0.16 -0.08 1.38 X9 COMMONWEALTH 0.29 0.11 0.05 1.45 X10 EUROPE 0.05 -0.04 -0.02 2.44 X11 JAPAN -0.12 -0.28 -0.14 1.71 X12 OTHER ASIA -0.04 -0.20 -0.09 1.39 X13 SWITZERLAND -0.29 -0.27 -0.13 2.03
Table 8 Ordinary least squares regression for the size of office
Y < 1980 Y > 1980
Dependent variable SIZE SIZE
b se t Sig. b se t Sig.
Independent variables
X0 INTERCEPT 1.88 0.45 4.15 ** 1.32 0.22 6.10 **
X1 FOLLOW HOME CUSTOMER -0.02 0.09 -0.27 0.05 0.06 0.84 X2 GET A FOOTHOLD -0.03 0.10 -0.30 0.05 0.06 0.80 X3 CREATE A HUB 0.29 0.15 1.96 * 0.19 0.08 2.23 ** X4 PERCEIVED BUSINESS RISK -0.37 0.11 -3.48 ** -0.07 0.09 -0.79
X5 LOCK-IN 0.23 0.16 1.45 0.51 0.07 6.90 ** X6 EXPAND -0.40 0.33 -1.21 -0.64 0.24 -2.65 ** X7 MISTAKE -0.21 0.16 -1.34 -0.22 0.12 -1.87 * F (7,22); (7,21) 6.35 15.98 R square 67% 84% Adjusted R square 56% 79% N 30 29