2018
UNIVERSIDADE DE LISBOA FACULDADE DE CIÊNCIAS
Black seabream, Spondyliosoma cantharus: stock structure in the eastern Atlantic and characterisation of the biology and fishery in the Portuguese coast
“Documento Definitivo”
Doutoramento em Ciências do Mar
Ana Margarida Antunes Neves
Tese orientada por:
Prof. Doutor Leonel Serrano Gordo
2018
UNIVERSIDADE DE LISBOA FACULDADE DE CIÊNCIAS
Black seabream, Spondyliosoma cantharus: stock structure in the eastern Atlantic and characterisation of the biology and fishery in the Portuguese coast
Doutoramento em Ciências do Mar
Ana Margarida Antunes Neves
Tese orientada por: Prof. Doutor Leonel Serrano Gordo Júri:
Presidente:
● Doutora Maria Manuela Gomes Coelho de Noronha Trancoso, Professora Catedrática e Presidente do departamento de Biologia Animal da Faculdade de Ciências da Universidade de Lisboa
Vogais:
● Doutor Karim Erzini, Professor Associado com Agregação Centro de Ciências do Mar (CCMAR) da Universidade do Algarve ● Doutor Jorge Manuel dos Santos Gonçalves, Investigador Auxiliar Centro de Ciências do Mar (CCMAR) da Universidade do Algarve ● Doutora Maria José Rosado Costa, Professora Catedrática Aposentada Faculdade de Ciências da Universidade de Lisboa
● Doutor Leonel Paulo Sul de Serrano Gordo, Professor Auxiliar com Agregação Faculdade de Ciências da Universidade de Lisboa
● Doutor José Lino Vieira de Oliveira Costa, Professor Auxiliar Faculdade de Ciências da Universidade de Lisboa
● Doutora Sofia Gonçalves Seabra, Investigadora de Pós-doutoramento
Centro de Ecologia, Evolução e Alterações Ambientais da Faculdade de Ciências da Universidade de Lisboa
Documento especialmente elaborado para a obtenção do grau de doutor
Esta tese teve o financiamento da Fundação para a Ciência e Tecnologia através da bolsa SFRH/BD/92769/2013
i
Agradecimentos
A realização de uma tese é acima de tudo uma aprendizagem pessoal dos pequenos nadas (que são tudo) com que as pessoas que nos rodeiam nos agraciam diariamente. Ficarão por isso muitos nomes sem constar da lista de agradecimentos, e que, no entanto, contribuíram de forma decisiva para que este trabalho encontrasse um final feliz!
Gostaria de deixar o meu agradecimento público a algumas pessoas que contribuíram mais diretamente na sua realização.
Em primeiro lugar ao meu orientador, o Professor Leonel Serrano Gordo por todo o seu apoio intelectual e científico, logístico e acima de tudo, humano com que me tem presenteado há quase 20 anos.
Ao Professor Octávio Paulo por toda a disponibilidade, conhecimento e capacidade educativa que fez com que a genética não fosse tão complicada como parecia ser.
À Dra Ana Isabel Janeiro pela disponibilidade e entusiasmo com que me ajudou na análise de isótopos estáveis.
Às minhas colegas de laboratório: à Rafaela pela sua disponibilidade e atenção; à Ana Rita e à Vera pelo apoio em todas as tarefas, pela discussão de ideias que permitiu melhorar o trabalho e pelos bons momentos de conversa.
Ao Ricardo Lemos que, apesar da distância e do diferente fuso horário, sempre se prontificou a ajudar quando era solicitado.
À Sara Francisco e ao Frederico Almada pela ajuda e disponibilidade.
Ao Sr. José Paulino, responsável da lota de Peniche, e a todos os colaboradores da lota, pela maneira cordial com que sempre nos trataram e permitiram realizar as amostragens naquele local.
Ao mestre Zé Tó da embarcação “São Gonçalinho”, pela disponibilidade em nos ajudar a conseguir amostras de choupa.
E finalmente, a um número elevado de pessoas que, muitas delas, apenas com um pedido através de e-mail, se disponibilizaram a arranjar e enviar amostras de choupa para Lisboa de modo a ser possível a elaboração desta tese. Foram elas:
ii
Dr. M. Angeles Blanco (IEO, Espanha), Dr. Eric Durieux (CNRS, França), Dr. Jim Ellis (CEFAS, Reino Unido), Dr. Virgílio Estêvão (INIP, Angola), Dr. Angel Fernandez (IEO, Espanha),
Dr. Rui Freitas (FECM/UniCV, Cabo Verde), Dr José Antonio González (ULPGC, Espanha), Dr. Carme Alomar Mascaró (IEO, Espanha), Dr. Sanja Matic-Skoko (IZOR, Croácia), Dr. Kelle Moreau (ILVO, Bélgica), Dr Michele Salaun (Iremer, França),
Dr. Carmen van-Dúnem Santos (UAN, Angola), Dr Antonio Solla (IEO, Espanha).
iii
Abstract
In this thesis the stock structure of the black seabream, Spondyliosoma cantharus, along the Eastern Atlantic is explored using 4 different methodologies, body morphometry, otolith shape and stable isotopes ratio and genetics (mitochondrial and nuclear markers). Samples were gathered for five European areas (English Channel, Bay of Biscay, Galicia, west Portuguese coast – Peniche, and south Portuguese coast – Algarve), and two areas from African coast (Canary Islands and Angola).
Results from morphometric analyses support the existence of different phenotypic stocks in each sampled area, while stable isotope ratios show fuzzier results with only 3 areas clearly distinguished: Angola, Canary Islands and Bay of Biscay.
Genetic analyses were enhanced with samples from Mediterranean Sea and Cape Verde. A clear structuration is present between regions: North-east Atlantic, Mediterranean Sea, Cape Verde and Angola, not being detected any population structuring within each region; however high levels of private haplotypes for all populations were observed, which can indicate that not enough dispersal/gene flow exists to homogenize more recent mutations at the ecological timescale.
Integrating results from all methods, in a holistic stock structure analyses, the scenario with 6 different stock units in the North-eastern Atlantic is the most probable.
Life history parameters for the species were also evaluated for the west Portuguese coast, since these are key parameters for a conscientious stock assessment.
Maximum age of 17 years was assigned for a specimen with 38 cm. Age at growth was best described with the L hyperbolic modification of von Bertalanffy curve. Under this model, a change in growth occurs around 8 years, which corresponds roughly to the average age for sex reversal in the species.
The estimated exploitation rate was relatively high (0.43 – 0.62), indicating that although the species is not the main target of the fisheries, its management needs careful attention. Considering the reproductive strategy of the species, half of the females’ population was mature at 18.41 cm and changed sex at 25.62 cm. Sex change takes only a brief period of time, since transitional individuals were scarce and most of them showed oocytes regressing into cystic structures. The species presents a clear indeterminate fecundity type with massive atresia happening at the end of the spawning season. Mean values of 203
iv
oocytes and 5431 oocytes by gram of eviscerated female were estimated for relative batch fecundity and relative annual fecundity, respectively.
v
Resumo
As pescas são um sector com grande importância económica e social em Portugal e, embora cerca de 370 espécies de peixes sejam comercialmente exploradas a nível nacional, a informação biológica para efeitos de gestão está disponível apenas para um pequeno número, realçando a falta de informação existente para a maioria das espécies capturadas. Um elemento essencial para uma gestão sustentável das pescas é a identificação de mananciais, visto que é sobre esta unidade que os parâmetros da população são avaliados e que as medidas de gestão são aplicadas.
Esta tese tem como tema de estudo a choupa, Spondyliosoma cantharus, uma espécie hermafrodita protogínica, que matura primeiro como fêmea mudando posteriormente para macho. Esta espécie tem uma vasta distribuição ao longo do Atlântico Este e Mediterrâneo e, embora seja explorada comercialmente ao longo de toda a sua distribuição geográfica, não existe nenhum estudo sobre a estrutura dos seus mananciais. Neste contexto foi recolhida informação de várias áreas onde a espécie está presente, concretamente, de cinco áreas Europeias (Canal da Mancha, Golfo da Biscaia, Galiza, Peniche e Algarve) e duas da Costa Africana (Ilhas Canárias e Angola), para elucidar a estrutura dos mananciais da espécie ao longo do Atlântico Este.
Neste trabalho foram aplicadas quatro metodologias (morfometria do corpo, forma do otólito, análise dos ratios de isótopos estáveis (13C e 18O) e análise genética) aos indivíduos de cada área de forma a investigar a existência de mananciais separados. Todas as técnicas foram aplicadas aos mesmos indivíduos, embora nem todos tenham sido analisados com todas as técnicas.
Os resultados obtidos pela análise da morfometria do corpo e da forma do otólito suportam a existência de diferentes mananciais fenotípicos em cada área amostrada, enquanto na análise dos ratios de isótopos estáveis apenas três áreas foram claramente distintas das restantes (Angola, Ilhas Canárias e Golfo da Biscaia).
Na análise genética, foram usados dois marcadores, um mitocondrial, citocromo b, e um nuclear, primeiro intrão da proteína ribossomal S7, e foi efetuado um reforço de amostras do Mediterrâneo, da Bélgica e de Cabo Verde. Esta técnica permitiu verificar que a choupa apresenta uma clara estruturação, com quatro regiões bem definidas: Norte Atlântico, Mediterrâneo, Cabo Verde e Angola. Dentro de cada região, não foi detetada estruturação populacional; no entanto a ocorrência de um elevado número de haplótipos
vi
privados em cada população indica que não deverão existir níveis suficientes de dispersão/fluxo de genes para homogeneizar mutações ocorridas mais recentemente à escala ecológica.
Integrando os resultados obtidos pelas várias técnicas, o cenário mais provável parece ser a existência de 6 diferentes mananciais no Nordeste Atlântico.
Para uma gestão apropriada de cada manancial, é vital obter informação sobre os parâmetros de história de vida da espécie. A informação de idade e crescimento permite, por exemplo, calcular taxas de crescimento, mortalidade e recrutamento que serão posteriormente utilizadas em modelos de gestão de pescas. A fiabilidade da informação é por isso assaz importante.
De forma a permitir uma melhor perceção da deposição dos incrementos, a validação do primeiro incremento anual foi feita através do acompanhamento numa área de viveiro, a Lagoa de Óbidos, da coorte do primeiro ano. Foi possível desta forma estimar o comprimento médio total, 7,8 ± 0,9 cm e do raio do otólito, 1,65 ± 0,16 mm, no final do primeiro ano. A validação de idades foi também realizada através da comparação das estimativas de idades de dois leitores independentes. A idade máxima atribuída foi de 17 anos a um indivíduo com 38 cm de comprimento total.
Tendo em conta a estratégia de vida peculiar da espécie (protoginia), vários modelos foram comparados de forma a perceber qual o mais apropriado para descrever o seu crescimento. O que obteve o melhor ajuste aos dados foi a modificação hiperbólica do L da curva de von Bertalanffy, que incorpora uma alteração do crescimento perto dos 8 anos, que é aproximadamente a idade estimada para a transição de sexo.
Os valores estimados para a taxa de mortalidade natural e mortalidade por pesca, para a costa oeste Portuguesa, foram semelhantes para os dois anos analisados, verificando-se uma taxa de exploração relativamente elevada. De facto, embora a espécie não seja o alvo principal dos pescadores, é capturada com frequência por diversos tipos de artes.
A biologia reprodutiva é outro aspeto crucial para a caracterização da dinâmica populacional da espécie e consequentemente para a sua gestão. Em espécies hermafroditas a avaliação deste parâmetro é particularmente exigente uma vez que o mesmo indivíduo funciona como fêmea e macho em diferentes fases da vida.
De forma a compreender a dinâmica reprodutiva da espécie, foram analisados cortes histológicos da maior parte dos indivíduos tendo, todas as fêmeas durante a época de postura e todos os indivíduos que apresentassem características dúbias sobre os seu estado (em transição ou com estruturas císticas), sido analisados minuciosamente.
vii
Com esta análise detalhada, verificou-se que apenas uma pequena fração dos indivíduos analisados foram considerados em transição, indicando que a mudança de sexo nesta espécie será um processo rápido. O elevado número de estruturas císticas observado, principalmente em espécimes em transição e machos, indicia que estas estruturas devem de alguma forma estar relacionadas com o processo de transição de sexo.
A época de reprodução da espécie foi definida de fevereiro a maio para a costa ocidental Portuguesa. O comprimento à primeira maturação foi estimado em 18,41 cm, correspondendo a uma idade de 3,8 anos, e o comprimento ao qual metade das fêmeas muda para macho aos 25,62 cm, que corresponde a uma idade de 7,94 anos. O facto de terem sido observados machos com 20 cm e fêmeas com 35 cm, parece evidenciar que esta espécie pode apresentar machos primários e fêmeas que não mudam de sexo. No entanto, a amostragem obtida para os intervalos de comprimento que poderiam elucidar esta questão não foi suficiente para se obter uma conclusão substanciada. No que diz respeito à investigação da existência de machos primários, teria de se fazer um esforço de amostragem em indivíduos imaturos e em desenvolvimento, entre 15 e 20 cm, que não são apanhados pela pesca comercial, tornando assim especialmente difícil a clarificação deste tópico.
Um dos parâmetros usados para estudar o potencial reprodutivo de um manancial e essencial para compreender o processo de recrutamento em espécies exploradas comercialmente, é a determinação da fecundidade individual. Para ser possível calcular com rigor este parâmetro, é necessário primeiro determinar o tipo de fecundidade da espécie pelo que, neste contexto, foram seguidos 4 critérios apresentados por Hunter et al. (1992), Greer-Walker et al. (1994) e Murua e Saborido-Rey (2003). Embora estes critérios tenham de ser analisados com atenção, uma vez que para algumas espécies eles apresentem resultados contraditórios, continuam a ser a forma mais fiável de determinar o tipo de fecundidade da espécie. De salientar que, para a choupa, todos os critérios analisados apontaram para o mesmo resultado, ou seja, fecundidade claramente do tipo indeterminado.
Os valores de fecundidade estimados para a espécie foram, em média, de 203 ovócitos por grama de fêmea eviscerada para cada desova, tendo sido estimados 27 eventos de desova por fêmea ao longo da época de postura. Estes valores indicam que a espécie
viii
produz em média um número potencial de descendentes relativamente elevado, de 5431 ovócitos por grama de fêmea eviscerada.
Os dados apresentados neste estudo constituem uma base de trabalho sólida que permitirão, de futuro, uma pesquisa mais aprofundada da pressão piscatória a que a choupa está sujeita. No entanto, numa análise mais empírica, a espécie parece estar, por agora, a ser capturada ainda dentro de limites adequados de exploração.
ix
Table of Contents
Agradecimentos ...i Abstract ... iii Resumo ... v Table of Contents ... ixList of Tables ... xiii
List of Figures ... xv
CHAPTER 1 General Introduction ... 1
1.1 Fisheries and fish stock structure ... 2
1.2 Black seabream ... 4
1.2.1 Age and growth ... 5
1.2.2 Reproduction ... 5
1.2.3 Feeding Ecology... 6
1.2.4 Black seabream fisheries ... 7
1.3 Aims and importance of the thesis ... 9
1.4 Thesis outline ... 9
SECTION 1 Stock Structure ... 11
CHAPTER 2 Phenotypic changes in the body of black seabream, Spondyliosoma cantharus (Teleostei: Sparidae), along the eastern Atlantic ... 12
2.1 Introduction ... 14
2.2 Material and methods ... 15
2.2.1 Fish collection ... 15 2.2.2 Image Processing ... 16 2.2.3 Morphometric Analysis ... 17 2.2.4 Multivariate Analysis ... 18 2.3 Results ... 18 2.3.1 Morphometric Analysis ... 19 2.3.2 Multivariate Analysis ... 20 2.4 Discussion ... 22
x
CHAPTER 3 Otolith shape and isotopic ratio analyses as a tool to study Spondyliosoma cantharus
population structure ... 26
3.1 Introduction ... 28
3.2 Material and methods ... 29
3.2.1 Fish collection ... 29
3.2.2 Image and shape analysis ... 31
3.2.3 Stable isotope analysis ... 32
3.3 Results ... 33
3.3.1 Shape analysis ... 33
3.3.2 Stable isotope analysis ... 36
3.4 Discussion ... 39
CHAPTER 4 Highly regional population structure of Spondyliosoma cantharus across the Eastern Atlantic and the Mediterranean Sea using nuclear and mitochondrial DNA data ... 43
4.1 Introduction ... 45
4.2 Material and Methods ... 46
4.2.1 Sampling ... 46
4.2.2 DNA extraction, amplification, sequencing and alignment... 46
4.2.3 Haplotype networks ... 48 4.2.4 Population structure ... 48 4.2.5 Demographic analysis ... 49 4.3 Results ... 49 4.3.1 Haplotype networks ... 49 4.3.2 Population structure ... 53 4.3.3 Diversity analysis ... 55 4.3.4 Demographic analysis ... 55 4.4 Discussion ... 56
SECTION 2 Life History Parameters ... 63
CHAPTER 5 Modelling the growth of a protogynous sparid species, Spondyliosoma cantharus ... 64
5.1 Introdution ... 66
5.2 Material and Methods ... 67
xi
5.2.2 Length–weight relationship ... 68
5.2.3 First annual growth increment validation ... 68
5.2.4 Ageing methodology, precision and bias ... 69
5.2.5 Growth models ... 70
5.2.6 Mortality ... 70
5.3 Results ... 71
5.3.1 Length–weight relationship ... 71
5.3.2 First annual growth increment validation ... 71
5.3.3 Ageing methodology, precision and bias ... 72
5.3.4 Growth models ... 73
5.3.5 Mortality ... 74
5.4 Discussion ... 75
CHAPTER 6 Insight on reproductive strategy in Portuguese waters of a commercial protogynous species, the black seabream Spondyliosoma cantharus (Sparidae)... 80
6.1 Introduction ... 82
6.2 Material and Methods ... 83
6.2.1 Sampling ... 83
6.2.2 Ovary and test organisation ... 84
6.2.3 Sexual cycle ... 86
6.2.4 Length at first maturity and sex change ... 87
6.2.5 Oocyte size frequency ... 87
6.2.6 Fecundity type ... 88
6.2.7 Fecundity estimation ... 88
6.3 Results ... 89
6.3.1 Sampling ... 89
6.3.2 Ovary and test organisation ... 90
6.3.3 Sexual cycle ... 93
6.3.4 Length at first maturity and sex change ... 94
6.3.5 Oocyte size frequency ... 95
6.3.6 Fecundity type ... 97
xii
6.4 Discussion ... 100
CHAPTER 7 General Conclusion and Final Remarks ... 106
General Conclusion ... 107
Final Remarks ... 112
Supplementary Material... 113
xiii
List of Tables
Table 2.1 Sample characterisation by geographical area. ... 19
Table 2.2 Procrustes distances between mean body shapes of black seabream, Spondyliosoma cantharus, from the seven study areas. ... 19
Table 2.3 Jackknifed classification matrix of the discriminant analysis performed on black seabream, Spondyliosoma cantharus, specimens from the seven study areas. ... 22
Table 3.1 Summary table of black seabream, Spondyliosoma cantharus, collected along the eastern Atlantic Ocean. ... 33
Table 3.2 Jackknifed classification matrix of the discriminant analysis performed on black seabream, Spondyliosoma cantharus, otolith shape data from the seven study areas. ... 35
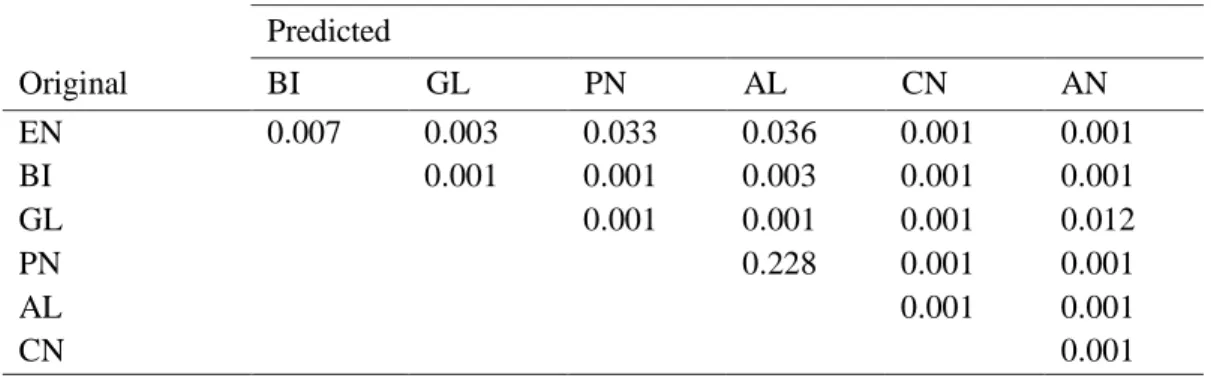
Table 3.3 PERMANOVA a posteriori pairwise tests performed on black seabream, Spondyliosoma cantharus, otolith stable isotopes, δ18O and δ13C, in relation to the seven study areas... 38
Table 3.4 Classification matrix for the k-sample nearest neighbor discriminant analysis (k = 7) performed on otolith isotopes ratio data of black seabream, Spondyliosoma cantharus, from the seven study areas. 39 Table 4.1 Diversity measures for the sample areas and population groups of Spondyliosoma cantharus for cytb and S7. ... 51
Table 4.2 Hierarchical analyses of molecular variance (AMOVA) considering three hierarchical levels in three different region structures for cytb sequences of Spondyliosoma cantharus. ... 53
Table 4.3 Hierarchical analyses of molecular variance (AMOVA) considering three hierarchical levels in three different region structures for S7 sequences of Spondyliosoma cantharus. ... 54
Table 4.4 Gene flow among collecting sites of Spondyliosoma cantharus represented by FST (below diagonal) and Nm (number of migrants; above diagonal). ... 55
Table 4.5 Demographic parameters of Spondyliosoma cantharus based on cytb and S7. ... 56
Table 5.1 Sampling strategy summary. ... 68
Table 5.2 Models fitted to length-at-age data for Spondyliosoma cantharus. ... 70
Table 5.3 Indices of precision for age readings of black seabream, Spondyliosoma cantharus within and between readers. ... 73
Table 5.4 Summary of von Bertalanffy growth parameters resulting from the four models fitted to black seabream, Spondyliosoma cantharus, data. ... 74
Table 6.1 Summary of oocyte growth stages defined for Spondyliosoma cantharus females caught in western Portuguese continental coast during 2014 and 2015. ... 85
Table 6.2 Summary of male cells stages defined for Spondyliosoma cantharus males caught in western Portuguese continental coast during 2014 and 2015. ... 86
Table 6.3 Summary table with the fit for the generalised linear model applied to maturity and sex change data. ... 95
Table 7.1 Pairwise comparison results for the techniques used in this study. Only significant differences are indicated. ... 108
Table 7.2 Separate stocks identified based on each individual technique and the defined management units. ... 109
xiv
Table S3.1 ANCOVA for 13C and 18O values in otoliths ... 114
Table S4.1 Gene flow among collecting sites of Spondyliosoma cantharus, within the North-eastern
Atlantic (NEAT) and Mediterranean Sea (MEDS) regions, represented by FST (below diagonal) and Nm (number of migrants; above diagonal)... 115
xv
List of Figures
Fig. 1.1 Spondyliosoma cantharus male, during spawning season. ... 4 Fig. 1.2 Geographical distribution area of Spondyliosoma cantharus ... 5 Fig. 1.3 Landings from 1950 to 2015 of the black seabream, Spondyliosoma cantharus, for the four regions
of its geographical distribution, Northeast Atlantic (blue), Central East Atlantic (red), Southeast Atlantic (purple) and Mediterranean Sea (green). ... 7
Fig. 1.4 Number of a) tonnes and b) boats, by fishing gear landings in the Continental Portuguese coast for
Spondyliosoma cantharus. Bottom trawl – white; purse seine – grey; multi gear – black. ... 8
Fig. 1.5 Average landings per month of Spondyliosoma cantharus in the North (black), Centre (grey) and
South (light grey) Continental Portuguese coast. ... 9
Fig. 2.1 Geographical location of sampling areas of black seabream, Spondyliosoma cantharus, along the
eastern Atlantic Ocean. (EN – English Chanel; BI – Golf of Biscay; GL – Galicia; PN – Peniche; AL – Algarve; CN – Canary Islands; AN – Angola). ... 16
Fig. 2.2 Landmarks used on black seabream, Spondyliosoma cantharus, geometric morphometrics
analysis. ... 17
Fig. 2.3 Mean shapes for the black seabream, Spondyliosoma cantharus, from different areas (EN – English
Channel, BI – Golf of Biscay, GL – Galicia, PN – Peniche, AL – Algarve, CN – Canary Islands, AN – Angola). ... 20
Fig. 2.4 Scatter plot of the scores of black seabream, Spondyliosoma cantharus, specimens from the seven
locations (EN – English Channel, BI – Golf of Biscay, GL – Galicia, PN – Peniche, AL – Algarve, CN – Canary Islands, AN – Angola) for the first two discriminant functions (DF). ... 21
Fig. 3.1 Geographical location of sampling areas of black seabream, Spondyliosoma cantharus, along the
eastern Atlantic Ocean. (EN – English Chanel; BI – Bay of Biscay; GL – Galicia; PN – Peniche; AL – Algarve; CN – Canary Islands; AN – Angola). ... 30
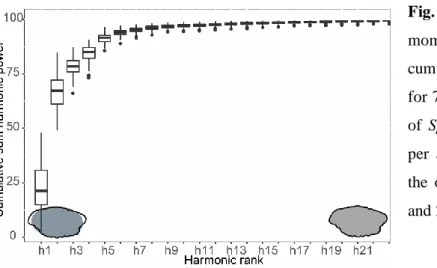
Fig. 3.2 Boxplot (according to momocs R package) of the cumulative variance of harmonics for 70
randomly selected otoliths of Spondyliosoma cantharus (10 per area). Grey profile indicates the otolith contour defined by 1 and 21 harmonics. ... 34
Fig. 3.3 Mean shapes for the black seabream, Spondyliosoma cantharus, from different areas (EN – English
Channel, BI – Bay of Biscay, GL – Galicia, PN – Peniche, AL – Algarve, CN – Canary Islands, AN – Angola). The figures represent the transformation from the overall mean shape (grey) to the mean shape for each location (black outline). ... 35
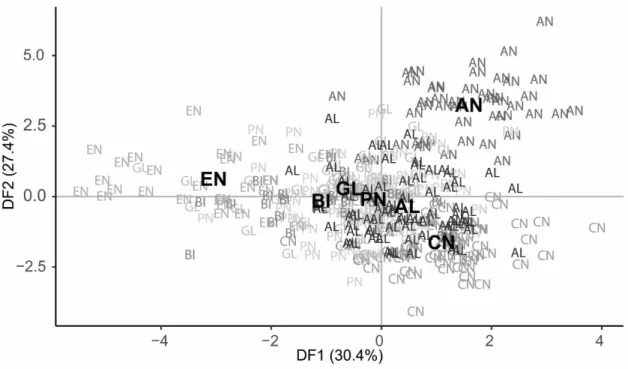
Fig. 3.4 Discriminant analysis function scores (DF) of black seabream, Spondyliosoma cantharus,
specimens from the seven locations (EN – English Channel, BI – Bay of Biscay, GL – Galicia, PN – Peniche, AL – Algarve, CN – Canary Islands, AN – Angola). Group centroids are marked in bold. ... 36
Fig. 3.5 Mean, standard deviation with minimum and maximum values of (a) δ18O and (b) δ13C of the whole
otolith of black seabream, Spondyliosoma cantharus, specimens for each area (EN – English Channel, BI – Bay of Biscay, GL – Galicia, PN – Peniche, AL – Algarve, CN – Canary Islands, AN – Angola). Biplots of δ18O and δ13C values against otolith mass (c, d), estimates of sea surface temperatures – SST (e, f) and
xvi
Fig. 3.6 Isotopic results for the whole otolith of black seabream, Spondyliosoma cantharus, specimens from
the seven locations (EN – English Channel, BI – Bay of Biscay, GL – Galicia, PN – Peniche, AL – Algarve, CN – Canary Islands, AN – Angola). Mean area values are given in bold and ellipses represent the 95% confidence intervals. ... 38
Fig. 4.1 Sampling locations of Spondyliosoma cantharus in the Eastern Atlantic Ocean and the
Mediterranean Sea. The position of samples with black dots is indicative. ... 47
Fig. 4.2 Parsimony network for Spondyliosoma cantharus calculated with mtDNA cytochrome b sequences
(663 bp). The area of the circles is proportional to each haplotype frequency. Colours refer to the region in which haplotypes were found. Acronyms for populations are given in sampling section. ... 50
Fig. 4.3 Parsimony network for Spondyliosoma cantharus calculated with nDNA first intron S7 sequences
(483 bp). The area of the circles is proportional to each haplotype frequency. Colours refer to the region in which haplotypes were found. Acronyms for populations are given in sampling section. ... 52
Fig. 4.4 Mismatch distributions for the mtDNA cytb and nDNA S7 of Spondyliosoma cantharus in the four
regions identified. NEAT: North East Atlantic; MEDS: Mediterranean Sea; WAFT: West African Transition; GLGN: Gulf of Guinea. Bars represent data observed, grey dots represent simulated spatial expansion and black squares represent simulated demographic expansion. ... 57
Fig. 5.1 Map of sampling sites location on the Portuguese coast. Black circle indicates Peniche and black
square indicates Óbidos Lagoon. ... 67
Fig. 5.2 (a) Bhattacharya plot for length-frequency data of black seabream, Spondyliosoma cantharus,
obtained from Óbidos lagoon and (b) relationship between total length (TL) and otolith radius (OR) from black seabream, S. cantharus, sampled in Óbidos Lagoon. Solid line is the linear regression, dashed lines correspond to values of TL and OR for the 1st year of life. ... 72
Fig. 5.3 Monthly evolution of marginal increment ratio (MIR) in otoliths of black seabream, Spondyliosoma
cantharus, from the Portuguese continental waters. Dots are the mean values and whiskers are ± standard
error. ... 72
Fig. 5.4 Age bias plots for the readings comparisons within (a) and between (b) readers for black seabream,
Spondyliosoma cantharus. The 45º line represents 100% agreement and dot size represents number of
observations. ... 73
Fig. 5.5 Frequency distribution of the observed TL and age and fit of the four growth models to the black
seabream, Spondyliosoma cantharus, data. Grey / J are juveniles, red / F are females, blue / M are males and green / T are transitional individuals. Orange line is the typical von Bertalanffy curve; green solid line is L∞ hyperbolic biphasic model; black dashed line is K hyperbolic biphasic model and light blue solide
line is the five parameter von Bertalanffy model. ... 75
Fig. 6.1 Map of sampling sites location on the Portuguese coast. Black circle indicates Peniche and black
square indicates Óbidos Lagoon. ... 84
Fig. 6.2 Number of immature (white), females (light grey), transitional (black) and males (dark grey) by
total length (TL) class used in the present study. Classes of 5 cm interval were used for specimens bellow 20 cm and above 30 cm and classes of 1 cm interval were used for the lengths in between. ... 90
Fig. 6.3 Transverse sections of gonads of Spondyliosoma cantharus. a) juvenile specimen with both female
xvii
female (23.4 cm TL); d) transitional specimen (23.4 cm TL); e) developing male with inactive female tissue (20.9 cm TL); f) spawning-capable male (26.4 cm TL); g) regressing female at the beginning of mass atresia (23.7cm TL); h) transitional specimen (29.4 cm TL); i) early developing male (30.5 cm TL); j) regressing female (31.9 cm TL). α-At – α atresia; At – atresia; AVtg – advanced vitelogenic oocyte; CA – cortical alveoli oocyte; CS – cystic structure; EVtg – early vitelogenic oocyte; OC – ovarian cavity; OM – mature oocyte; PG – primary growth oocytes; POF – post-ovulatory follicle; Sc1– primary spermatocyte; Sc2 – secondary spermatocyte; Sg – spermatogonia; St – spermatid; Sz – spermatozoid; TT– testicular tissue; arrow – advance vitelogenic oocyte going to germinal vesicular migration. ... 91
Fig. 6.4 Percentage of individuals of Spondyliosoma cantharus with cystic structures over the sampled
months. Relative percentage for each sex is given in bars. Females – light grey; Transitional – black; Male – grey. Total number of individuals sampled by month is given between brackets above bars. ... 92
Fig. 6.5 Maturity stage frequency by month for females and males of Spondyliosoma cantharus caught in
western Portuguese coast. D – developing; SC – spawning capable; AS – actively spawning; RS – regressing; RN – regenerating. ... 93
Fig. 6.6 Monthly variation for females and males of the mean and standard error of gonadosomatic index
(GSI, black squares), hepatosomatic index (HSI, grey circles), and Fulton’s condition factor (K, open diamonds) for Spondyliosoma cantharus caught in western Portuguese coast. ... 94
Fig. 6.7 Maturity (black circles and solid line) and sex change (asterisks and dashed line) ogives for
Spondyliosama cantharus caught in western Portuguese coast. Vertical lines indicate the length at which
50% of the individuals are mature (solid) and change sex (dashed). 95% confidence interval for the model is given by the grey area. ... 95
Fig. 6.8 Oocyte size frequency distribution for the developing (D), spawning capable (SC), actively
spawning (AS) and regressing (RS) females of Spondyliosoma cantharus caught in western portuguese coast from October 2014 to June 2015. The most advance oocyte cohort in AS phase is highlighted by a circle. ... 96
Fig. 6.9 Oocyte size frequency variation over the spawning season for Spondyliosoma cantharus spawning
capable females caught in western Portuguese coast. Vertical lines indicate the transition from pre-vitellogenic to pre-vitellogenic oocytes. ... 98
Fig. 6.10 Linear relation between absolute batch fecundity (open squares, solid line) and number of
advanced vitellogenic oocytes (crossed squares, dashed line) with total length (TL) and eviscerated weight (EW) for Spondyliosoma cantharus females caught in western Portuguese coast. 95% confidence interval for the model is given by the grey area... 99
CHAPTER 1
Chapter 1
2
General Introduction
1.1 Fisheries and fish stock structure
Fisheries have been, for a long time, a major source of food for mankind, with high increase of landings until the 80s of last century. By the late 1980s it became clear that fisheries resources could not be sustainable under uncontrolled exploitation and development, and global marine catches have showed a stabilizing trend since then (FAO, 2016). Global fisheries production in 2014 was 93.4 million tonnes, of which 81.5 million tonnes from marine waters, with over 10% of this value caught in the Northeast Atlantic (FAO, 2016). Based on FAO’s analysis of assessed stocks there has been a clear diminishing of underfished stocks and the increase of the number of stocks fished at unsustainable levels (overfished).
Portugal has been the third or fourth highest per capita consumer of fish in the world, depending on the years, with a fishing sector traditionally, socially and culturally important (Failler, 2007). The fishing fleet in Portugal consists of three main fleet components: trawl fisheries, purse-seine fisheries and multi-gear fisheries, with a production of 190,594 tonnes in 2016 (INE, 2017). Although approximately 370 fish species are commercially explored in Portuguese waters (Leitão et al., 2014), biological information for management purposes is available for a small number, stressing the lack of information for most of the captured species and the urgency of studies that gather such information.
An essential part of sustainable management of fisheries is the identification of biological fish stocks, as it is the unit at which population assessments are undertaken and management measures are applied (Begg et al., 1999; Abaunza et al., 2008). Determining whether post-juvenile populations of fish remain discrete and independent or whether there is mixing of these fish among different populations is critical to assessing the sustainability of fisheries (Welch et al., 2015).
Despite this knowledge, around 65% of global marine fisheries landings come from unassessed stocks (Ricard et al., 2012; Hilborn and Ovando, 2014), since population structure studies require comprehensive and interdisciplinary analyses, which normally imply the concerted effort of scientists with various research expertises (Fabrizio, 2005;
3 Cadrin et al., 2010). Such studies use techniques mainly based on phenotypic or genetic variation.
Phenotypic variation between stocks can indicate prolonged separation of postlarval fish in different environmental regimes providing an indirect basis for stock structure (Begg et al., 1999a). Several approaches have been used to inquiry phenotypic differences between populations: i) differences in vital population parameters as manifestation of life history modes to which fish stocks have evolved (e.g. Begg et al., 1999b; Sequeira et al., 2012; Barrios et al., 2017); ii) morphology, accounting for meristics (e.g. Turan et al., 2006; Erguden et al., 2009; Mir et al., 2013) and morphometric landmarks (e.g. Rodriguez-Mendoza et al., 2011; Ibáñez et al., 2017; Geladakis et al., 2018) and morphometric outline (e.g. Vieira et al., 2014; Mahe et al., 2016; Duncan et al., 2018); iii) otolith microchemistry (e.g. Heidemann et al., 2012; Higgins et al., 2013; Moreira et al., 2018); iv) parasites as biological tags (e.g. Sequeira et al., 2010; Klapper et al., 2016; Irigoitia et al., 2017); and v) fatty acid profiles (e.g. Lança et al., 2014; Shen et al., 2018).
The development of electrophoretic methods to study allozyme frequencies, in the last few decades of the 1900s, shifted the emphasis of stock identification from phenotypic to genotypic methods (Cadrin and Secor, 2009). Since then, several molecular genetic markers have been developed and used to infer on fish stock structure. Some of the most commonly used include: i) mitochondrial DNA (e.g. Damasceno et al., 2015; Vieira et al., 2016; Machado et al., 2017); ii) microsatellites (e.g. Charrier et al., 2007; Beacham et al., 2008; Gilbey et al., 2018); and iii) single nucleotide polymorphisms (e.g. Laconcha et al., 2015; Maroso et al., 2016; Westgaard et al., 2017).
However, both environmental and genetic components affect the stock composition and no single technique is able to discriminate between all fish stocks (Begg et al., 1999a). Multiple approaches to stock identification, both genetic and phenotypic, should be applied, ideally on the same samples, and the results compared to achieve an interdisciplinary perspective and increase the probability of correctly identify the stocks (Cadrin and Secor, 2009).
Chapter 1
4
1.2 Black seabream
Fig. 1.1 Spondyliosoma cantharus male, during spawning season.
The black seabream, Spondyliosoma cantharus (Fig. 1.1), is a protogynous Sparidae fish, developing first as female and changing to male afterwards. It has a wide geographical range (Fig. 1.2), occurring in all Mediterranean and in the Eastern Atlantic from Scandinavia to Angola (Bauchot and Hureau, 1986). It is a gregarious species that is found over seagrass beds and rocky or sandy bottoms in inshore waters, at depths of < 50 m for younger individuals to depths of up to 300 m for adults (Bauchot and Hureau, 1986). Black seabream is highly valued for its sporting and eating qualities, being exploited by both recreational and commercial fishers (Pinder et al., 2016). It is caught by several gear types and it is consumed fresh, frozen or dried-salted; being also reduced to fishmeal and oil (Carpenter, 2016).
5
Fig. 1.2 Geographical distribution area of Spondyliosoma cantharus
1.2.1 Age and growth
Maximum total length (TL) given for the species is 60 cm (Bauchot and Hureau, 1986) although most published works only sampled fishes below 40 cm (Bradai et al., 1998; Pajuelo and Lourenzo, 1999;Gonçalves and Erzini, 2000; Abecasis et al., 2008; Mouine et al., 2011; Boughamou et al., 2015). Ages estimations varied highly among the published studies, from 7 years for a fish with 40 cm TL for Algerian eastern coasts (Boughamou et al., 2015) to 20 years for fishes with 46 cm TL in Bay of Biscay (Soletchnik, 1982). In Portuguese coast the maximum observed age was 13 years, for a 40 cm TL individual (Abecasis et al., 2008). Although it is known that growth pattern differs by area due to biological and ecological factors, such discrepancies most likely also reflect differences in the methodological age readings of the otoliths.
1.2.2 Reproduction
As already mentioned, the black seabream is a protogynous hermaphrodite which has spawning aggregations (Pinder et al., 2017). It has external insemination and eggs are laid
Chapter 1
6 in nests constructed and guarded by the males on exposed gravel or sand, with each nest containing several thousands of eggs (Russell et al., 2014; Pinder et al., 2017). During the spawning season a sexual dimorphism occurs, with males showing a darker colouration and blue marks between their eyes.
Reproductive season is mainly between February and May, with a wider extension in Canary Islands, from November to April (Pajuelo and Lourenzo, 1999) and a smaller period, from May to June, in the colder waters of Bay of Biscay (Perodou and Nedelec, 1980).
Females reach maturity around 17.5 cm TL, in warmer waters (Pajuelo and Lourenzo, 1999; Mouine et al., 2011), while 22 cm TL were estimated for Bay of Biscay (Soletchnik, 1982). Sex change is referred by most of the authors to occur mostly between 20 – 30 cm TL, however Perodou and Nedelec (1980) and Soletchnik (1982) refer most individuals changing sex above 30 cm TL. Unfortunately, there is no recent biological parameters assessment to explore the possibility of a reduction of the length at sex change due to fishing pressure.
In Portuguese waters data is only available for Algarve, where the species reproduces from February to April and females attain sexual maturity at 19.98 cm TL with sexual inversion occurring at 24.5 cm TL (Gonçalves and Erzini, 2000).
Although relevant information has been gathered in several areas for the species, almost none of the studies used histological techniques to assure maturation stages and investigate transitional individuals. The use of such technique is most important for reproduction studies and even more in the presence of a hermaphroditic species (Sadovy and Shapiro, 1987; Alonso-Fernández et al., 2011).
1.2.3 Feeding Ecology
The black seabream is an opportunistic feeder with an omnivorous behaviour, adapting its diet to the availability of prey in the environment. In the Southern Portuguese coast, the species inhabiting rocky and patchy bottoms fed mainly on polychaetes and amphipods (Gonçalves and Erzini, 1998) while individuals caught in a shallow water reservoir in the Ria Formosa preyed mainly on highly mobile epifauna such as mysids, cumaceans, ostracods and tanaids (Pita et al., 2002). Polychaetes and amphipods were also
7 the main preys of specimens from Adriatic Sea (Dulčić et al., 2006), with smaller individuals feeding abundantly of ophiuroids.
In Balearic Islands, Box et al. (2009) found 550 invertebrate preys in black seabream stomachs with caridea representing over half of the prey consumed. The authors also evaluated the occurrence in the diet of the invasive Chlorophyte Caulerpa racemose, which has been colonising large areas from 0 to 70 m in depth in the Mediterranean, and found its presence in more than 75% of the stomachs at invaded areas while no presence was detected in control areas. Caulerpa species have shown some levels of toxicity (Vidal et al., 1984), and the accumulation of caulerpin on the tissues of black seabream may cause impacts in areas where the species is target for human consumption (Felline et al., 2017).
1.2.4 Black seabream fisheries
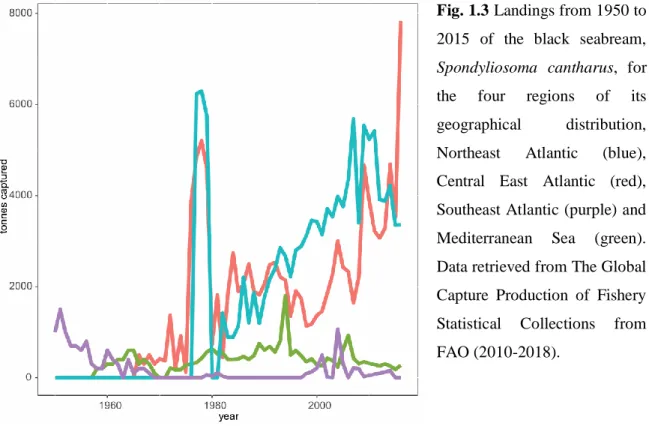
The black seabream is commercially caught along the Eastern Atlantic Ocean and in the Mediterranean Sea. Data retrieved from The Global Capture Production of Fishery Statistical Collections from FAO (2010-2018) indicates that, almost 10,000 t per year were landed in the last decade, with a major input from the north and central Eastern Atlantic, with an increasing trend since 1980 (Fig. 1.3).
Fig. 1.3 Landings from 1950 to 2015 of the black seabream, Spondyliosoma cantharus, for the four regions of its geographical distribution, Northeast Atlantic (blue), Central East Atlantic (red), Southeast Atlantic (purple) and Mediterranean Sea (green). Data retrieved from The Global Capture Production of Fishery Statistical Collections from FAO (2010-2018).
Chapter 1
8 Landings are mainly due to France, with 43%, followed by Senegal with 25%, for the last 35 years.
Portugal has the 6th higher landing values with an average of 170 t in the past two decades. The species is not the main target of fisheries fleets being caught by small-scale fleets which operate in short distances from fishing grounds, usually one day or less. The data provided by the Portuguese authorities (DGRM) shows that landings come from bottom trawl, purse seine and multi-gear fisheries, with the larger values originated by the latter (Fig. 1.4). The black seabream is captured by many multi-gear boats but in small quantities each, whereas trawlers and purse seiners show similar catches of the species.
Fig. 1.4 Number of a) tonnes and b) boats, by fishing gear landings in the Continental Portuguese
coast for Spondyliosoma cantharus. Bottom trawl – white; purse seine – grey; multi gear – black.
The species is landed in all continental Portuguese regions, but with higher values in the centre and south, being Peniche, Quarteira and Setúbal the most representative ports. Landing values show no trend for the last 25 years, with similar values and short oscillations. A larger decrease occurred in the end of the 1990’ but returned to the previous values in the beginning of the century (Fig. 1.5). Yearly variability in abundance of captured populations is normal to happen and is influenced by environmental factors such as sea temperature, upwelling and wind regime (e.g. Lloret et al., 2001; Levi et al., 2003; Leitão et al., 2016; Teixeira et al., 2016).
9 Fig. 1.5 Average landings per month of Spondyliosoma cantharus in the North (black), Centre (grey) and South (light grey) Continental Portuguese coast.
1.3 Aims and importance of the thesis
In the present study, data on the black seabream was gathered from several locations to evaluate the stock structure of the species. Stock identification is a central theme in fisheries and should include different methods related to diverse aspects of the stock concept (Coyle, 1998; Cadrin et al., 2014a). Several methodologies were applied to the same individuals, including genetic markers, otolith shape and isotopic ratios and morphometric characters.
Life history parameters information is fundamental to understand and respond to risks in natural populations and ecosystems. Estimations on age and growth, mortality, sex ratio, reproductive season, length at first maturity, length at sex change, fecundity type and annual fecundity were assessed for the Portuguese western coast.
The information gathered with this study intends to improve the data available for commercial fish species and increase the knowledge on species with specific reproduction strategies such as the protogynous hermaphroditism.
1.4 Thesis outline
This thesis is formed by scientific papers published or in revision in peer reviewed international journals, except for the “General Introduction” and “General Conclusion and Final Remarks”. It comprises seven chapters, the first and the last are the General Introduction and General Conclusion and Final Remarks, respectively. Chapters 2, 3 and 4 (section 1) are dedicated to the stock structure of the black seabream along the Eastern
Chapter 1
10 Atlantic; and the chapters 5 and 6 (section 2) address the life history of the species in the Portuguese western coast.
Three papers are present in the section 1. In the first one, differences on the body morphometry along the Eastern Atlantic are explored. The second paper presents the results of otolith shape and stable isotopic ratios analyses regarding the same regions of the first one. Genetic population analysis is discussed in the third paper, with additional data for the Mediterranean Sea and Cape Verde.
The second section is composed by two chapters. In the first information on age, growth and mortality for the western Portuguese coast are compared to previous published data and in the second chapter several aspects of reproduction of the species like the sex-ratio, the reproductive cycle, the length at first maturity and at sex change, the fecundity type and the fecundity estimation, are discussed.
In the last chapter, results for the several techniques are linked and possible conclusions are discussed and the state of the species in the Portuguese waters is also addressed. In final remarks, perspectives on future work on the species are discussed focusing the aspects for which additional information is required.
SECTION 1
CHAPTER 2
Phenotypic changes in the body of black
seabream, Spondyliosoma cantharus (Teleostei:
Sparidae), along the eastern Atlantic
Ana Neves, Ana Rita Vieira, Vera Sequeira, Rafaela Barros Paiva, Leonel Serrano Gordo. 2018. Estuarine, Coastal and Shelf Science, 214: 31–37. DOI: 10.1016/j.ecss.2018.09.009
13
Phenotypic changes in the body of black
seabream, Spondyliosoma cantharus (Teleostei:
Sparidae), along the eastern Atlantic
ABSTRACT
Knowledge on population spatial structure is essential in fisheries management. The study of morphological variation patterns in fishes can indicate differences in growth and maturation rates, and thus provide information on group dynamics that should be modelled and managed separately. Identification of intraspecific groups which have different life history features is crucial for understanding population dynamics and achieve a sustainable harvest. The black seabream, Spondyliosoma cantharus, has a vast distribution along the eastern Atlantic Ocean and is an important commercial fish, exploited in European waters by recreational and commercial fishers. In this paper, body geometric morphometrics was used in order to discriminate among black seabream geographical populations caught in seven different geographical areas. The results showed the existence of intraspecific groups of black seabream across the eastern Atlantic Ocean, with Canary and Angola having clear distinct morphotypes and at least four populations in the European Coast (English Channel, Galicia, Peniche and Algarve) that present stable body shape differences. These populations should be addressed separately and studies on life history parameters should be enhanced and updated.
Keywords: body shape, eastern Atlantic, geometric morphometrics, hermaphrodite, spatial analysis,
Chapter 2
14
2.1 Introduction
The black seabream, Spondyliosoma cantharus, is a protogynous Sparidae with a vast distribution along the eastern Atlantic, occurring from Scandinavia to Namibia, around the Madeira, Azores, Cape Verde and the Canary Islands. It is also common in the Mediterranean Sea and the western Black Sea (Bauchot and Hureau, 1986) and is an important commercial fish, exploited in European waters by recreational and commercial fishers (Russell et al., 2014). According to FAO (2010-2017), black seabream landings in Europe have been showing an increasing pattern with an average of nearly 5000 tonnes per year in the past decade. Over 90% of the landings come from France, Spain, United Kingdom and Portugal. Also, in Africa, this species has seen an increase in landings with over 3500 tonnes per year since 2010 (FAO, 2010-2017).
Despite its commercial importance, there is no information on its population structure along the eastern Atlantic. However, the knowledge on population spatial structure is essential in fisheries management and the absence of such data may lead to incorrect assumptions and unexpected risks of overexploitation (Ying et al., 2011).
The morphometric analysis offers a unique perspective for scientists involved in studying marine population structure since it helps to identify intraspecific groups of animals that can be effectively monitored and conserved (Cadrin, 2010). Morphological variation is phenotypic (i.e., influenced both by genetic composition and environmental factors) and the study of morphological variation patterns in fishes can signal possible differences in growth and maturation rates since body form is a product of ontogeny, and groups with different growth or reproductive dynamics should be modelled and managed separately. In this way, geographic patterns in morphology provide a unique perspective on spatial population structure (Cadrin, 2014).
Geometric morphometrics is the statistical analysis of shape variation and its covariation with other variables (Bookstein, 1991). The general geometric morphometrics uses landmark coordinates to extract the shape information and afterwards, patterns of shape changes can be quantified and compared through a standard statistical approach (Adams et al., 2013). One of the key advantages of geometric morphometrics is that shape differences can be visualised directly as graphical representations generated to facilitate biological interpretation (Klingenberg, 2013).
15 In this paper, geometric morphometrics was used to discriminate among black seabream geographical populations by studying the body morphological characteristics of black seabream caught in seven areas along its eastern Atlantic geographical distribution and thus clarify the population structure by test the hypothesis of the existence of seven different phenotypic populations.
2.2 Material and methods
2.2.1 Fish collection
For this study fishes from seven areas along the eastern Atlantic were collected: English Channel (EN), Bay of Biscay (BI), Galicia, north Spain (GL), Peniche, west coast of Portugal (PN), Algarve, south coast of Portugal (AL), Canary Islands (CN) and Angola (AN) (Fig. 2.1). Specimens from all areas with exception of PN and AL were frozen and sent to the authors in Lisbon by plane through an international shipping service. Portuguese specimens were acquired in the fishing ports and brought to the laboratory where they were frozen.
For all specimens, total length (TL, ±1 mm) and sex were recorded. Average TL was calculated for each area, significant differences were evaluated through the Kruskal-Wallis test and posterior multiple comparisons were evaluated with post-hoc tests according to Dunn. These tests were accomplished with the package PMCMR (Pohlert, 2014) for R (R Core Team, 2015).
Chapter 2
16
Fig. 2.1 Geographical location of sampling areas of black seabream, Spondyliosoma cantharus,
along the eastern Atlantic Ocean. (EN – English Chanel; BI – Golf of Biscay; GL – Galicia; PN – Peniche; AL – Algarve; CN – Canary Islands; AN – Angola).
2.2.2 Image Processing
A digital image of each fish was taken using a digital camera (Canon EOS 350D) with a fixed focus 50 mm lens to avoid image distortion. A total of 19 landmarks were selected (Fig. 2.2), 12 of which were marked with entomological pins to aid the accurate location of the points. Each landmark was then recorded for each fish using the software tpsDig version 2.17 (Rohlf, 2013).
17
Fig. 2.2 Landmarks used
on black seabream, Spondyliosoma cantharus, geometric morphometrics analysis. 1 – snout tip; 2 and 3 – anterior and posterior insertion of the dorsal fin; 4 and 6 – superior and inferior insertion of the caudal fin; 5 – end of lateral line; 7 and 8 – posterior and anterior insertion of the anal fin; 9 – insertion of the pelvic fin; 10 – posterior extremity of premaxillar; 11 – point of maximum extension of operculum on the lateral profile; 12 and 13 – superior and inferior insertion of the pectoral fin; 14 and 15 – superior and inferior margin of the eye; 16 – insertion point between vertical axis of eye and superior lateral profile; 17 and 18 – points of maximum curvature of the caudal peduncle; 19 – last spiny ray of the dorsal fin.
2.2.3 Morphometric Analysis
To extract the shape information from the landmarks positions, the unnecessary variation of size, position and orientation was removed using a generalised Procrustes superimposition procedure. The coordinates of landmarks aligned by this procedure should exclusively contain shape variation (Klingenberg, 2010). However, the shape data may still contain a component of size-related shape variation due to the effects of allometry. A multivariate regression using the Procrustes coordinates on centroid size was performed and its significance was evaluated. This procedure divides the variation in the dependent variables into predicted and residual components and since residuals are uncorrelated with the size measure they are the optimal choice to use as size free data (Klingenberg, 2016). These new size free variables were used in the subsequent analyses.
Considering that the black seabream is a hermaphrodite species, being the primary individuals’ females and the secondary individuals’ males, a preliminary analysis was conducted to verify if the sexual dimorphism within area could be attributed only to allometric effects. Differences between the mean body shapes from a subsample of individuals of both sexes within the same TL range (22cm to 26cm) were evaluated with
Chapter 2
18 Procrustes distances and a permutation test using 10,000 runs to test the null hypothesis of no difference between primary and secondary individuals was performed.
Mean shape differences of black seabream between the seven areas were explored with pairwise comparisons based on Procrustes distances, and the null hypothesis of no difference between areas was tested using a Bonferroni correction for multiple tests for an error rate of 0.05. To promote the interpretation of shape changes of the mean shape variation by area, warped outline drawings were done using the thin-plate spline interpolation function (Bookstein, 1989). These morphometric analyses and visualisations were done in the MorphoJ software package (Klingenberg, 2011).
2.2.4 Multivariate Analysis
Classification of specimens to a particular area was based on Principal Components Analysis (PCA) and Discriminant Analysis (DA). PCA allows reducing the dimensionality of the data since it summarises the major patterns of variation along a few axes that account for as much of the variation in the original data set as possible (Bro and Smilde, 2014). PCA was conducted using the correlation matrix.
Discriminant analysis (DA) was carried out on the PC scores to assess the quality of discrimination among areas. Jackknife cross-validation was used to calculate an unbiased estimation of classification success and the proportion of correctly allocated specimens. The discriminatory effectiveness of the analysis was accessed using the Wilks’ lambda (λ) and the Cohen’s Kappa statistic (к), which estimates the correct classification rate adjusted by chance (Titus et al., 1984).
Multivariate analyses were executed with packages MASS (Venables and Ripley, 2002), irr (Gamer et al., 2015) and rrcov (Todorov, 2016) for R (R Core Team, 2015).
2.3 Results
A total of 383 specimens, ranging from 18.1 cm to 38.7 cm were used for the morphometric study. The characterisation of samples from each area is summarised in Table 2.1. Mean TL was similar among areas, however significant differences (p < 0.0001) were found between several areas (reported in Table 2.1), and a small (3.2%) but significant (p = 0.0004) amount of shape variation was related to size.
19
Table 2.1 Sample characterisation by geographical area.
Area N TL (cm)
F M mean ± sd max - min
English Channel (EN) 16 9 24.6 ± 3.9 18.5 – 34.1 Bay of Biscay (BI) 20 7 26.3 ± 4.9 CN 18.1 – 38.7
Galicia (GL) 38 16 26.5 ± 2.8 AL, CN, PN 22.2 – 34.7
Peniche (PN) 54 50 25.3 ± 3.4 CN, GL 20.3 – 33.8
Algarve (AL) 15 58 23.9 ± 1.8 AN, GL 19.5 – 26.9
Canary Island (CN) 25 31 23.5 ± 1.8 AN, BI, PN, GL 20.2 – 28.6
Angola (AN) 13 31 25.6 ± 2.5 AL, CN 20.5 – 31.1
Labels are given in brackets next to the area. N – number of individuals sampled (F – female, M – male). Pair comparisons with statistical significant differences in total length composition are given as superscript next to mean and standard deviation (mean ± sd) values.
2.3.1 Morphometric Analysis
No significant differences were detected between the mean body shape for primary and secondary individuals (p value for Procrustes distances > 0.1), and subsequent analyses were performed in the whole sample. The mean body shape of black seabream presented significant differences among the seven areas analysed (Table 2.2).
Table 2.2 Procrustes distances between mean body shapes of black seabream, Spondyliosoma
cantharus, from the seven study areas.
Area EN BI GL PN AL CN BI 0.0179 (< 0.0001) GL 0.0121 (0.0164) 0.0170 (0.0002) PN 0.0129 (< 0.0001) 0.0172 (< 0.0001) 0.0143 (< 0.0001) AL 0.0177 (< 0.0001) 0.0137 (< 0.0001) 0.0207 (< 0.0001) 0.0135 (< 0.0001) CN 0.0256 (< 0.0001) 0.0268 (< 0.0001) 0.0268 (< 0.0001) 0.0227 (<0.0001) 0.0262 (< 0.0001) AN 0.0366 (< 0.0001) 0.0300 (< 0.0001) 0.0381 (< 0.0001) 0.0337 (< 0.0001) 0.0248 (< 0.0001) 0.0470 (< 0.0001) Areas labels as in Table 1. p-values obtained from permutation tests (10,000 permutation runs) are given between brackets.
Chapter 2
20 The mean body shape of black seabream presented significant differences among the seven areas analysed (Table 2.2). Marked differences from the mean shape were observed for Canary and Angola specimens. The former had a clearly slender body and the later had a forehead strongly arched. The European areas showed smaller differences among them, nevertheless, displacements in the insertion of the dorsal and pelvic fin, snout tip and last spiny ray of the dorsal fin were evident (Fig. 2.3).
Fig. 2.3 Mean shapes for the black seabream, Spondyliosoma cantharus, from different areas (EN
– English Channel, BI – Golf of Biscay, GL – Galicia, PN – Peniche, AL – Algarve, CN – Canary Islands, AN – Angola). The figures represent the transformation from the overall mean shape (light grey outline) to the mean shape for each location (black outline). Shape changes from European areas have been exaggerated threefold for better visualisation, while shape changes from Canary Island and Angola areas are onefold exaggerated.
2.3.2 Multivariate Analysis
The first two discriminant functions (DF) explained nearly 75% of the total among-area variance (Fig. 2.4) (Wilks’ λ = 0.004, p < 0.001; Cohen’s к = 0.728, p < 0.001). The first DF is related to the height of the body while the second relates to the elongation of the posterior region and displacements in the insertion of the dorsal and
21
Fig. 2.4 Scatter plot of the scores of black seabream, Spondyliosoma cantharus, specimens from
the seven locations (EN – English Channel, BI – Golf of Biscay, GL – Galicia, PN – Peniche, AL – Algarve, CN – Canary Islands, AN – Angola) for the first two discriminant functions (DF). Group centroids are marked with bold. Fish images represent extreme shape changes associated with DF1 and DF2.
pelvic fin. Once more clusters from Angola and Canary Island specimens are obvious, while the European areas show some overlap, especially for the first DF. The discriminant analysis assigned 84.9% of the total specimens to the correct geographical area, with very high classification success, above 90%, found for Angola, Canary Island and Peniche (Table 2.3). The Golf of Biscay specimens had the lower classification rate (51.9%), with several individuals assigned to the other European areas, mainly the English Channel and Galicia.
Chapter 2
22
Table 2.3 Jackknifed classification matrix of the discriminant analysis performed on black
sea-bream, Spondyliosoma cantharus, specimens from the seven study areas.
Area EN BI GL PN AL CN AN EN 72.0 0.0 16.0 8.0 4.0 0.0 0.0 BI 11.1 51.9 14.8 7.4 14.8 0.0 0.0 GL 5.6 0.0 77.8 14.8 1.9 0.0 0.0 PN 1.9 0.0 5.8 90.4 1.9 0.0 0.0 AL 2.7 5.5 2.7 5.5 83.6 0.0 0.0 CN 0.0 1.8 0.0 3.6 0.0 94.6 0.0 AN 0.0 0.0 0.0 0.0 2.3 0.0 97.7 Percentages in rows represent the classification into the areas given in columns (correct classification in bold). Overall classification success: 84.9%, Wilks’ λ = 0.004, Cohen’s к = 0.728. Areas labels as in Table 1.
2.4 Discussion
In the present study, the differences in the body shape of black seabream along the eastern Atlantic were investigated using geometric morphometrics. Morphometric patterns are often associated with geographic differences in growth, maturity, or mortality which are critical to population dynamics (Cadrin, 2010) and if the groups are isolated enough, a structuring pattern of these phenotypic differences can be retrieved. Identification of intraspecific groups which have different life history features is crucial for understanding population dynamics and achieve a sustainable harvest (Cadrin and Silva, 2005). Molecular markers have gained an increased importance in the identification of marine population and fisheries stocks (Valentin et al., 2014), however, the timescale of these markers often fails to reflect the biological characteristics that induce population structure. Phenotypic differences which are temporally stable can be indicative of distinct biological population and offer a practical measure for population discrimination (Cadrin et al., 2010).
A clear isolation for the Canary Island and Angola specimens is reported in this paper, which is expected since they have a high geographic distance from all the other areas. Information on life history parameters also reflect the separation of Canary Islands from European areas, with a reproductive season much wider than for the rest of the areas (Perodou and Nedelec, 1980; Soletchnik, 1983; Pajuelo and Lorenzo, 1999; Gonçalves and Erzini, 2000) and, although the estimated growth rate was similar to those reported by Perodou and Nedelec (1980); Soletchnik (1983) and Abecasis et al. (2008) for Golf of
23 Biscay, the English Channel and Algarve, respectively, it is higher than the one reported for western Portuguese coast (Neves et al., 2017). Natural mortality rates found for the Canary Islands were also much higher than those reported for the western Portuguese coast (Neves et al., 2017).
Among the European areas, differences in phenotypic patterns were not so evident, although a high percentage of correct assigned specimens was obtained for most of the areas. The exception was the Golf of Biscay that had a large number of individuals assigned to other areas, mainly Galicia and the English Channel, the nearby regions. This can indicate migratory movement among these regions and thus there is no stability of the Golf of Biscay population to achieve a clear phenotypic pattern. The heterogeneity of Golf of Biscay sample, which presented the smallest and biggest specimen caught in this study, could, at a first sight, be an explanation for the low discrimination in this area since during fish growth, from larvae to adulthood, the body relative proportions change as an adaptation to habitat and diet. However, all the fishes sampled had already reached maturity, and therefore there were no ontogenetic shape changes that could influence the morphologic characterisation of this area. The Golf of Biscay has already been reported as a convergent area for Northern and Southern characteristics. Zarraonaindia et al. (2012) found high haplotypic diversity for European anchovy specimens of Golf of Biscay, which presented similar phylogroup frequencies for the English Channel-North Sea group and the East Atlantic Coast group.
Life history information for the black sea bream in the sampled areas is scarce and probably some is already outdated, but the existing data, sort out differences between the reproductive season for the northern areas, English Channel and Golf of Biscay (Perodou and Nedelec, 1980; Soletchnik, 1983) where the sea temperature is colder and the Portuguese coast (Gonçalves and Erzini, 2000; Neves, unpublished data) where the black seabream shows a larger reproductive season. Some differences between the west and the south Portuguese coasts also seem to exist, having the specimens from Algarve a larger size at first maturation (Gonçalves and Erzini, 2000) and a higher growth rate (Abecasis et al., 2008) than those from the west coast (Neves et al., 2017; Neves et al., 2018).
A high correct classification for the black seabream for three very close Portuguese areas was also achieved by Correia et al. (2012) usingotolith chemistry. These authors found that even for areas as close as Olhão and Sagres (southern Portuguese coast) a near 100%