Faculdade de Ciências
Departamento de Biologia Animal
Genetic diversity and population structure of
Solea solea and Solea senegalensis and its
relationships with life history patterns
Tatiana Fonseca de Araújo Teixeira
Tese orientada por
Professora Doutora Maria Manuela Coelho Professor Doutor Henrique Nogueira Cabral
Mestrado em Biologia e Gestão dos Recursos Marinhos Especialidade em Gestão e Ordenamento do Meio Marinho
"I recognize the right and duty of this generation to develop and use our natural resources, but I do not recognize the right to waste them, or to rob by wasteful use, the generations that come after us." Theodore Roosevelt
“Nature provides a free lunch, but only if we control our appetites.” William Ruckelshaus
ACKNOWLEDGMENTS
To all the people that somehow have contributed to this work I hereby express my sincere gratitude, especially to
Professor Maria Manuela Coelho and Professor Henrique N. Cabral for their support, supervision and advice, and for guiding me trough my first steps into marine science,
Dr. Joana Marques for her enormous support, advice, help, and especially, friendship in all the moments, at any time and any place, even from the other side of the World,
Dr. Célia Teixeira, for her great help from the very beginning of this work, especially for the late night sampling at MARL and all the North to South trips, and for making all “peixes chatos” less boring,
All the team from the laboratory of Ecologia Evolutiva e Molecular – Carina, Irene, Rita, Maria Ana, Cristiane and Vera – for their practical help, shared knowledge and support, and a very especial thanks to Francisco, for always having a nice word to say and a huge lot of patience,
All the team from the laboratory of Zoologia Marinha, at the Instituto de Oceanografia, especially to Dr. Inês Cardoso and my “final rush hour” colleagues, Marisa, Sofia and Miguel,
People from allover Europe that contributed to the sampling process,
Cris, my true and always present friend, for all the support even 300km apart, and companion in “Lado lunar” song in the traffic, Ju, forever dinosaurs friends, for all the patience and care trough my horst days and for sharing the happiness of the better ones,
Artur for the huge help to do such amazing maps, “colouring my work”,
My family, for all the love, care and outstanding support, especially to my mother (for all the nights that she “worked” with me), father and sister that were always at my side encouraging me and that had a lot of patience, and to Tó, for everything, especially for always be at my side – thank you a lot, there are not enough words to express my gratitude.
This thesis was supported by the Project SOLEA (FEDER 22-05-01-FDR-00024), “Biologia e estado de exploração dos stocks de espécies de linguados e solhas com interesse comercial da costa portuguesa: contributos para a gestão sustentável dos recursos”, co-financed by EC (FEDER-MARE).
"Let us be grateful to people who make us happy; they are the charming gardeners who make our souls blossom." Marcel Proust
RESUMO
A avaliação da variação genética e o conceito de estrutura geográfica das populações de peixes são fundamentais para a compreensão da dinâmica das mesmas e para a conservação e exploração sustentável dos recursos pesqueiros.
Inúmeras espécies de peixes chatos (Pleuronectiformes) possuem um elevado valor comercial sendo, por isso, fortemente exploradas em todo o mundo, tanto a nível das pescas como da aquacultura. Nalgumas áreas geográficas, e em particular nos oceanos Atlântico e Pacífico, os valores das capturas dos peixes chatos correspondem entre 10% a 30% do total de capturas. Na costa Portuguesa, e apesar do valor total de desembarques não ser particularmente elevado, os peixes chatos são um importante recurso dado o seu elevado valor comercial, especialmente o do linguado legítimo, Solea solea (Linnaeus, 1758), uma das principais espécies alvo da pesca de arrasto na Europa. No entanto, o conhecimento sobre a biologia e estado de exploração dos stocks das espécies de Pleuronectiformes com elevada importância económica, é ainda incipiente e limitado, principalmente no Sul da Europa e no Norte de África, onde a importância destes recursos é também elevada.
S. solea e Solea senegalensis, Kaup, 1858, são espécies de linguado marinhas, com morfologia similar, cuja principal característica do ciclo de vida consiste na existência de uma fase juvenil, predominantemente estuarina, e uma fase adulta, marinha. Ambas utilizam os sistemas estuarinos como áreas de viveiro, beneficiando, assim, da elevada disponibilidade de alimento e da existência de poucos predadores nestas áreas. Este padrão de história vital poderá ter impacto na estruturação das
populações adultas, que habitam áreas costeiras marinhas mais profundas, particularmente no que se refere à sua diferenciação genética, uma vez que poderá induzir reduzidos valores de fluxo genético, como resultado de comportamentos “homing” a áreas de desova e de uma forte associação entre os locais de desova e as zonas de viveiro.
Alguns estudos de diferenciação genética, considerando vastas áreas geográficas, e recorrendo a diferentes tipos de marcadores moleculares, têm sido desenvolvidos em peixes chatos com interesse comercial, sendo o linguado legítimo uma das espécies mais estudadas. No entanto, nenhum destes estudos usou como marcador molecular o citocromo b (gene do DNA mitocondrial). Por outro lado, o único estudo populacional existente para S. senegalensis foi desenvolvido apenas na costa Portuguesa. A análise de nove loci polimórficos de isoenzimas, permitiu verificar uma grande homogeneidade genética entre as diversas amostras.
O principal objectivo deste trabalho consistiu em determinar a diversidade genética e a estrutura populacional de S. solea e S. senegalensis ao longo das suas áreas de distribuição, desde o Mar Báltico até ao Norte de África e Mar Mediterrâneo, relacionando-as com os seus padrões de história vital.
A diversidade genética e estrutura populacional de S. solea e de S. senegalensis foram analisadas com base em sequências completas do citocromo b do DNA mitocondrial (cerca de 1141 pares de bases) de diversas amostras recolhidas ao longo das suas áreas de distribuição. Valores de elevada variação genética (h) e reduzida a moderada diversidade nucleotídica (π) foram observados em todas as populações analisadas de S. solea e S. senegalensis (excepto na população do Norte de Portugal de S. senegalensis), níveis esses característicos de espécies com amplas áreas de distribuição geográfica e elevado fluxo de indivíduos. Os resultados da análise demográfica, assim como as árvores haplotípicas em forma de estrela sugerem expansão em termos do efectivo populacional das populações de ambas as espécies.
Para S. solea, foram detectados níveis significativos de diferenciação genética à escala inter-regional, verificando-se a existência de dois grupos de populações: um correspondente às populações do Atlântico e outro correspondente às populações do Mediterrâneo. Esta diferenciação genética Atlântico – Mediterrâneo poderá ser explicada pelas características biogeográficas, nomeadamente pela grande descontinuidade oceanográfica do estreito de Gibraltar-Mar de Alboran. As populações de S. solea do Atlântico demonstraram, ainda, constituir uma unidade panmíctica ou “quasi-panmíctica”, presumivelmente devido aos elevados níveis de fluxo genético que ocorrem em cada geração. No entanto, as populações do Mediterrâneo exibiram níveis significativos de diferenciação populacional entre as regiões Este e Oeste, o que poderá ser consequência de uma possível recolonização do Mediterrâneo por populações do Atlântico. Uma outra explicação para os elevados níveis de diferenciação encontrados entre populações do Mediterrâneo, parece residir na complexa história do Mediterrâneo, que sofreu a acção de várias forças estruturadoras durante os últimos episódios glaciares. A diminuição do nível do mar nestas épocas provocou alteração das linhas de costa, levando à criação de refúgios distintos nesta área, separando as zonas Este e Oeste, que, desde então, apresentam diferentes regimes hidrográficos, sendo o da zona Oeste mais uniforme que o da zona Este devido à geografia de cada uma destas zonas. A referida diferenciação poderá, ainda, ser atribuída a factores relacionados com a biologia de S. solea, tal como o intervalo de temperaturas toleradas pelas larvas desta espécie. Analisando todos os indivíduos amostrados, i.e., populações do Atlântico e Mediterrâneo, verifica-se a existência de isolamento por distância entre as populações de S. solea.
S. senegalensis exibiu um padrão de heterogeneidade genética significativa, mesmo entre populações separadas por curtas distâncias geográficas, presumivelmente contidas na área potencial de migração dos indivíduos desta espécie, e onde, a longo prazo, o balanço entre fluxo genético e forças responsáveis pela diferenciação genética poderá resultar em gradientes, aumentando a diferenciação genética em função do aumento da distância geográfica. Por si só, as distâncias geográficas parecem, de facto, ser muito importantes na estruturação das populações
de S. senegalensis, havendo uma forte associação entre estas e as divergências genéticas verificadas no grupo de amostras analisadas, estando esta associação fortemente relacionada com as diferenças latitudinais entre amostras. Os resultados de diferenciação obtidos para S. senegalensis, salientam, ainda, a importância da temperatura como factor redutor do fluxo genético entre populações, uma vez que a variação da temperatura condiciona a duração do período larvar, assim como a taxa de sobrevivência das larvas, restringindo a dispersão larvar e, consequentemente, o nível de fluxo genético, promovendo, assim, o isolamento genético de populações geograficamente próximas.
A homogeneidade verificada entre as amostras de S. solea e a diferenciação encontrada entre as amostras de S. senegalensis, observadas no presente estudo, sugerem uma reduzida importância dos sistemas estuarinos como forças estruturantes da diferenciação genética das populações destas espécies, uma vez que, embora ambas possuam um padrão similar de utilização dos sistemas estuarinos, exibem diferentes níveis de diferenciação populacional.
Em conclusão, os resultados obtidos neste estudo demonstraram a existência de estruturação populacional em ambas as espécies, embora a diferentes escalas: enquanto em S. solea a diferenciação genética se verifica entre as populações do Atlântico e as do Mediterrâneo, assim como no interior do Mediterrâneo, entre as populações localizadas a Este e a Oeste, em S. senegalensis foi detectada diferenciação genética entre populações de acordo com a sua distância geográfica, sendo tanto maior quanto mais distantes se encontram as populações. Os níveis de diferenciação detectados para cada espécie reflectem, de uma forma generalizada os seus padrões de história vital, estando particularmente relacionados com a duração do período larvar pelágico e com a sua tolerância a variações na temperatura.
O desenvolvimento de uma análise mais aprofundada, incluindo um estudo combinado de vários marcadores moleculares, e uma amostragem espacial mais alargada, incluindo amostras de locais representativos de toda
a área de distribuição das espécies e o maior número possível de amostras de um mesmo local, poderá permitir uma análise mais precisa e completa, conduzindo a uma melhor compreensão da estruturação das populações de S. solea e S. senegalensis.
Os resultados deste estudo poderão ter particular interesse para sustentar a definição de unidades populacionais (stocks) destas espécies, contribuindo, assim, para uma gestão mais sustentável destes recursos pesqueiros.
Palavras-chave: linguado comum, linguado do Senegal, DNA mitocondrial, estrutura genética populacional, padrões de história vital.
SUMMARY
Soles (Solea spp.) are heavily exploited all round the world (fisheries and aquaculture) due to their high commercial value. Nonetheless, the knowledge on their biology and the exploitation status of their stocks is limited to certain geographical areas. A key issue to management is the population structure of fisheries resources.
The aim of the present study is to determine the genetic diversity and population structure of Solea solea (Linnaeus, 1758), and Solea senegalensis, Kaup, 1858, throughout their distribution range and to evaluate its relationships with life history patterns.
The genetic diversity and population structure of both species were analysed based on sequences of cytochrome b of mitochondrial DNA (about 1141 bp in length).
A low nucleotide diversity (π<0.005) and high haplotype diversity (h>0.600) was observed for both species (except for Portugal-North population of S. senegalensis, h=0.378). The pairwise Φ-statistics and AMOVA for S. solea evidenced a high genetic divergence between Atlantic and Mediterranean populations and between the Eastern and Western areas of the Mediterranean. Significant differences were also observed between samples of S. senegalensis, with geographical distance per se assuming a very important role in structuring populations and presenting a strong association with genetic divergence amongst the set of samples analyzed.
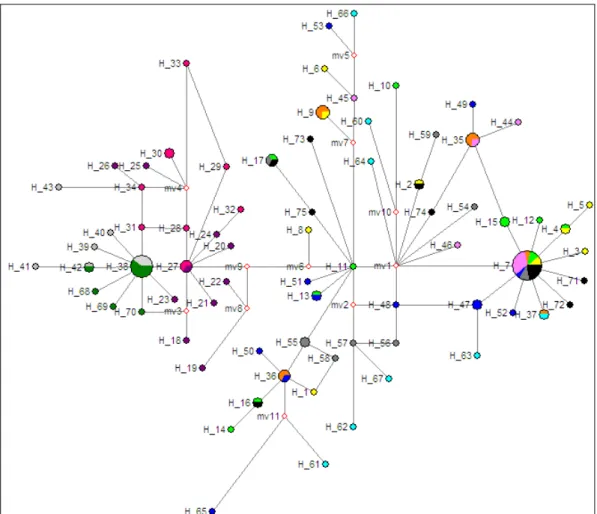
Minimum spanning network analyses, revealed star-shaped patterns for populations of both species, suggesting that populations had undergone
expansion following bottlenecks. Atlantic populations of S. solea, ranging from the Baltic Sea to South Portugal could be considered as representative of the same panmictic unit, presenting high levels of gene flow.
The higher levels of diversity observed in S. senegalensis compared to S. solea may be due to differences in the duration of the pelagic larval phase, spawning period and habitat use patterns, with water temperature assuming a major role in restricting gene flow and consequently in the population genetic structure of both species.
Key-words: common sole, Senegal sole, mitochondrial DNA, genetic population structure, life history patterns.
T
ABLE OFC
ONTENTS AKNOWLEDGMENTS... i RESUMO... iii SUMMARY... ix Chapter 1 General Introduction... 3 Chapter 2 Genetic diversity and population structure of Solea solea and Solea senegalensis and its relationships with life history patterns ... 192.1 Introduction ... 19
2.2 Material and methods ... 23
2.2.1 Sampling and DNA extraction ... 23
2.2.2 PCR amplification and sequencing ... 24
2.2.3 Sequence alignment ... 25
2.2.4 Population genetic analysis ... 25
2.2.5 Neutrality and demographic history ... 27
2.3 Results ... 28
2.3.1 Solea solea ... 28
2.3.2 Solea senegalensis ... 37
Chapter 3
Concluding remarks and challenges ... 59
General Introduction
The use of molecular genetic techniques in fisheries research began in the 1950s with studies of blood group variants, primarily in tunas, salmonids and cod, successfully demonstrating the existence of genetically controlled variation which could be the basis of analyses of population structure of those species (Ward & Grewe, 1994). In the 1960s decade, the study of haemoglobin variants of whiting (Gadus melangus) and cod (Gadus morhua), by Sick (1961), increased the use of protein electrophoresis among fish geneticists (Avise & Smith, 1974; Allendorf et al., 1976), for being a quicker, reasonably inexpensive, reproducible method, especially because the majority of fish species with commercial interest showed enough variation, allowing to develop a fast analysis of population structure.
Although the initial knowledge about fish genetics came from the use of protein electrophoresis, this technique presents certain limitations, like the requirement of fresh or frozen tissue, the need for a larger amount of tissue samples than most DNA methods, and the inappropriate resolution to detect interpopulational and interindividual differences (Ward & Grewe, 1994).
The use of mitochondrial DNA (mtDNA) in genetic studies is generally assumed to be more powerful than the referred protein analysis, for both phylogenetic and population studies, mostly due to the characteristics presented by that marker: haploidy; maternal transmission - it presents ¼ of effective population size of nuclear DNA (nDNA), being, therefore, more sensitive to detect reductions in genetic variation, particularly genetic drift effects; putative lack of recombination; and relatively high mutation rates – it has a large capacity to accumulate mutations that gives it a faster rate of evolution than nDNA in higher animals (Ward & Grewe, 1994). Another
advantage relies in the fact that the study of this molecular marker can be done using fresh, frozen or ethanol-stored tissues and only requires a small amount of sample (few nanograms). Moreover, the whole molecule may be regarded as a single locus with multiple alleles (Park & Moran, 1994).
Mitochondrial genome has been widely used to study phylogenetic relations between several taxa, from family level to population level, not only because it evolves 10 times faster than nuclear DNA, but also due to the characteristics that make it easy to amplify and sequence (Ward & Grewe, 1994). However, the maternal inheritance of mtDNA can be a limitation to its use since it does not provide information about the genome of males, whose dispersal behaviour might be different from that of females, from the same population.
Although the reference to tandemly repeated sequences of DNA in eukaryotic genomes appeared during the 1960s, it was the development of recombinant DNA technology, namely the development of “DNA fingerprinting” techniques (Jeffreys et al., 1985), that enhanced the importance of using this highly diverse sequences in studies regarding population biology. With the finding of highly polymorphic microsatellite loci in the middle 1990s, the potential to detect very low levels of differentiation in species presenting a high gene flow increased substantially, allowing the discrimination of individuals and populations (Carvalho & Hauser, 1994). Such genetic markers have been routinely used in recent studies considering fish species with high dispersal capabilities such as cod (Nielsen et al., 2003), European seabass (Bahri-Sfar et al., 2000) and eel (Wirth & Bernatchez, 2001), constantly detecting population substructure.
Due to their origin, microsatellites are multi-allelic in a population and di-alellic in an individual. They are codominant markers that exhibit Mendelian heredity, allowing the distinction of heterozygote or homozygote individuals in a given loci, therefore enabling analyses of relationships, structure and classification at the individual (genotype) and population (allelic frequencies) levels (Wan et al., 2004).
Nonetheless, and independently of the molecular marker used, data from DNA is easy comparable and allows to search for the relations among organisms at any level, from sibling individuals to species of different kingdoms (Avise, 1994).
Population structure of a species is the result of a complex interaction between demographic parameters (e.g. growth, recruitment, reproduction, mortality), life history patterns (e.g. homing behaviour, pelagic larval stages) and genetic processes (e.g. selection, mutation, drift, gene flow). Since the end of 19th century, population dynamics (life history and demography) of several fish species with commercial interest have been studied. However, several methods are quite difficult to be used on the analyses of the structure of exploited stocks or populations of marine fish species (ecological performance, parasites distribution, physiological and behavioural characteristics, tagging, morphometric and meristic analysis, calcified structures, cytogenetics, immunogenetics, blood pigments and genetic molecular tools). Therefore, the resort to heterogeneity of molecular markers, such as proteins and nucleic acids, has become of an universal and undeniable utility (Carvalho & Hauser, 1994), but only more recently have become available to complete studies of populational structure, especially those aiming the definition of stocks, not only due to the increasing availability of different molecular techniques in genetics, but also due to the recognition of the importance of genetic data.
The analysis of genetic variation among fish species allows the discrimination at the species, population and individual levels, the identification of hybrids, the establishment of species and population phylogeny and phylogeographic history, the discrimination of different stocks and the analyses of their migration patterns and effective size, and to assess individual stock contribution to mixed stock fisheries, evaluating the response of stocks to fisheries exploitation (Wirgin & Waldman, 1994).
In the fisheries context, genetic tools have also been used in aquaculture, to study pathogenic organisms in high commercial value species and the expression of growth factors during maturation (Park & Moran, 1994). Other
genetic studies have also considered introduced species, the effects of fisheries and pollution on genetic diversity and the genetics of rare and endangered species (Ward & Grewe, 1994).
Sustainable exploitation of fish stocks is a concept that dominates the fisheries management for almost 50 years. The central idea is that each stock has a harvestable surplus, and that fisheries that do not exceed this will not compromise the stock’s natural perpetuation (Carvalho & Hauser, 1994). However, in 2002, almost 76% of the world’s marine stocks were considered fully exploited or overexploited (FAO, www.fao.org). Unfortunately, and even after the collapse of major fisheries, such as cod and herring (Hutchings, 2000), remains the idea that marine fishes, particularly pelagic fishes, are resilient to large population reductions. The trend of stocks offering potential for expansion is clearly downwards, decreasing from 40% in 1970, to 24%, in 2004 (FAO, 2005).
The definition of stocks and their boundaries has become an essential part of fisheries management, especially since several studies developed in Northern Europe have referred high pressure on marine resources, resulting in a decrease of effective population size, being some stocks already out of their biological safety limits. However, the geographic areas considered in the establishment of management policies do not often coincide with the biological stocks’ distribution, simply because of seasonal movements of these stocks between the several management areas, or because different fish stocks may occur simultaneously in a unique area, generally resulting in a mismatch in the spatial scale of management and biological reality (Pawson & Jennings, 1996).
To achieve the sustainable development of fisheries resources at a global scale, it is necessary the accurate knowledge of the ecology and biology of exploited species, particularly regarding their evolution and population dynamics in space and time. Likewise, studies such as those already developed for cod , by Knutsen et al. (2004), for herring by Ruzzante et al. (2006), and for common sole, by Rolland et al. (2007), are needed in order
to predict the impact of fishing exploitation and to forecast the efficiency of management measures.
The stock concept has numerous meanings in the fisheries context, such as an abstract and undefined unit or a spatial location in which the fish are found and can be exploited by a specific fishing technique, and in the biological context – a genetic unit defined as a group of individuals that mate randomly, with a variable degree of spatial and temporal integrity (Carvalho & Hauser, 1994).
In marine species with high dispersal patterns, which includes most of marine fishes, it is considered that high gene flow leads to population homogeneity, at a large scale, as a result of their life cycle patterns; factors like high fecundity, passive dispersal of larvae and active migration of adults, lead to the lower levels of genetic differentiation exhibited by marine species, relatively to fresh water or anadromous species (Carvalho & Hauser, 1994; Ward et al., 1994; Ward, 2002).
The extent of gene flow will generally determine the genetic heterogeneity of the species, in the absence of localised selection (Exadactylos et al., 1998). Several marine fish exhibit low levels of haplotype diversity and population divergence (Avise, 1994), that can be a result of low rates of genomic evolution or recent bottleneck events. Mechanisms such as climatic fluctuations, different time and place of spawning (Ruzzante et al., 2006), and physical structuring forces, like geographical distance (Hoarau et al., 2002), depth, ocean currents and fronts favouring larval retention (Nielsen et al., 2005), transitions in temperature and salinity (Nielsen et al., 2003), as well as strong phylopatry, can explain how population structure can evolve in a environment without any obvious physical boundaries to gene flow (Hemmer-Hansen et al., 2007), resulting in small, but significant and usually temporally stable, levels of genetic divergence in many species of marine fishes (Ruzzante et al., 1996; Wirth & Bernatchez, 2001; Nielsen et al., 2003; Nielsen et al., 2004; Ruzzante et al., 2006).
The failure in detecting differentiation can be a consequence of the incapability to detect variation, explained by insufficient resolution of the markers used, or of the reduced knowledge of the biology of the studied species.
Genetic structure of a species reflects individual’s organization. In a simplified theoretic perspective, there are three basic models of structure in natural populations (Richardson et al., 1986). The simplest model considers the existence of a unique panmictic unit, where there is no population subdivision, and random mating between individuals is verified, resulting in the absence of significant genetic differentiation between groups of individuals of certain regions. Another model considers discrete populations in a major panmictic group, but genetic flow between them is limited, suggesting an accentuated genetic differentiation between different units, conducing to a discontinuity of allele frequencies in several loci within the same geographical area. There are also several variants of these models which take into account the genetic flow between several population units. A third group of models, based on the isolation by distance (IBD) concept, consider a continuous geographical distribution of populations, but gene flow between them is limited by the dispersal capacity of each individual. Although they consider the existence of genetic differentiation between population units, genetic variation in several loci is gradual, and discrete boundaries like those referred in the previous model do not exist. But more important than the identification of a structural model, is the recognition of the factors determining population genetic structure.
The knowledge on population structure is fundamental to manage fisheries of high commercial value species that present a broad-scale distribution. Several flatfish species (Pleuronectiformes) are heavily exploited all around the world (fisheries and aquaculture). In some geographical areas, particularly in the Atlantic and the Pacific, flatfish represent from 10% to 30% of total catches (Millner et al., 2005). In the Portuguese coast, and although the value regarding their total catch is not particularly high, flatfishes are amongst the species with the highest commercial value.
In several geographical areas, especially in Northern Europe, Pleuronectiformes have been studied for a long time. Aspects like abundance of some of these resources (Rijnsdorp et al., 1992), feeding ecology (Knutsen, 1992), growth (Andrade, 1992) and reproduction (Deniel, 1984; Deniel et al., 1989) are well documented in the literature. Nonetheless, knowledge on their biology and exploitation status is limited, especially in Southern Europe and Northern Africa, where the importance of these resources in undeniably high. In the Portuguese coast, most studies on the ecology of Pleuronectiformes have focused juvenile stages, particularly in estuaries and coastal lagoons (e.g. Dinis, 1986; Andrade, 1990; Cabral, 1998, 2000, 2003; Cabral & Costa, 1999; Cabral et al., 2002). However, the acquired knowledge in some geographic areas cannot be transposed to other areas, because of their distinct oceanographic and climatic characteristics.
Several differentiation studies have been conducted on commercially important flatfish species considering a broad geographic scale. For plaice, Pleuronectes platessa (Linnaeus, 1758), Purdom and Thompson (1976) and Ward and Beardmore (1977) used allozyme loci to compare samples from the Irish Sea, Bristol Channel and southern North Sea and were not able to establish any differentiation. However, significant population differentiation was detected by Hoarau et al. (2004) between shelf and off-shelf populations (with microsatellites and mtDNA), and with mtDNA data they were able to detect differentiation within the continental shelf.
For halibut, Hippoglossus hippoglossus (Linnaeus, 1758) (Foss et al., 1998) and brill, Scophthalmus rhombus (Linnaeus, 1758) (Blanquer et al., 1992), the conduced allozyme analysis were not able to detect differentiation within North Atlantic populations. In turbot, Scophthalmus maximus (Linnaeus, 1758), Nielsen et al. (2004) reported subtle differentiation between the Baltic and the North Sea, and Florin and Höglund (2007) found low, although significant, genetic differentiation within the Baltic Sea, both studies with microsatellites analysis.
For flounders, Platichthys flesus (Linnaeus, 1758), and Platichthys stellatus (Pallas, 1787), through the analysis of allozyme variation, Borsa et al. (1997) detected a strong differentiation between Atlantic, Western Mediterranean and Adriatic populations. High differentiation levels were also found within the Mediterranean area. In the North Atlantic region, the levels of differentiation were much lower although indicating some isolation by distance. Considering the North Sea region, differentiation has been reported, north and south of the Dogger Bank. Hemmer-Hansen et al. (2007) analysed microsatellite loci and found a clearly large and highly significant genetic structuring among the samples of P. flesus from several localities of the Northeast Atlantic and Baltic Sea.
In sole, Solea solea (Linnaeus, 1758), Kotoulas et al. (1995) detected, with allozyme loci analysis, significant differentiation between Mediterranean and Atlantic populations, as well as a weak North-South differentiation across the European Atlantic coast and East-West differentiation across the Mediterranean, suggesting the existence of an isolation by distance (IBD) model. The authors further conclude that the Atlantic populations constitute however, one single panmictic or quasi-panmictic unit. Considering the same geographical scale, Rolland et al. (2007) obtained similar results of differentiation, with the analysis of nuclear-DNA non-coding loci. Differentiation within the Mediterranean region was also documented by Guarniero et al. (2002) and Garoia et al. (2007), with the study of control region of mtDNA and microsatellites and amplified fragment length polymorphisms (AFLPs), respectively.
The between-region differences found in flounder and sole are generally attributed to narrow larval temperature tolerances of these two flatfish species, compared with other flatfish of the same region (Hoarau et al., 2002).
Within the Portuguese coast, Cabral et al. (2003) obtained low genetic differentiation between samples of common sole and Senegal sole, Solea senegalensis, Kaup, 1858, from several estuarine systems, and Pinheiro et al. (2005) indicated a great variability among samples of sand sole, Solea
lascaris, (Risso, 1810), suggesting low levels of differentiation of this species, both using allozyme electrophoresis.
The main objective of this study was to determine the genetic diversity and population structure of S. solea and S. senegalensis, throughout their distribution range, from the Baltic Sea to North Africa and Mediterranean Sea, evaluating the relationships found in the context of the life history patterns and ecology of these flatfishes.
References
Allendorf F.W., Ryman N., Stennek A. and Stahl G. (1976) Genetic variation in Scandinavian brown trout (Salmo trutta L.): evidence of distinct sympatric populations. Heriditas 83: 73-82.
Andrade, J.P. (1990) A importância da Ria Formosa no ciclo biológico de Solea senegalensis (Kaup 1858), Solea vulgaris (Quensel, 1806), Solea lascaris (Risso, 1810) e Microchirus azevia (Capello, 1868), Ph.D. Thesis, Universidade do Algarve, Faro.
Andrade, J.P. (1992) Age, growth and population structure of Solea senegalensis, Kaup, 1858 (Pisces, Soleidae) in the Ria Formosa (Algarve, Portugal). Sci Mar 56: 35-41.
Avise J.C. (1994) Molecular Markers, Natural History and Evolution, Chapman and Hall, New York, NY. 511 pp.
Avise J.C. and Smith M.H. (1974) Biochemical genetics of sunfish. I. Geographic variation and subspecific interdegradation in he bluegill, Lepomis macrochirus. Evolution 28: 42-56
Bahri-Sfar L., Lemaire C., Ben Hassine OK. and Bonhomme F. (2000) Fragmentation of sea bass populations in the western and eastern Mediterranean as revealed by microsatellite polymorphism. Proc R Soc B 267: 929 –935.
Blanquer A., Alayse J.P., Berrada-Rkhami O. and Berrebi P. (1992) Allozyme variation in turbot (Psetta maxima) and brill (Scophthalmus rhombus)
(Osteichthyes, Pleuronectiformes, Scophthalmidae) throughout their range in Europe. J Fish Biol 41: 725 –736.
Borsa P., Blanquer A. and Berrebi P. (1997) Genetic structure of the flounders Platichthys flesus and P. stellatus at different geographic scales. Mar Biol 129: 233-246.
Cabral H.N. (1998) Utilização do estuário do Tejo como área de viveiro pelos linguados, Solea solea (L., 1758) e Solea senegalensis Kaup, 1858, e robalo, Dicentrarchus labrax (L., 1758). Ph.D. Thesis, Faculdade de Ciências da Universidade de Lisboa, Lisboa.
Cabral H.N. (2000) Comparative feeding ecology of sympatric Solea solea and S. senegalensis, within the nursery areas of the Tagus estuary, Portugal. J Fish Biol 57, 1550-1562.
Cabral H.N. (2003) Differences in growth rates of juvenile Solea solea and Solea senegalensis according to habitat use pattern in the Tagus estuary, Portugal. J Mar Biol Assoc UK 83, 861-868.
Cabral H.N. and M.J. Costa (1999). Differential use of the nursery areas within the Tagus estuary by sympatric soles, Solea solea (Linnaeus, 1758) and Solea senegalensis Kaup, 1858 Environ Biol Fish 56:389-397
Cabral H.N., Lopes M. and Loeper R. (2002) Trophic niche overlap between flatfishes in a nursery area on the Portuguese coast. Sci Mar 66, 293– 300.
Cabral H.N., Castro F., Linhares D. and Alexandrino P. (2003) Genetic differentiation of Solea solea (Linnaeus, 1758) and S. senegalensis Kaup, 1858, (Pisces: Pleuronectiformes) from several estuarine systems of the Portuguese coast. Sci Mar 67: 43-52.
Carvalho G.R. and Hauser L. (1994) Molecular genetics and the stock concept in fisheries. In: Carvalho, GR; Pitcher, TJ (Ed.). Molecular genetics in fisheries. London: Chapman and Hall. p. 55-79.
Deniel C. (1984) La reproduction des poisons plats (Téléostéens- Pleuronectiformes) en Baie de Douarnenez. II. Cycles sexulaes et fécondité des Soleidae: Solea vulgaris vulgaris, Solea lascaris, Buglossidium luteum et Microchirus variegatus. Cah Biol Mar 25:257-285
Deniel C., Le Blanc C. and Rodriguez A. (1989) Comparative study of sexual cycles, oogenesis and spawning of two Soleidae, Solea lascaris (Risso, 1810) and Solea impar (Bennet, 1831), on the western coast of Brittany. J Fish Biol 35: 49-58.
Dinis M.T. (1986) Quatre Soleidae de l’estuaire du Tage. Reproduction et croissance. Essai d’élevage de Solea senegalensis Kaup, Ph.D. Thesis, Université de Bretagne Occidentale.
Exadactylos A., Geffen A.J. and Thorpe, J.P. (1998) Population structure of the Dover sole, Solea solea L., in a background of high gene flow. J Sea Res 40, 117-129.
FAO, in www.fao.org.
FAO (2005) Review of the state of the world marine fishery resources. FAO Fisheries Technical Paper 457. Food and Agriculture Organization of the United Nations, Rome 2005, pp:1-14.
Florin A. and Höglund J. (2007) Absence of population structure of turbot (Psetta maxima) in the Baltic Sea. Mol Ecol 16: 115-126.
Foss A., Imsland A.K. and Naevdal G (1998) Population genetic studies of the Atlantic halibut in the North Atlantic Ocean. J Fish Biol 53: 901-905.
Garoia F., Guarniero I., Grifoni D., Marzola S. and Tinti F. (2007) Comparative analysis of AFLPs and SSRs efficiency in resolving population genetic structure of Mediterranean Solea vulgaris. Mol Ecol 16: 1377-1387.
Guarniero I., Franzellitti S., Ungaro N., Tommasini S., Piccinetti C. and Tinti F. (2002) Control region haplotype variation in the central Mediterranean common sole indicates geographical isolation and population structuring in Italian stocks. J Fish Biol 60: 1459-1474. Hemmer-Hansen J., Nielsen E., GrØnkJÆr P. and Loeschcke V. (2007)
Evolutionary mechanisms shaping the genetic population structure of marine fishes; lessons from the European flounder (Platichthys flesus L.). Mol Eco 16, 3104–3118.
Hoarau G., Rijnsdorp A.D., van der Veer H.W., Stam W.T. and Olsen J.L. (2002) Population structure of plaice (Pleuronectes platessa L.) in northern Europe: microsatellites revealed large scale spatial and temporal homogeneity. Mol Ecol 11: 1165–1176.
Hoarau G., Piquet A.M.T., Van Der Veer H.W., Rijnsdorp A.D., Stam W.T. and Olsen JL. (2004) Population structure of plaice (Pleuronectes platessa L.) in northern Europe: a comparison of resolving power between microsatellites and mitochondrial DNA data. J Sea Res 51: 183-190.
Hutchings J.A. (2000) Collapse and recovery of marine fishes. Nature, 406: 882-885.
Jeffreys A.J., Wilson V. and Thein S.L. (1985) Individual-specific “fingerprints” of human DNA. Nature 316: 76-79.
Knutsen J.A. (1992) Feeding behaviour of North Sea turbot (Scophthalmus maximus) and Dover sole (Solea solea) larvae elicited by chemical stimuli. 113: 543-548.
Knutsen H., André C., Jorde P.E., Skogen M.D., Thuròczy E. and Stenseth N.C. (2004) Transport of North Sea cod larvae into the Skagerrak coastal populations. Proc R Soc B 271: 1337-1344
Kotoulas G., Bonhomme F. and Borsa P. (1995) Genetic structure of the common sole Solea vulgaris at different geographic scales. Mar Biol 122: 361 – 375.
Millner R., Walsh S.J. and Díaz de Astarloa J.M. (2005) Atlantic fisheries. In: Gibson, RN. (Eds), Flatfishes Biology and Exploitation. Fish and aquatic Resources Series. Blackwell Publishing, Oxford, pp 240-271.
Nielsen E.E., Hansen M.M., Ruzzante D.E., Meldrup D. and Gronkjaer P. (2003) Evidence of a hybrid-zone in Atlantic cod (Gadus morhua) in the Baltic and the Danish Belt Sea revealed by individual admixture analysis. Mol Ecol, 12: 1497-1508.
Nielsen E.E., Nielsen P.H., Meldrup D. and Hansen M.M. (2004) Genetic population structure of turbot (Scophthalmus maximus L.) supports the presence of multiple hybrid zones for marine fishes in the transition zone between the Baltic Sea and the North Sea. Mol Ecol 13: 585-595.
Nielsen E.E., Gronkjaer P., Meldrup D. and Paulsen H. (2005) Retention of juveniles within a hybrid zone between North Sea and Baltic Sea Atlantic cod (Gadus morhua). Can J Fish Aquat Sci 62, 2219–2225.
Park L.K. and Moran P. (1994) Developments in molecular genetic techiques in fisheries. In: Carvalho, GR; Pitcher, TJ (Ed.). Molecular genetics in fisheries. London: Chapman and Hall. p. 1-28
Pawson M.G. and Jennings S. (1996) A critique of methods for stock identification in marine capture fisheries. Fish Res 25: 203-217.
Pinheiro A., Teixeira C.M., Rego A.L., Marques J.F. and Cabral HN. (2005) Genetic and morphological variation of Solea lascaris (Risso, 1810) along the Portuguese coast. Fish Res 73, 67-78.
Purdom C.E., Thompson D. and Dando P.R. (1976) Genetic analysis of enzyme polymorphisms in plaice (Pleuronectes platessa). Heredity, 37:193-206.
Richardson B.J., Baverstock P.R. and Adams M. (1986) Allozyme elctrophoresis. A handbook for animal systematics and population studies. Academic Press, san Diego.
Rijnsdorp A.D. and van Leeuwen P.I. (1992). Density-dependent and independent changes in somatic growth of female North Sea plaice Pleuronectes platessa Between 1930 and 1985 as revealed by back-calculation of otoliths. Mar Ecol Prog Ser 88: 19-32.
Rolland J.L., Bonhomme F., Lagardère F., Hassan M. and Guinand B. (2007) Population structure of the common sole (Solea solea) in the Northeastern Atlantic and the Mediterranean Sea: revisiting the divide with EPIC markers. Mar Biol vol 151, nr 1. – DOI: 10.1007/s00227-006-0484-0.
Ruzzante D.E., Taggart C.T. and Cook D. (1996) Spatial and temporal variation in the genetic composition of a larval cod (Gadus morhua) aggregation; Cohort contribution and genetic stability. Can J Fish Aquat Sci 53: 2695-2705.
Ruzzante D.E., Mariani S., Bekkevold D., and 14 co-authors (2006) Biocomplexity in a highly migratory pelagic fish, Atlantic herring. Proc R Soc B 273 : 1459-1464
Sick K. (1961) Haemoglobin polymorphism in fishes. Nature, Lond. 192: 894-6.
Wan Q.H., Wu H., Fujihara T. and Fang S.G. (2004). Which genetic marker for which conservation genetics issue? Electrophoresis 25: 2165-2176.
Ward R.D. (2002) Genetics of fish populations. In: Handbook of Fish Biology and Fisheries (eds Hart PJB, Reynolds JD), 1, pp. 200–224. Blackwell publishing, Padstow, Cornwall, UK.
Ward R.D. and Beardmore J.A. (1977) Protein variation in the plaice, Pleuronectes platessa L. Genetical Research, 30: 45-62.
Ward R.D. and Grewe P. (1994) Appraisal of molecular genetic techniques in fisheries. In: Carvalho, GR; Pitcher, TJ (Ed.). Molecular genetics in fisheries. London: Chapman and Hall. p. 29-54.
Ward R.D., Woodwark M. and Skibinski D.O.F. (1994) A comparison of genetic diversity levels in marine, freshwater, and anadromous fishes. J Fish Biol 44: 213–232
Wirgin II. and Waldman J.R. (1994) What DNA can do for you. Fisheries 19 (7): 16-27.
Wirth T. and Bernatchez L. (2001) Genetic evidence against panmixia in the European eel. Nature 409: 1037–1040.
Genetic diversity and population structure of Solea solea and Solea senegalensis and its relationships with life history
patterns
T. F. Teixeira1, C. M.Teixeira1, M. M. Coelho2 and H. N. Cabral1 Universidade de Lisboa, Faculdade de Ciências, 1Instituto de Oceanografia & 2Centro de
Biologia Ambiental, Campo Grande, 1749-016 Lisboa, Portugal
Abstract: The genetic diversity and population structure of Solea solea and Solea senegalensis were analysed, based on the complete cytochrome b sequence of mitochondrial DNA (about 1141 bp in length), of samples obtained throughout the species distribution range. A low nucleotide diversity (π<0.005) and high haplotype diversity (h>0.600) was observed in both species (except for Portugal-North population of S. senegalensis, h=0.378). The pairwise Φ-statistics and AMOVA of S. solea samples evidenced the genetic divergence of Atlantic and Mediterranean populations and of Eastern and Western Mediterranean populations. Significant differences were also observed between samples of S. senegalensis. Atlantic populations of S. solea, ranging from Baltic Sea to South Portugal could be considered as representative of the same panmictic unit. Minimum spanning network analysis revealed star-shaped patterns for populations of both species, suggesting that populations have undergone expansion following bottlenecks. The higher levels of diversity observed in S. senegalensis, compared to S. solea, may be due to differences in the duration of the pelagic larval stage, spawning period and habitat use patterns, with water temperature assuming a major role in restricting gene flow and consequently in the population genetic structure of both species. Key-words: common sole, Senegal sole, mitochondrial DNA, genetic population structure, life history patterns.
2.1 Introduction
The assessment of genetic variation and the concept of geographical structure in marine fish populations are fundamental to the understanding of population dynamics and to the conservation and sustainable management of fisheries resources (Carvalho & Hauser, 1994; Bailey, 1997). Soles (Solea spp.) are heavily exploited resources all around the world (fisheries and aquaculture) presenting a high commercial value. In
fact, common sole, Solea solea (Linnaeus, 1758) is one of the main target species for the European beam-trawl fishery, and heavy fishing pressure on its stocks over the past years has reduced landings from 60.000 tones, in 1994, to 40.000 tones, in 2003 (FAO, www.fao.org). Concern for collapse of this resource has emphasized the importance of conducting studies of its stocks biology, distribution, origin and structure (Millner et al., 1996).
According to the Portuguese fisheries statistics of the past few years, flatfishes represent approximately 1.1% of total fish landings, which corresponds to 143.25 million euros, 7.3% of the total value of landings (source: DGPA). This area has, in fact, a peculiar interest to flatfishes: it is a border area between three biogeographic zones - the warm temperate North Atlantic, the cold temperate North Atlantic and the Mediterranean – constituting the northern or southern limit of distribution for many of the species found here (Cabral et al., 2003a, 2003b), and allowing the occurrence in simpatry of species characteristic from North Africa, Mediterranean and North Europe, all presenting a high diversity of life history patterns and habitat use (i.e. species typical of estuarine environment, species that are exclusively marine, occurring in high depth, with several feeding habitats, different reproductive strategies, different distribution patterns, longevity, etc). The geomorphological particularities of the Portuguese coast, namely a narrow continental shelf divided by deep canyons, could induce a population substructuring pattern (Cabral et al., 2003a).
Beyond common sole, other flatfishes such as the Senegalese sole, Solea senegalensis, Kaup, 1858, sand sole, Solea lascaris, (Risso, 1810), flounder, Platichthys flesus, (Linnaeus, 1758), brill, Scophthalmus rhombus, (Linnaeus, 1758), turbot, Scophthalmus maximus, (Linnaeus, 1758), Microchirus azevia, (Capello, 1867) and Atlantic spotted flounder, Citharus linguatula, (Linnaeus, 1758), are also of high commercial value in Southwest Europe fisheries.
S. solea and S. senegalensis are marine species, similar in their morphology and distribution, from North Africa and the Western
Mediterranean up to the Bay of Biscay, being found on sandy and muddy bottoms at depths of 0-200 m (Quéro et al., 1986). The main feature of their life cycle is a division into a juvenile phase, predominantly estuarine, and an adult phase, which is marine. Both species use estuarine systems as nursery areas, in order to benefit from the high food availability and the existence of few predators (Cabral et al., 2003a). This life history pattern may have an impact on the structuring of offshore adult populations, particularly on their genetic differentiation, since it may be related to a low gene flow, as the result of the possible homing behaviour to spawning grounds and a strong association between spawning and nursery areas. Moreover, the existence of physical barriers to larval dispersion, such as sharp temperature and salinity gradients, hydrodynamic eddies favouring larval retention, and the active vertical swimming of larvae, by which they can avoid passive transport off nursery areas (Kotoulas et al., 1995a), can also contribute to a high genetic differentiation. However, high genetic exchanges can be induced by the long duration of spawning season and larval period and high fecundity (Kotoulas et al., 1995a) as well as by the planktonic stages, although these are limited in their dispersal by temperature tolerance (Borsa et al., 1997).
Few studies of broad-scale geographic differentiation have considered commercially important flatfish, but common sole inhabiting the northern areas of the Eastern Atlantic have been particularly well studied using different kinds of genetic markers: allozymes (Quignard et al., 1986; Kotoulas et al., 1995a; Exadactylos et al., 1998; Cabral et al., 2003a), control region of mitochondrial DNA (mtDNA) (Guarniero et al., 2002), RAPDs (random amplification of polymorphic DNA) (Exadactylos et al., 2003), nuclear-DNA non-coding loci (Rolland et al., 2007), microsatellites and amplified fragment length polymorphisms (AFLPs) (Garoia et al., 2007). Kotoulas et al. (1995a) detected significant differentiation between Mediterranean and Atlantic S. solea populations, as well as a North-South differentiation across the European Atlantic coast and East-West differentiation across the Mediterranean, suggesting the existence of an isolation by distance (IBD) model in population structure. At a smaller geographical scale (Central Mediterranean region), Guarniero et al. (2002)
revealed the existence of genetic structure among adjacent basins, related to the hydrogeographical features of the region. Local and regional studies with North European and Mediterranean samples (e.g. Exadactylos et al., 1998; Cabral et al., 2003a) suggested the absence of population structure, although the results of Cabral et al. (2003a) supported an IBD model. However, most studies conducted with different nuclear markers pointed out the differentiation between Atlantic and Mediterranean populations of S. solea, being the differences within the Mediterranean explained by historical processes favouring vicariance, and to combined effects of contemporary gene flow modulated by ecological traits and hydrologic features (Garoia et al., 2007; Rolland et al., 2007).
Less is known about S. senegalensis populations. Ecological information concerning this species is scarce and refers almost exclusively to the Portuguese coast (e.g. Andrade, 1992; Cabral & Costa, 1999, Vinagre et al., 2006). The generality of genetic studies developed with this flatfish focuses its systematics and phylogeny, particularly in the Mediterranean (Goucha & Pasteur, 1983; Goucha et al., 1987; Borsa & Quignard, 2001; Infante et al., 2004), only recently including a broader-scale area (Pardo et al., 2005). The only population genetic study was developed by Cabral et al. (2003a) that analysed nine polymorphic allozyme loci, pointing out a low genetic differentiation and the absence of population structure for S. senegalensis inhabiting several estuarine systems along the Portuguese coast.
The aim of the present study is to determine the genetic diversity and population structure of S. solea and S. senegalensis throughout their distribution range, using mtDNA cytochrome b data, and to evaluate its relationships with species life history patterns, that could be especially useful for the sustainable management of these resources.
2.2 Material and methods
2.2.1 Sampling and DNA extraction
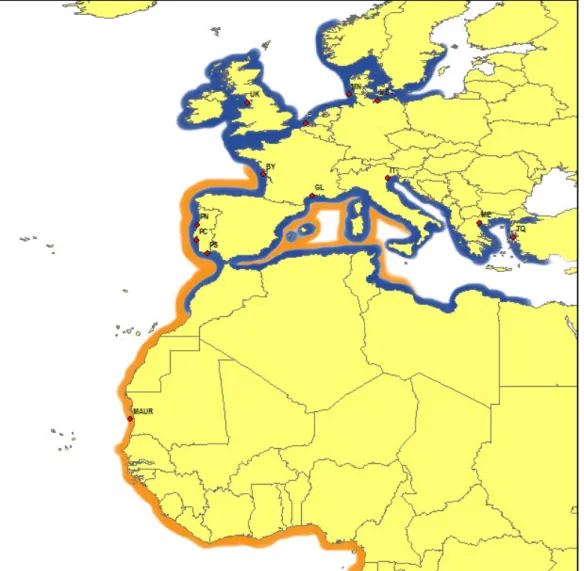
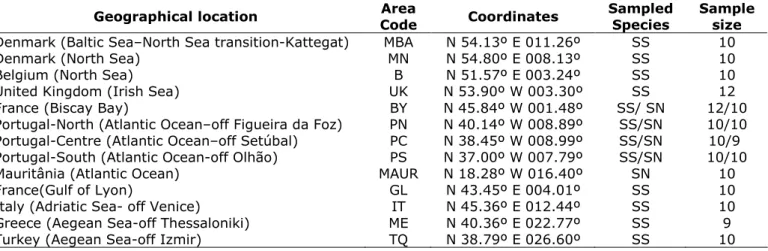
A total of 172 soles, belonging to both species, were collected from 13 different locations, covering their distribution range, from the Baltic Sea to the Mauritanian coast, and throughout the Mediterranean Sea (Figure 1). The number of individuals analysed for each species and the location of sampling areas are presented in Table 1.
Fig. 1- Sampling areas for each species analysed in this study and their distribution range (blue – S. solea; orange – S. senegalensis). Codes of sampling areas are defined in Table 1.
Table 1- Geographic location of the sampling areas, their codes, species sampled and number of individuals collected in each area (SS - Solea solea; SN - Solea senegalensis).
Geographical location Area
Code Coordinates
Sampled Species
Sample size Denmark (Baltic Sea–North Sea transition-Kattegat) MBA N 54.13º E 011.26º SS 10
Denmark (North Sea) MN N 54.80º E 008.13º SS 10
Belgium (North Sea) B N 51.57º E 003.24º SS 10
United Kingdom (Irish Sea) UK N 53.90º W 003.30º SS 12 France (Biscay Bay) BY N 45.84º W 001.48º SS/ SN 12/10 Portugal-North (Atlantic Ocean–off Figueira da Foz) PN N 40.14º W 008.89º SS/SN 10/10 Portugal-Centre (Atlantic Ocean–off Setúbal) PC N 38.45º W 008.99º SS/SN 10/9 Portugal-South (Atlantic Ocean-off Olhão) PS N 37.00º W 007.79º SS/SN 10/10 Mauritânia (Atlantic Ocean) MAUR N 18.28º W 016.40º SN 10
France(Gulf of Lyon) GL N 43.45º E 004.01º SS 10
Italy (Adriatic Sea- off Venice) IT N 45.36º E 012.44º SS 10 Greece (Aegean Sea-off Thessaloniki) ME N 40.36º E 022.77º SS 9 Turkey (Aegean Sea-off Izmir) TQ N 38.79º E 026.60º SS 10
Total genomic DNA was extracted from tissue samples (fin or muscle), following a phenol-chloroform protocol, as described by Wasko et al. (2003).
2.2.2 PCR amplification and sequencing
The entire cytochrome b (cyt b) mitochondrial DNA gene (about 1141 bp in length) was amplified by PCR, using two specific primers (Infante et al., 2004): GLU1 GGGGATTTTAACCTCAGGCGTTCAGTTTAC-3’) and Thr2 (5’-GGACTAATCGCTTGAAAAAACCACCGTTG-3’).
PCR reactions of 25 µl total volume, containing approximately 50 ng of template DNA, 2 mM of MgCl2, 0.2 µM of dNTP´s, 0.5 µM of each primer, 2
U of Taq DNA Polymerase (Fermentas) and 10x Taq buffer (10mM Tris-HCl, ph 9.0; 50 mM KCl) (Fermentas), were conducted as follows: an initial preheat step at 92ºC for 120s, followed by 5 cycles of denaturing at 92ºC for 15s, annealing at 51ºC for 45s and extension at 72ºC for 90s, and 30 cycles of denaturing at 92ºC for 15s, annealing at 52ºC for 45s and extension at 72ºC for 90s, finishing with an extension step at 72ºC for 7 min.
PCR products were subjected to electrophoresis in 1% agarose gels, containing ethidium bromide staining, and visualized under UV light. Products were then purified using 10 U of Exonuclease I (Fermentas), 1 U of Shrimp Alkaline Phosphatase (SAP) (Fermentas), and 6.25x SAP buffer (Fermentas). The protocol for purifying PCR products consisted of 30 min at 37ºC, 15 min at 80ºC and 5 min at 12ºC. All products were sequenced in both directions, using the PCR primers and the BigDye Terminator Cycle Ready reaction Kit (Applied Biosystems), and visualized in an AbiPrism 377 Automated Sequencer (Applied Biosystems) (Stabvida®).
2.2.3 Sequence alignment
Contiguous sequences were assembled in Sequencher ver. 4.0 (GeneCodes Corp.) and compared to similar sequences deposited in GenBank, using the Basic Local Alignment Search Tool (BLAST) available on the NCBI website (NCBI, http://www.ncbi.nlm.nih.gov/Genbank). All sequences were aligned using Sequencher ver. 4.0 (GeneCodes Corp.) and checked by eye.
2.2.4 Population genetic analysis
Intrapopulation diversity was analysed by estimating gene diversity (h), and nucleotide diversity (π) (Nei, 1987), using DNASP ver. 4.10.9 (Rozas et al., 2003). Population structure and genetic variation were characterised by Φ–statistics (analogous to the F- Statistics of Wright (1969)), which incorporate genetic distance between haplotypes and haplotipic frequencies, using Arlequin ver. 3.11 (Excoffier et al., 2005). The software Modeltest 3.7 (Posada & Crandall, 1998) was used to find the best model of evolution that fitted the data, according with the AKAIKE criterion. Although resultant models were different for both species (GTR+I+G - general time reversible plus Proportion invariant plus Gamma, for S. solea, and GTR- general time reversible for S. senegalensis) the pairwise distance method, with γ = 0,
was considered for both species analyses, since the resultant models were not included in Arlequin v. 3.11.
Analysis of molecular variance (AMOVA) was used to assess the population configuration and the geographical pattern of population subdivision (Excoffier et al., 1992). For hierarchical analyses, populations were grouped according to their geographic location. Several other rearrangements were tested and the one that maximised among group variation (θCT) was
assumed to be the most probable subdivision. Simulations with 1000 permutations were made to test the statistic significance of results. The isolation by distance (IBD) model was analysed by testing the association between geographic and genetic distances (Smouse et al., 1986) through a Mantel test (Mantel, 1967) with 10 000 permutations, as implemented in Arlequin ver. 3.11. Geographical distances between populations were measured as a straight line along the coast between each two areas. A standard Bonferroni a posteriori correction was applied to determine the level of significance in multiple tests.
Minimum spanning networks (using the median joining agglomeration method) were constructed with Network ver. 4.201 (Bandelt et al., 1999) based on haplotype data of the sampled populations, and generated with MacClade 4.08 (Maddison & Maddison, 1989). Network ver. 4.201 uses the maximum parsimony method for reconstructing trees, choosing the smallest and simplest as the best. Median-joining algorithm was used with default parameters, as recommended for this kind of data (Bandelt et al., 1999).
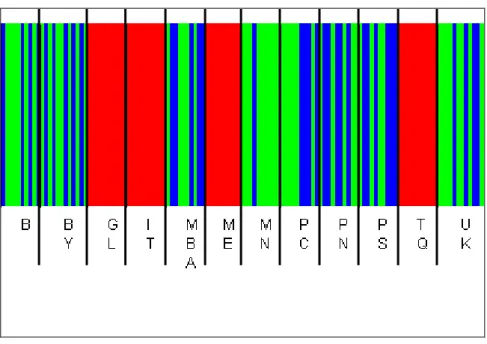
The population structure was also investigated using the program BAPS 4.1 (Corander et al., 2007), which allows the analysis of sequence data. Given a maximum value of partitions, the algorithm uses a stochastic optimization procedure to find the clustering solution with the highest ‘marginal likelihood’ of K (i.e., an approximation of the most probable number of differentiated genetic populations conditional on observed data). The maximum number of partitions, K, was set as ranging from 5 to 20 (S. senegalensis) and from 12 to 20 (S. solea) and, in each case, we the
analyses were ran several times, recording the best partition found and the corresponding ‘marginal likelihood’.
2.2.5 Neutrality and demographic history
Arlequin ver. 3.11 was used to test for departures from mutation-drift equilibrium with Tajima’s D-test (Tajima, 1989) and Fu’s Fs (Fu, 1997). In a constant-size neutral equilibrium population, Tajima's D is expected to be nearly zero, and when some kind of balancing selectionis acting Tajima's D tends to be positive. However, changes in population size can also affect Tajima'sD and, therefore, in a population with decreasing size, Tajima's D is expected to be positive, while a negative Tajima's D is predicted for a population with increasing size. Fu's Fs statistics also provide a test for population growth. Negative Fs values may indicate the existence of an excess of rare alleles, which can be explained by an excess of recent mutation, and processes like growth of effective populational size or hitchhiking, occurred in the past, can also be evidenced by the values of this statistic (Fu, 1997). The relationship between nucleotide (π) and haplotype (h) diversities can also provide some information on history of populations (Grant & Bowen, 1998).
Demographic history of the two species was also studied by analysing mismatch distributions of pairwise differences between all individuals of each population using Arlequin ver. 3.11. These analyses allowed the discrimination of a rapid population expansion (possibly after a bottleneck) or a state of stability over time. The mismatch distribution appears like a Poisson curve (unimodal), if accumulation of new mutations is greater than the loss of variation through genetic drift (resulting in population expansion), or multimodal if the generation of new mutations is offset by random genetic drift, maintaining population size (Rogers & Harpending, 1992).
2.3 Results
2.3.1 Solea solea
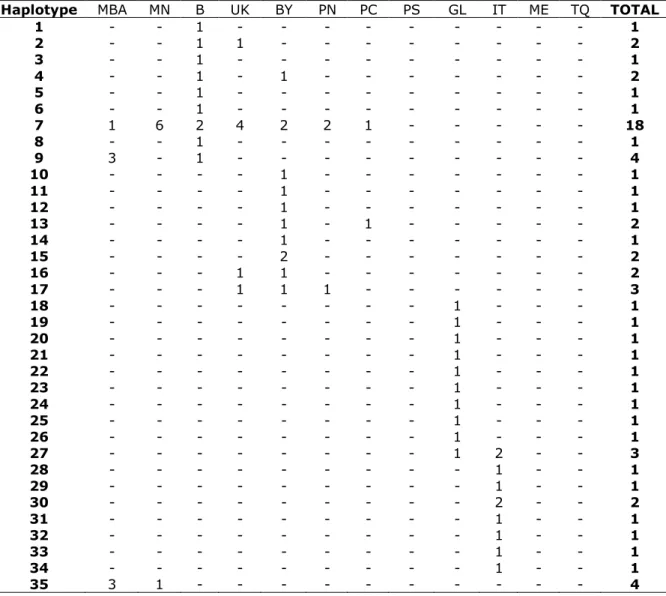
Genetic diversity was very high, with 75 haplotypes recovered from 123 individuals. Of these, 77% were unique. The most common haplotype, H7 (15% of the samples) was shared by 18 individuals from Northeast (NE) Atlantic populations (B, BY, MBA, MN, PC, PN and UK), and did not included any of the Mediterranean populations. Moreover, no haplotypes were shared between individuals from NE Atlantic and Mediterranean populations. The second major common haplotype, H38, was shared by 10 individuals, all from Mediterranean populations (ME and TQ) (Table 2).
Table 2- Haplotype frequencies and composition of Solea solea populations.
Haplotype MBA MN B UK BY PN PC PS GL IT ME TQ TOTAL
1 - - 1 - - - - - 1 2 - - 1 1 - - - - 2 3 - - 1 - - - - - 1 4 - - 1 - 1 - - - 2 5 - - 1 - - - - - 1 6 - - 1 - - - - - 1 7 1 6 2 4 2 2 1 - - - 18 8 - - 1 - - - - - 1 9 3 - 1 - - - - - 4 10 - - - - 1 - - - 1 11 - - - - 1 - - - 1 12 - - - - 1 - - - 1 13 - - - - 1 - 1 - - - 2 14 - - - - 1 - - - 1 15 - - - - 2 - - - 2 16 - - - 1 1 - - - 2 17 - - - 1 1 1 - - - 3 18 - - - - - - 1 - - - 1 19 - - - - - - 1 - - - 1 20 - - - - - - 1 - - - 1 21 - - - - - - 1 - - - 1 22 - - - 1 - - - 1 23 - - - 1 - - - 1 24 - - - 1 - - - 1 25 - - - 1 - - - 1 26 - - - 1 - - - 1 27 - - - 1 2 - - 3 28 - - - 1 - - 1 29 - - - 1 - - 1 30 - - - 2 - - 2 31 - - - 1 - - 1 32 - - - 1 - - 1 33 - - - 1 - - 1 34 - - - 1 - - 1 35 3 1 - - - 4
Table 2- continued
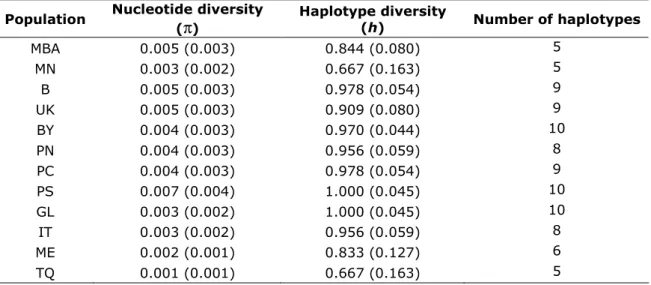
The overall level of haplotype diversity (h) was high, ranging from 0.667 in the North Sea (MN) and Turkey (TQ) populations, to 1.000 in Portugal-South (PS) and Gulf of Lyon (GL) populations. On the other hand, nucleotide diversity (π) exhibited by all populations was low, ranging from 0.001 in Turkey (TQ) to 0.007 in Portugal-South (PS). The number of haplotypes presented by each population varied, ranging from 5 in the Baltic Sea (MBA), North Sea (MN) and Turkey (TQ) populations to 10 in Bay of Biscay (BY), Portugal-South (PS) and Gulf of Lyon (GL) (Table 3).
Haplotype MBA MN B UK BY PN PC PS GL IT ME TQ TOTAL
36 2 - - - 1 - - - - 3 37 1 - - - 1 - - - - 2 38 - - - 4 6 10 39 - - - 1 - 1 40 - - - 1 - 1 41 - - - 1 - 1 42 - - - 1 1 2 43 - - - 1 - 1 44 - 1 - - - 1 45 - 1 - - - 1 46 - 1 - - - 1 47 - - - 2 - - - 2 48 - - - 1 - - - 1 49 - - - 1 - - - 1 50 - - - 1 - - - 1 51 - - - 1 - - - 1 52 - - - 1 - - - 1 53 - - - 1 - - - 1 54 - - - 1 - - - 1 55 - - - 2 - - - 2 56 - - - 1 - - - 1 57 - - - 1 - - - 1 58 - - - 1 - - - 1 59 - - - 1 - - - 1 60 - - - 1 - - - - 1 61 - - - 1 - - - - 1 62 - - - 1 - - - - 1 63 - - - 1 - - - - 1 64 - - - 1 - - - - 1 65 - - - 1 - - - - 1 66 - - - 1 - - - - 1 67 - - - 1 - - - - 1 68 - - - 1 1 69 - - - 1 1 70 - - - 1 1 71 - - - 1 - - - 1 72 - - - 1 - - - 1 73 - - - 1 - - - 1 74 - - - 1 - - - 1 75 - - - 1 - - - 1
Table 3- Genetic diversity of cyt b sequences for Solea solea populations (standard deviation is presented between brackets).
Population Nucleotide diversity (π) Haplotype diversity (h) Number of haplotypes MBA 0.005 (0.003) 0.844 (0.080) 5 MN 0.003 (0.002) 0.667 (0.163) 5 B 0.005 (0.003) 0.978 (0.054) 9 UK 0.005 (0.003) 0.909 (0.080) 9 BY 0.004 (0.003) 0.970 (0.044) 10 PN 0.004 (0.003) 0.956 (0.059) 8 PC 0.004 (0.003) 0.978 (0.054) 9 PS 0.007 (0.004) 1.000 (0.045) 10 GL 0.003 (0.002) 1.000 (0.045) 10 IT 0.003 (0.002) 0.956 (0.059) 8 ME 0.002 (0.001) 0.833 (0.127) 6 TQ 0.001 (0.001) 0.667 (0.163) 5
From all the tested rearrangements (see Tables I and II of results in Annex, page i), the one considering the existence of two groups, one including NE Atlantic populations and another including Mediterranean populations, was the combination that maximised the among group variation (θCT=0.485; P<0.001) (Table 4), therefore being assumed as the
most probable genetic subdivision.
Table 4- Results of the AMOVA performed for Solea solea, considering two groups (Atlantic and Mediterranean).
Source of variation Total variance (%) Fixation indices P value Among groups 48.5 θCT=0.485 <0.001
Among populations within groups 4.31 θSC=0.084 <0.001
Within populations 47.19 θST=0.528 <0.001
Low ΦST values were found in all pairwise analyses within the NE Atlantic
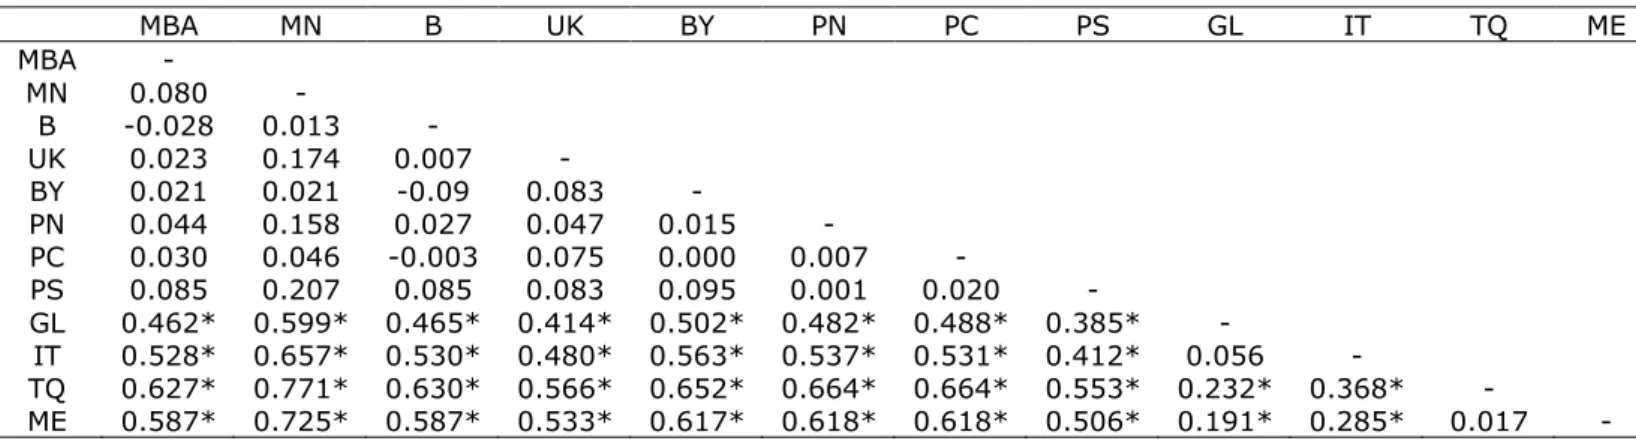
populations, while those obtained between the group of NE Atlantic populations and the group of Mediterranean populations were high (0.385-0.725) and significant (P<0.001), after the Bonferroni correction being applied. High and significant ΦST values (0.191-0.368; P<0.001) were also
obtained by pairwise analysis between Western (GL and IT) and Eastern (ME and TQ) Mediterranean populations (Table 5).