Phragmites australis
in a Mosaic of Saline Habitats in the
Yellow River Delta, China
Lexuan Gao1, Shaoqing Tang2, Liqiong Zhuge2, Ming Nie3, Zhu Zhu1*, Bo Li1, Ji Yang1,3
1Center for Evolutionary Biology and Institute of Biodiversity Science, Fudan University, Shanghai, China,2College of Life Sciences, Guangxi Normal University, Guilin, China,3Center for Watershed Ecology, Nanchang University, Nanchang, China
Abstract
Determination of spatial genetic structure (SGS) in natural populations is important for both theoretical aspects of evolutionary genetics and their application in species conservation and ecological restoration. In this study, we examined genetic diversity within and among the natural populations of a cosmopolitan grassPhragmites australis(common reed) in the Yellow River Delta (YRD), China, where a mosaic of habitat patches varying in soil salinity was detected. We demonstrated that, despite their close geographic proximity, the common reed populations in the YRD significantly diverged at six microsatellite loci, exhibiting a strong association of genetic variation with habitat heterogeneity. Genetic distances among populations were best explained as a function of environmental difference, rather than geographical distance. Although the level of genetic divergence among populations was relatively low (F’ST= 0.073), weak but significant genetic differentiation, as well as the concordance between ecological and genetic landscapes, suggests spatial structuring of genotypes in relation to patchy habitats. These findings not only provided insights into the population dynamics of common reed in changing environments, but also demonstrated the feasibility of using habitat patches in a mosaic landscape as test systems to identify appropriate genetic sources for ecological restoration.
Citation:Gao L, Tang S, Zhuge L, Nie M, Zhu Z, et al. (2012) Spatial Genetic Structure in Natural Populations ofPhragmites australisin a Mosaic of Saline Habitats in the Yellow River Delta, China. PLoS ONE 7(8): e43334. doi:10.1371/journal.pone.0043334
Editor:Giovanni G. Vendramin, CNR, Italy
ReceivedJanuary 10, 2012;AcceptedJuly 19, 2012;PublishedAugust 16, 2012
Copyright:ß2012 Gao et al. This is an open-access article distributed under the terms of the Creative Commons Attribution License, which permits unrestricted use, distribution, and reproduction in any medium, provided the original author and source are credited.
Funding:This work was supported by the National Basic Research Program of China (2006CB403305) and the National Natural Science Foundation of China (91131901). The funders had no role in study design, data collection and analysis, decision to publish, or preparation of the manuscript.
Competing Interests:The authors have declared that no competing interests exist.
* E-mail: [email protected]
Introduction
Spatial configuration of suitable environments for organisms is often patchily structured at various scales, from biogeographic regions to local environments within a landscape [1,2,3,4]. Diverse patches of habitat created by natural disturbances have profound influences on ecological and evolutionary processes across scales [2,4,5,6,7,8,9]. The population structure and dynamics of species in patchy environments depend on the spatial arrangement and heterogeneity of habitats [2,8,9,10,11,12,13,14,15].
Numerous studies have revealed the role of environmental patchiness in generating spatial genetic structure (SGS) in natural populations [10,16,17,18,19,20,21,22,23]. SGS, i.e. non-random spatial distribution of genotypes and alleles, can result from different processes, including restricted gene dispersal, genetic drift, and micro-environmental selection [22,24,25]. Understanding the processes underlying population structure and its relationships with habitat structure and heterogeneity can not only help reveal the potential driving forces promoting population divergence and adaptation, but may also contribute to the prediction of how populations will respond to changing environments, which is important for both conservation and restoration efforts.
The Yellow River Delta (YRD) lies in the eastern coastal area of China, which is formed by sediment deposition of the Yellow River [26]. Due to on-going aggradation, the delta at the
mouth of the river is still expanding at about 20 km2 of new land created each year [27,28,29]. The YRD has a monsoon climate of the warm-temperate zone with mean annual temperature of 11.7–12.6uC. The mean annual precipitation is 530–630 mm, while the mean annual evaporation is 1750– 2430 mm [30]. The excess evaporation from soil, together with seawater encroachment, has led to serious soil salinization in this region [31,32]. The lowland reaches of the Yellow River are highly unstable, which has changed its route more than 10 times since 1855 [33]. The course shifts of the lower Yellow River not only gave rise to the formation of new delta lobes along the coast, but also significantly influenced the depth of ground water table and the quality of ground water (i.e. proportion of salty to fresh water) via lateral seepage in areas at both sides of the river channel. As the result of the joint effect of Yellow River lateral seepage and seawater intrusion, a mosaic of contrasting environments that differ in soil salinity was generated in the YRD region, which exerts profound influence on the growth and adaptation of organisms living in this area [34,35].
soil salinity [37,38]. Population genetic patterns of common reed have been investigated at different scales [39,40,41,42,43,44,45,46,47]. Salt tolerance of the reed has also been assessed in several studies [48,49,50,51]. However, pre-vious studies were mostly focused on detection of genetic relationships between populations distributed across different ecological and geographic areas, to explore historical events of long-distance migration and invasion. Few studies have sampled extensively from adjacent sites to specifically examine micro-geographic genetic structure. Less is known about how contemporary factors such as habitat heterogeneity impact local population structure and dynamics in common reed.
Populations occupying adjacent but contrasting habitats in the YRD present distinct advantages for assessing the effects of spatial environmental heterogeneity in relation to soil salinity on population genetic dynamics of the reed. In this study, we examined the level of genetic variation within and among the reed populations in the YRD, using microsatellite (also known as Simple Sequence Repeat, SSR) markers. By exploring the correlation between genetic diversity and environmental hetero-geneity, we sought to determine whether patchy habitats have structured patchily distributed populations in this area, to assess the effect of the spatial arrangement of habitat patches on the genetic structure of common reed in the YRD. We also aimed to address the feasibility of using patchy habitats as test systems to evaluate the potential for plants to adapt dynamically to changing environments, which is vitally important for selecting appropriate plant materials for ecological restoration [52].
Materials and Methods
Study Area and Sampling
This study was conducted over an area of approximately 6622 km2in the YRD (Fig. 1). Local-scale variation of soil salinity was assessed based on a square grid sampling design [53]. A total of 219 points were systematically selected at the centers of 5 km square grids, each of which corresponded to one sample with 25 km2. At each site 3–6 soil samples were collected. The soil samples were taken to the laboratory for measuring saturated paste conductivity (ECe) by using 1/5 diluted extracts (the electrical conductivity (EC) of 1:5 soil-water extract) [54]. The distribution map of soil salinity (ECe) was created using the ordinary kriging (OK) interpolation technique. According to the soil salinity classes proposed by Richards [55], ECe ranges of,4, 4–8, 8–16, 16–32 and .32 dS/m corresponded to non-saline, slightly saline, mediately saline, highly saline and extremely saline, respectively [54].
Since the YRD has been exploited on a large scale, with many areas in this ecoregion being converted to agricultural or other land uses, a total of 27 sites across the YRD region, with relatively little human disturbance and more than 30 visibly separated patches of common reed, were selected for sampling. The location information and soil salinity of each site are shown in Table 1. The common reed can reproduce both clonally through rhizome growth and sexually through wind-pollinated seeds. To decrease the likelihood of sampling clone-mates, each sample (28 to 30 per population) was collected from distinct patches that were separated by a minimum distance of 3 m at each site. Three additional
non-Figure 1. Schematic map showing sampling localities and the tendency of soil salinity based on OK predictions.Pie graphs show the frequency distribution of the 203(PaGT9) homozygote and other allelic phenotypes in different populations.
saline sites surrounding the YRD: SXTY (E112u339 N37u529), HBHH (E113u289N29u489) and JSSZ (E120u359N31u179), were also included in the study for collecting plant materials for comparative analysis. For each population, 28–30 leaf samples were collected and stored in silica gel until DNA extraction and genotyping.
SSR Analysis
Total genomic DNA was extracted following the CTAB extraction protocol [56]. Six microsatellite loci (PaGT4, PaGT8, PaGT9, PaGT11, PaGT14 and PaGT16) were used to assess the genetic diversity and structure of 30 common reed populations, using primers developed by Saltonstall [45] (Table 2). The PCR reactions were carried out in a total volume of 20ml containing 16PCR buffer, 0.2 mM dNTPs, 6 pmol of each forward and reverse primer, 20 ng of genomic DNA, and 0.5 U Taq poly-merase (TAKARA). Reactions were run in an Eppendorf Mastercycler using the following program: an initial denaturation at 94uC for 6 min, followed by 35 cycles of 94uC for 30 s, 53–58uC
for 30 s and 72uC for 4 s, and a final extension at 72uC for 2 min. The amplified products were resolved on 6% polyacrylamide sequencing gels and silver stained according to the protocol described by Bassam et al. [57].
Analysis of Genetic Diversity
Due to the polyploid nature of the common reed, several microsatellite DNA alleles might simultaneously occur at a single locus. Even if only two alleles were detected at a single locus, the allelic configurations might also be greatly variable among individuals as each allele can be present in more than one copy. Considering the difficulties in assessing the actual genotype of each individual based on band intensity and accurately estimating the number of copies of an allele in heterozygous individuals, the banding patterns observed at each polymorphic locus were recorded as ‘allelic phenotypes’ [45,58] in this study. Each phenotype scored alleles as present or absent, regardless of allele dosage (allele frequency). This may result in underestimation of genetic variation present but avoids overestimating genetic di-versity as a result of incorrectly calculating the number of alleles [59]. For each polymorphic locus, the number of alleles (Ao) and allelic phenotypes (Po) were counted. We compared multilocus allele phenotypes found within and among populations to identify samples with identical genetic phenotypes. Repeated phenotypes within populations were assumed to result from asexual re-production (ramets of a single genet.) and thus excluded from analyses of genetic diversity and differentiation because repeated sampling of a single clonal individual can unduly influence estimates of the distribution of genetic variation [59]. Two genetic-differentiation statistics based on allelic phenotype data were calculated using the program F-DASH (1000 permutations) [60]. Within-population genetic diversity was estimated using a simple allele phenotype diversity statistic (H’) based on the average number of unshared alleles between pairs of individuals. Genetic differences between populations were measured withF’ST based on the proportion of genetic variance among populations relative to the total genetic diversity. The Bayesian method, implemented in HICKORY version 1.1 [61], was also used to estimate the heterozygosity within each population (hs) and the level of genetic differentiation among populations (hII
). Computations were carried out using the default values, as recommended in the manual [61].
Testing Effects of Ecogeographic Variables on Genetic Variation
Several complementary approaches were used to examine the correlations between genetic patterns, geographic distances, and soil property (salinity). We first examined the effects of geo-graphical location and habitat type on the levels of genetic variation in each population by regression analysis of genetic diversity characteristics (number of alleles, allelic phenotypes and allele phenotype diversity statistics) and their associations with latitude, longitude and soil salinity using SigmaStat 3.5 (Systat Software, Inc., CA, USA).
We then tested the correlation between genetic and geographic distances using the Mantel test [62], to investigate if the genetic differentiation in reed populations was independent of geographic distances. Population genetic distances were calculated using the program POPDIST [63]. Mantel tests were conducted using the NTSYSpc 2.0 software [64]. Significance was determined using 1000 permutations. The Bayesian model-based clustering method [65] implemented in STRUCTURE v2.2 [66,67,68] was also used to investigate population structure and infer the most likely number of populations in our sample. In this approach, multilocus Table 1.Sampling sites of the common reed in Yellow River
Delta.
Site
Sample
size Longitude Latitude
Soil salinity ECe (dS/m)
YJNH 29 118.39256 37.60591 4.52*
YJ44y 30 118.75068 37.74607 6.38*
YJ6 30 118.40399 37.47777 7.12*
YJ7 30 118.39628 37.53886 7.31*
YJ48 29 118.87539 37.74002 8.19**
YJ122 30 118.54735 37.63576 8.76**
YJ15 30 118.50631 37.56479 8.99**
YJ65 29 118.94426 37.88558 9.69**
YJ128 29 118.90295 37.71011 10.96**
YJ29 30 118.72592 37.58559 11.15**
YJ36 29 118.78371 37.64583 11.37**
YJ114 30 118.27461 37.92928 11.85**
YJ20 28 118.71681 37.51787 11.97**
YJ41 30 118.88227 37.62161 12.15**
YJ111 28 118.28079 38.00467 12.74**
YJ55 29 118.81202 37.90436 12.81**
YJ77 30 118.80450 38.01746 12.86**
YJ54 29 118.79557 37.87476 13.74**
YJ127 30 119.05893 37.86028 13.80**
YJ68 29 118.67387 37.89626 14.05**
YJ79 29 118.86720 38.01841 15.00**
YJ112 30 118.40862 38.00918 15.12**
YJ58 28 118.99667 37.90446 15.30**
YJ88 30 118.45609 37.91095 15.88**
YJ75 29 118.68672 38.01987 17.09***
YJ95 29 118.64481 37.91907 18.05***
YJ124 29 118.57326 37.88456 20.12***
Soil salinity class:
*slightly saline; **mediately saline; ***highly saline.
genotypic data were used to define a set of populations with distinct allele frequencies and to assign individuals probabilistically to them. We ran the analysis for up to 7 possible populations (K= 1–7) using the admixture model with correlated allele frequencies. We performed 5 independent runs for eachKvalue with 100 000 burn-ins and 100 000 iterations after burn-ins. The number of population groups best fitting our data set was defined byDKas suggested by Evanno et al. [69].
Finally, we conducted a spatial analysis to estimate the association between each allele and soil salinity using the program SAM [70,71]. This program works at the individual level and inspects correlations between each allele and the soil salinity by univariate logistic regression [71,72]. In this analysis, we recorded our data in a dominant way, with each allele at each locus coded as present or absent. The analysis thus directly links allele occurrence with environmental variables. Both statistical tests, the likelihood ratio test and the Wald test implemented in SAM, were used to assess the significance of coefficients calculated by the logistic regression model to ensure the robustness of the method.
Results
A total of 66 alleles were detected in 882 common reed individuals for the six polymorphic microsatellite loci. The number of alleles scored at each locus (Ao) varied from 5 (PaGT4) to 26 (PaGT14), with an average of 11 alleles. The number of allele phenotypes at a single locus (Po) ranged between 19 (PaGT11) and 228 (PaGT14) (Table 2). Two individuals from the population YJ20 were found to share the same multilocus allele phenotype, and one of them was thus excluded from the data matrix. The values ofAoand Pofor each population are shown in Table S1. Genetic diversity within populations (H’) ranged from 1.11 to 2.01 (Table S1). The overall population differentiation was
F’ST= 0.073.
Significant negative correlations were detected between soil salinity and mean observed number of alleles (Ao) (R2= 0.354,
P= 0.001), the observed number of allele phenotypes (Po) (R2= 0.259,P= 0.007), and the within-population genetic diversity statistics (H’) (R2= 0.312, P= 0.002) over six microsatellite loci (Fig. 2), suggesting a progressive reduction in genetic diversity along with increasing soil salinity in reed populations. The Bayesian estimates for within-population genetic diversity
exhib-ited a similar negative correlation with soil salinity (R2= 0.599,
P,0.001) (Fig. S1). We also compared the allelic diversity among population groups occupying non-saline, slightly saline, and highly saline habitats, respectively. The results showed that the values of
Ao, Po, and H’ of populations from non- and lower saline environments were clearly higher than those of populations from highly saline habitats (Fig. S2, Table S2), which were consistent with the results of correlation analyses. However, the Mantel test demonstrated no significant correlation between genetic and spatial distances of different populations (P= 0.57) (Table S3), indicating that the genetic differentiation in reed populations was independent of the geographic distance.
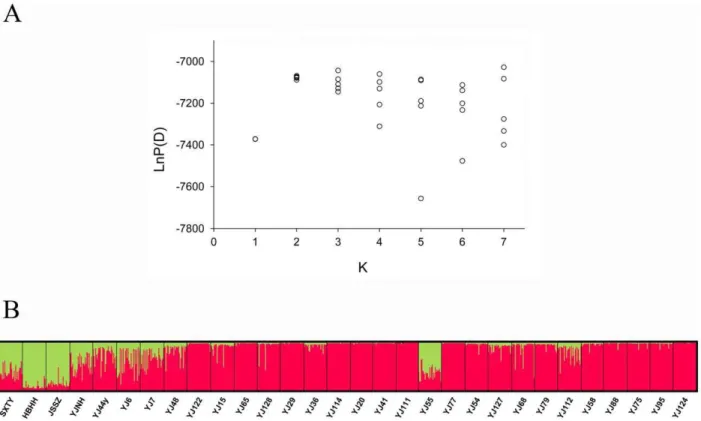
According to LnP(D) andDKvalues, two clusters (K= 2) best fit the dataset, indicating that two genetically distinctive population groups existed in common reed populations. The clustering of individuals into two groups based on genetic landscapes suggested a division of sample sites into saline and non-saline habitats. Grouping of individuals by geographical location (populations), however, showed high levels of population admixture, as most populations consisted of individuals from different clusters (Fig. 3). Using the program SAM, we tested for the association between allelic frequency and soil salinity in natural populations of common reed, and identified 3 alleles as significant with both Wald and likelihood ratio G tests, with a significance level being 5.05 e206 (corresponding to a 99% confidence level including Bonferroni correction) (Table S4). Because of the polyploid nature of the common reed, it was difficult to get an accurate estimation of the frequencies of these alleles in natural populations. Instead, we calculated the frequencies of heterozygous and homozygous individuals with these alleles in different populations, and found a significant positive correlation between the 203(PaGT9) frequen-cy and the soil salinity of sampling sites, with the frequenfrequen-cy of the 203(PaGT9) homozygote increasing from 3.4% for the lowest saline population (YJNH) to 69.0% for the highest saline population (YJ124) (R2= 0.387,P,0.001) (Fig. 4).
Discussion
Despite their close geographic proximity, the common reed populations in the YRD significantly diverged in overall genetic diversity within population, and in allele frequencies at six microsatellite loci. The YRD common reed populations exhibited Table 2.Primer sequences and allelic diversity information for six microsatellite loci of the common reed.
Locus Primer sequences (59–39)
Maximum no. alleles per sample
Allele size range (bp)
Total no. alleles
Total no. allele phenotypes
PaGT4 F: TGCTCCCTGCCAGTTTCTTG 4 266–278 5 23
R: TATCCACCCTTCGAAGGCAC
PaGT8 F: TCTGAACATAATCCTGGTGG 4 171–191 7 39
R: TCTGTGTGAAGCAGTTCTGC
PaGT9 F: CCATGTGTTAATGTTGTCC 4 187–213 11 102
R: ATTGAATCCACACGTTTCCG
PaGT11 F: CAACTCCGTGAATGACATGC 4 141–151 6 19
R: CAGTTTGTGCACTAATGGAC
PaGT14 F: GTTGCAGCAAGTATTTGG 5 166–222 26 228
R: CAAGCATTCTAGTAGTAGC
PaGT16 F: ACCAATCAGTCAGACTAGCC 3 232–292 11 39
R: GTTCTCATGTTGGAGAAGCC
a strong association of genetic variation with environmental heterogeneity, i.e. the salinity differences of different habitats, independent of geographical distance. Although the level of genetic divergence among populations was relatively low (F’ST= 0.073), weak but significant genetic differentiation, as well as the concordance between ecological and genetic landscapes, suggested some degree of population structuring of the common reed in the YRD.
Several alternative scenarios may explain the pattern of genetic variation observed in common reed. First, patchy habitats might have restricted pollen and seed dispersal, leading to spatial genetic structure [73]. Second, past colonization events and/or recent range expansions were accompanied by founder effects and genetic drift, resulting in an accumulation of rare alleles and a reduction in genetic diversity in local populations [74,75]. Finally, distinct environmental optima affecting fitness caused
structure as populations diverged [8,24,76]. By comparing the allelic diversity of different reed populations, we found that most frequent alleles were shared among populations. Subsequent STRUCTURE analysis further suggested the high levels of population admixture, indicating a common source population for the reed populations in the YRD or extensive gene flow/ migration among populations. Limited dispersal thus seems not to be a likely scenario leading to the spatial genetic structure in the reed populations in the YRD.
The Yellow River Delta is an ecoregion with heterogeneous and changing environments. Organisms living in this area have been subject to spatial and temporal variation in habitat suitability. To track the changing distribution of suitable environments, range expansion through frequent colonization of new sites has occurred recurrently in the history of most species. Strong genetic drift may be associated with range expansions, generating genetic patterns in allele frequencies that are quite different from what is expected in equilibrium populations [74]. Genetic diversity can be reduced in expanding populations as only a few individuals contribute genetic variation to the newly colonized populations [75,77]. In contrast, some alleles may reach a high frequency because of repeated founder events [78], a process called genetic surfing [79]. Genetic differentiation may thus be produced among newly formed populations by intense genetic drift during population expansion [75,79,80]. In this study, we found that some allele phenotypes were shared among populations. Most populations were admixed and consisted of allele phenotypes from multiple populations, probably suggesting multiple founder events. Decline in genetic diversity was also detected in some populations, with the frequency of a specific allele increasing significantly. We thus cannot rule out the role for demographic history in shaping the genetic differences between reed populations. However, the strong concordance between patterns of genetic and ecological variations also dropped a hint of the potential role of habitat heterogeneity in driving population divergence.
Spatial variation in the environment may affect genetic variation in populations living there [76]. Population dynamics of patchily distributed species are affected by density-independent environmental fluctuations [81]. The genetic structure of popula-tions is not always reflected in the geographical proximity of individuals, and individuals with different geographical locations are not necessarily genetically differentiated [69]. We showed in this study that, within the environmental mosaics in the YRD, the common reed populations displayed a mosaic pattern of genetic differentiation. The overall genetic diversity within populations decreased progressively along with the increasing soil salinity. The locusPaGT9 exhibited an elevated variation among populations exceeding neutral expectations, with the allele 203(PaGT9) showing a significantly higher frequency in saline habitats than in other sites. The genetic distances between reed populations in the YRD were best explained as a function of environmental differences, rather than geographical distance. Both reduction in genetic diversity and the increase in allele frequency could arise as results of chance for sexual reproduction involving a limited number of genotypes during range expansion and subsequent limitation in seed dispersal. However, these patterns of genetic variation not only occurred at several separate sites in the YRD, but also covariated with environmental salinity. In addition, the large population sizes of common reed at our study sites and the high levels of gene flow among populations should greatly reduce the likelihood of genetic surfing during range expansion. Therefore, genetic divergence among reed populations in the YRD is unlikely to be driven by strictly neutral processes. The correspondence between ecological and genetic landscapes may be Figure 2. Correlation between soil salinity and population
indicative of the potential role of environmental variables in driving population divergence [82,83,84,85].
Correlations between phenotype and environment may be mirrored at the level of individual genetic polymorphisms. A powerful way to detect the footprint of selection in natural situations is to associate allele frequency with environmental variations. A number of previous studies have shown that there is
a correlation between genetic diversity and environmental heterogeneity in common reed populations [86,87,88,89], but very few studies have explicitly tested the causal environmental factors behind the pattern of genetic variation. This situation is largely due to the fact that environmental heterogeneities were mostly ill-defined in the earlier studies, leading to the uncertainty in selective agent predictions. Spatial analysis of population genetic structure in mosaic environments, from the perspective of landscape genetics, can not only help reveal the potential of dynamic adaptation of organisms to changing environments, but may also contribute to the identification of environmental factors that structure intraspecific genetic diversity, which are of interest for both conservation and ecological restoration. Although such an analysis may just represent the first step in the study of local adaptation, and the results alone are merely correlative, notde facto
evidence of adaptive differentiation, it is efficient to identify subtle population structure and concomitant environmental variation representative of a potential selection gradient, to facilitate a further analysis and test of adaptation [90]. In conclusion, our findings not only provided insights into the population dynamics of common reed in changing environments, but also demonstrated the feasibility of using habitat patches in a mosaic landscape as test systems to identify appropriate genetic sources for ecological restoration.
Supporting Information
Figure S1 Correlation between soil salinity and the heterozygosity of each population (h
s) estimated with Hickory v1.1.
(TIF)
Figure 3. Estimated population structure for common reed from STRUCTURE analysis.(A) Plot of the log probability of the data [LnP(D)] given values for K from 1 to 7. Circles represent the likelihood values of 5 replicate runs at each K value. (B) Population clustering for K = 2. Each individual is represented by a thin vertical line, which is partitioned into K coloured segments that represent the individual’s estimated membership fractions. Black lines separate individuals from different sampling sites, which are labelled below the figure.
doi:10.1371/journal.pone.0043334.g003
Figure 4. Correlation between the frequency of the 203(PaGT9) homozygote and soil salinity, showing the increasing tendency of the 203(PaGT9) homozygote in populations inhabiting saline habitats in YRD.
Figure S2 Comparisons of genetic diversity among the common reed populations from different salinity envir-onments.Ao: observed number of alleles;Po: observed number of allele phenotypes;H’: allele phenotype diversity statistic based on the average number of unshared alleles between pairs of individuals.
(TIF)
Table S1 Genetic characteristics of the common reed populations from YRD based on six microsatellite loci. (XLSX)
Table S2 Comparisons of genetic diversity among common reed populations from different salinity envir-onments based on six microsatellite loci.
(XLSX)
Table S3 Mantel tests for the correlation between geographical and genetic distances.
(XLSX)
Table S4 Results of the spatial analysis using the program SAM, with significance level of (a) 5.05E-05; and (b) 5.05E-06 (corresponding to a 99% confidence level including Bonferroni correction).
(XLSX)
Acknowledgments
We are grateful to Ms. Ting-Ting Zhang for her experimental assistance in measuring soil salinity.
Author Contributions
Conceived and designed the experiments: LG ZZ BL JY. Performed the experiments: LG ST LZ MN. Analyzed the data: LG ZZ JY. Wrote the paper: LG ZZ BL JY.
References
1. Bond NR, Perry GLW, Downes BJ (2000) Dispersal of organisms in a patchy stream environment under different settlement scenarios. J Anim Ecol 69: 608– 619.
2. Fahrig L (1992) Relative importance of spatial and temporal scales in a patchy environment. Theor Popul Biol 41: 300–314.
3. Opdam P, Wascher D (2004) Climate change meets habitat fragmentation: linking landscape and biogeographical scale levels in research and conservation. Biol Conserv 117: 285–297.
4. Wiens JA (1976) Population responses to patchy environments. Annu Rev Ecol Syst 7: 81–120.
5. Brawn JD, Robinson SK, Thompson FR (2001) The role of disturbance in the ecology and conservation of birds. Annu Rev Ecol Syst 32: 251–276. 6. Brown BL (2007) Habitat heterogeneity and disturbance influence patterns of
community temporal variability in a small temperate stream. Hydrobiologia 586: 93–106.
7. Flather CH, Bevers M (2002) Patchy reaction-diffusion and population abundance: the relative importance of habitat amount and arrangement. Am Nat 159: 40–56.
8. Sambatti JBM, Rice KJ (2006) Local adaptation, patterns of selection, and gene flow in the Californian serpentine sunflower (Helianthus exilis). Evolution 60: 696– 710.
9. Suzuki RO, Suzuki JI, Kachi N (2005) Change in spatial distribution patterns of a biennial plant between growth stages and generations in a patchy habitat. Ann Bot 96: 1009–1017.
10. Bomblies K, Yant L, Laitinen RA, Kim S-T, Hollister JD, et al. (2010) Local-scale patterns of genetic variability, outcrossing, and spatial structure in natural stands ofArabidopsis thaliana. PLoS Genet 6: e1000890.
11. Capelle J, Neema C (2005) Local adaptation and population structure at a micro-geographical scale of a fungal parasite on its host plant. J Evol Biol 18: 1445– 1454.
12. Cureton AN, Newbury HJ, Raybould AF, Ford-Lloyd BV (2006) Genetic structure and gene flow in wild beet populations: the potential influence of habitat on transgene spread and risk assessment. J Appl Ecol 43: 1203–1212. 13. Pfeifer M, Jetschke G (2006) Influence of geographical isolation on genetic
diversity ofHimantoglossum hircinum(Orchidaceae). Folia Geobot 41: 3–20. 14. Van Dongen S, Backeljau T, Matthysen E, Dhondt AA (1998) Genetic
population structure of the winter moth (Operophtera brumataL.) (Lepidoptera, Geometridae) in a fragmented landscape. Heredity 80: 92–100.
15. Williams BL, Brawn JD, Paige KN (2003) Landscape scale genetic effects of habitat fragmentation on a high gene flow species:Speyeria idalia(Nymphalidae). Mol Ecol 12: 11–20.
16. Alberto F, Arnaud-Haond S, Duarte CM, Serrao EA (2006) Genetic diversity of a clonal angiosperm near its range limit: the case ofCymodocea nodosaat the Canary Islands. Mar Ecol-Prog Ser 309: 117–129.
17. Bell DJ, Rowland LJ, Zhang D, Drummond FA (2009) Spatial genetic structure of lowbush blueberry,Vaccinium angustifolium, in four fields in Maine. Botany 87: 932–946.
18. Colling G, Hemmer P, Bonniot A, Hermant S, Matthies D (2010) Population genetic structure of wild daffodils (Narcissus pseudonarcissusL.) at different spatial scales. Plant Syst Evol 287: 99–111.
19. Gonzales E, Hamrick JL, Smouse PE, Trapnell DW, Peakall R (2009) The impact of landscape disturbance on spatial genetic structure in the guanacaste tree,Enterolobium cyclocarpum(Fabaceae). J Hered 101: 133–143.
20. Kettle CJ, Hollingsworth PM, Burslem D, Maycock CR, Khoo E, et al. (2011) Determinants of fine-scale spatial genetic structure in three co-occurring rain forest canopy trees in Borneo. Perspect Plant Ecol 13: 45–54.
21. Korpelainen H, von Crautlein M, Laaka-Lindberg S, Huttunen S (2011) Fine-scale spatial genetic structure of a liverwort (Barbilophozia attenuata) within a network of ant trails. Evol Ecol 25: 45–57.
22. Troupin D, Nathan R, Vendramin GG (2006) Analysis of spatial genetic structure in an expandingPinus halepensispopulation reveals development of fine-scale genetic clustering over time. Mol Ecol 15: 3617–3630.
23. Volis S, Zaretsky M, Shulgina I (2010) Fine-scale spatial genetic structure in a predominantly selfing plant: role of seed and pollen dispersal. Heredity 105: 384–393.
24. Kalisz S, Nason JD, Hanzawa FM, Tonsor SJ (2001) Spatial population genetic structure inTrillium grandiflorum: the roles of dispersal, mating, history, and selection. Evolution 55: 1560–1568.
25. Vekemans X, Hardy OJ (2004) New insights from fine-scale spatial genetic structure analyses in plant populations. Mol Ecol 13: 921–935.
26. Milliman JD, Meade RH (1983) World-wide delivery of river sediment to the oceans. J Geol 91: 1–21.
27. Chen XY, Chen SL, Yu HJ, Zhang JH, Xu CL (2005) Coastal profile types and evolution of the Yellow River Delta. Advances in Marine Science 23: 438–445. 28. Feng SZ, Liu JL, Lei N, Zhong DL (2006) A study of submarine topographical features and changes outside the Gudong embankment of Shengli oilfield. Hydrographic Surveying and Charting 26: 38–41.
29. Wang WZ, Zhang HX (2007) Evolution pattern of the Yellow River Estuary Coast. Yellow River 29: 27–32.
30. Zhao Y, Song C (1995) The Yellow River Delta National Nature Reserve. Beijing, China: Forestry Publishing House.
31. Fang HL, Liu GH, Kearney M (2005) Georelational analysis of soil type, soil salt content, landform, and land use in the Yellow River Delta, China. Environ Manage 35: 72–83.
32. Yao RJ, Yang JS, Liu GM, Zou P (2006) Spatial variability of soil salinity in characteristic field of the Yellow River Delta. Transactions of the CSAE 22: 61– 66.
33. Wang ZY, Cheng DS, Liu C (2006) Delta processes and management strategies in China II - the Yellow and Haihe River Deltas. J Sediment Res 1: 76–81. 34. He Q, Cui BS, Zhao XS, Fu HL (2008) Niches of plant species in wetlands of the
Yellow River Delta under gradients of water table depth and soil salinity. Ying Yong Sheng Tai Xue Bao 19: 969–75.
35. Sun JK, Li T, Xia JB, Tian JY, Lu ZH, Wang RT (2011) Influence of salt stress on ecophysiological parameters ofPeriploca sepiumBunge. Plant Soil Environ 57: 139–144.
36. Nie M, Xian NX, Fu XH, Chen XF, Li B (2010) The interactive effects of petroleum-hydrocarbon spillage and plant rhizosphere on concentrations and distribution of heavy metals in sediments in the Yellow River Delta, China. J Hazard Mater 174: 156–161.
37. Guo WH, Wang RQ, Zhou SL, Zhang SP, Zhang ZG (2003) Genetic diversity and clonal structure ofPhragmites australisin the Yellow River delta of China. Biochem Syst Ecol 31: 1093–1109.
38. Zhao KF, Feng LT, Zhang SQ (1999) Study on the salinity-adaptation physiology in different ecotypes ofPhragmites australisin the Yellow River Delta of China: osmotica and their contribution to the osmotic adjustment. Estuar Coast Shelf S 49 (suppl. A): 37–42.
39. Keller BEM (2000) Genetic variation among and within populations ofPhragmites australisin the Charles River watershed. Aquat Bot 66: 195–208.
40. Kirk H, Paul J, Straka J, Freeland JR (2011) Long-distance dispersal and high genetic diversity are implicated in the invasive spread of the common reed,
Phragmites australis(Poaceae), in northeastern North America. Am J Bot 98: 1180– 1190.
41. Koppitz H (1999) Analysis of genetic diversity among selected populations of
42. Lambertini C, Gustafsson MHG, Frydenberg J, Speranza M, Brix H (2008) Genetic diversity patterns inPhragmites australisat the population, regional and continental scales. Aquat Bot 88: 160–170.
43. Li M, Gong L, Tian Q, Hu L, Guo W, et al. (2009) Clonal genetic diversity and populational genetic differentiation in Phragmites australis distributed in the Songnen Prairie in northeast China as revealed by amplified fragment length polymorphism and sequence-specific amplification polymorphism molecular markers. Ann Appl Biol 154: 43–55.
44. Paul J, Kirk H, Freeland J (2011) Genetic diversity and differentiation of fragmented reedbeds (Phragmites australis) in the United Kingdom. Hydrobiologia 665: 107–115.
45. Saltonstall K (2003) Microsatellite variation within and among North American lineages ofPhragmites australis. Mol Ecol 12: 1689–1702.
46. Saltonstall K (2003) Genetic variation among north American populations of
Phragmites australis: implications for management. Estuaries 26: 444–451. 47. Saltonstall K, Lambert A, Meyerson LA (2010) Genetics and reproduction of
common (Phragmites australis) and giant reed (Arundo donax). Invasive Plant Sci Manage 3: 495–505.
48. Burdick DM, Buchsbaum R, Holt E (2001) Variation in soil salinity associated with expansion ofPhragmites australisin salt marshes. Environ Exp Bot 46: 247– 261.
49. Matoh T, Matsushita N, Takahashi E (1988) Salt tolerance of the reed plant
Phragmites communis. Physiol Plantarum 72: 8–14.
50. Mauchamp A, Mesleard F (2001) Salt tolerance inPhragmites australispopulations from coastal Mediterranean marshes. Aquat Bot 70: 39–52.
51. Vasquez EA, Glenn EP, Guntenspergen GR, Brown JJ, Nelson SG (2006) Salt tolerance and osmotic adjustment ofSpartina alterniflora(Poaceae) and the invasive M haplotype ofPhragmites australis(Poaceae) along a salinity gradient. Am J Bot 93: 1784–1790.
52. Garnier-Gere PH, Ades PK (2001) Environmental surrogates for predicting and conserving adaptive genetic variability in tree species. Conserv Biol 15: 1632– 1644.
53. Zhang TT, Zhao B (2010) Impact of anthropogenic land-uses on salinization in the Yellow River Delta, China: using a new RS-GIS statistical model. International Archives of the Photogrammetry, Remote Sensing and Spatial Information Science 38: 947–952.
54. Spies B, Woodgate P (2005) Salinity mapping methods in the Australian context. Prepared for the Natural Resource Management Ministerial Council. Australia: Department of the Environment and Heritage and Department of Agriculture. Fisheries and Forestry.
55. Richards LA (1954) Diagnosis and improvement of saline and alkali soils. Washington, D.C., USA: US Department of Agriculture.
56. Doyle JJ, Dickson EE (1987) Preservation of plant-samples for DNA restriction endonuclease analysis. Taxon 36: 715–722.
57. Bassam BJ, Caetanoanolles G, Gresshoff PM (1991) Fast and sensitive silver staining of DNA in polyacrylamide gels. Anal Biochem 196: 80–83. 58. Becher SA, Steinmetz K, Weising K, Boury S, Peltier D, et al. (2000)
Microsatellites for cultivar identification inPelargonium. Theor Appl Genet 101: 643–651.
59. McCormick MK, Kettenring KM, Baron HM, Whigham DF (2010) Extent and reproductive mechanisms ofPhragmites autralisspread in Brackish wetlands in Chesapeake Bay, Maryland (USA). Wetlands 30: 67–74.
60. Obbard DJ, Harris SA, Pannell JR (2006) Simple allelic-phenotype diversity and differentiation statistics for allopolyploids. Heredity 97: 296–303.
61. Holsinger KE, Lewis PO (2007) Hickory: a package for analysis of population genetic data, version 1.1. Computer program and documentation. Storrs, Connecticut, USA: Department of Ecology and Evolutionary Biology, University of Connecticut.
62. Mantel N (1967) Detection of disease clustering and a generalized regression approach. Cancer Res 27: 209–220.
63. Guldbrandtsen B, Tomiuk J, Loeschcke V (2000) POPDIST, Version 1.1.1: a program to calculate population genetic distance and identity measures. J Hered 91: 178–179.
64. Rohlf FJ (1998) NTSYS-PC numerical taxonomy and multivariate analysis system: version 2.0. Setauket: Exeter Publications.
65. Pritchard JK, Stephens M, Donnelly P (2000) Inference of population structure using multilocus genotype data. Genetics 155: 945–959.
66. Falush D, Stephens M, Pritchard JK (2003) Inference of population structure using multilocus genotype data: linked loci and correlated allele frequencies. Genetics 164: 1567–1587.
67. Falush D, Stephens M, Pritchard JK (2007) Inference of population structure using multilocus genotype data: dominant markers and null alleles. Mol Ecol Notes 7: 574–578.
68. Hubisz MJ, Falush D, Stephens M, Pritchard JK (2009) Inferring weak population structure with the assistance of sample group information. Mol Ecol Resour 9: 1322–1332.
69. Evanno G, Regnaut S, Goudet J (2005) Detecting the number of clusters of individuals using the software STRUCTURE: a simulation study. Mol Ecol 14: 2611–2620.
70. Joost S, Bonin A, Bruford MW, Despres L, Conord C, et al. (2007) A spatial analysis method (SAM) to detect candidate loci for selection: towards a landscape genomics approach to adaptation. Mol Ecol 16: 3955–3969.
71. Joost S, Kalbermatten M, Bonin A (2008) Spatial analysis method (SAM): a software tool combining molecular and environmental data to identify candidate loci for selection. Mol Ecol Resour 8: 957–960.
72. Parisod C, Joost S (2010) Divergent selection in trailing- versus leading-edge populations ofBiscutella laevigata. Ann Bot 105: 655–660.
73. Sagnard F, Pichot C, Vendramin GG, Fady B (2011) Effects of seed dispersal, adult tree and seedling density on the spatial genetic structure of regeneration at fine temporal and spatial scales. Tree Genet Genomes 7: 37–48.
74. Slatkin M, Excoffier L (2012) Serial founder effects during range expansion: a spatial analog of genetic drift. Genetics 191: 171–181.
75. Buckley J, Butlin RK, Bridle JR (2012) Evidence for evolutionary change associated with the recent range expansion of the British butterfly,Aricia agestis, in response to climate change. Mol Ecol 21: 267–280.
76. Taylor CE (1976) Genetic-variation in heterogeneous environments. Genetics 83: 887–894.
77. Hallatschek O, Nelson DR (2008) Gene surfing in expanding populations. Theor Popul Biol 73: 158–170.
78. Edmonds CA, Lillie AS, Cavalli-Sforza LL (2004) Mutations arising in the wave front of an expanding population. P Natl Acad Sci USA 101: 975–979. 79. Excoffier L, Foll M, Petit RJ (2009) Genetic consequences of range expansions.
Annu Rev Ecol Evol S 40: 481–501.
80. Eckert CG, Samis KE, Lougheed SC (2008) Genetic variation across species’ geographical ranges: the central-marginal hypothesis and beyond. Mol Ecol 17: 1170–1188.
81. Bascompte J, Possingham H, Roughgarden J (2002) Patchy populations in stochastic environments: Critical number of patches for persistence. Am Nat 159: 128–137.
82. Hancock AM, Alkorta-Aranburu G, Witonsky DB, Di Rienzo A (2010) Adaptations to new environments in humans: the role of subtle allele frequency shifts. Phil. Trans. R. Soc. B 365: 2459–68.
83. Guo XX, Mrazek J (2008) Long simple sequence repeats in host-adapted pathogens localize near genes encoding antigens, housekeeping genes, and pseudogenes. J Mol Evol 67: 497–509.
84. Nielsen R (2005) Molecular signatures of natural selection. Annu Rev Genet 39: 197–218.
85. Schlotterer C, Kauer M, Dieringer D (2004) Allele excess at neutrally evolving microsatellites and the implications for tests of neutrality. Proc R Soc B 271: 869–874.
86. Curn V, Kubatova B, Vavrova P, Krivackova-Sucha O, Cizkova H (2007) Phenotypic and genotypic variation of Phragmites australis: comparison of populations in two human-made lakes of different age and history. Aquat Bot 86: 321–330.
87. Engloner AI (2009) Structure, growth dynamics and biomass of reed (Phragmites australis) - A review. Flora 204: 331–346.
88. Hansen DL, Lambertini C, Jampeetong A, Brix H (2007) Clone-specific differences inPhragmites australis: effects of ploidy level and geographic origin. Aquat Bot 86: 269–279.
89. Hargeby A, Johansson J, Ahnesjo J (2004) Habitat-specific pigmentation in a freshwater isopod: adaptive evolution over a small spatiotemporal scale. Evolution 58: 81–94.