79
Stock Market Series Analysis Using Self-Organizing Maps
Diogo Matos 1, Nuno C. Marques 2, Margarida G. M. S. Cardoso31 DI-FCT/UNL, [email protected]
2 NOVA Laboratory for Computer Science and Informatics, DI-FCT, Universidade Nova de Lisboa, Portugal, [email protected]
3
Business Research Unit – Department of Quantitative Methods for Management and Economics. ISCTE – University Institute of Lisbon, Lisbon, Portugal
Abstract
In this work a new clustering technique is implemented and tested. The proposed approach is based on the application of a SOM (self-organizing map) neural network and provides means to cluster U-MAT aggregated data. It relies on a flooding algorithm operating on the U-MAT and resorts to the Calinski and Harabask index to assess the depth of flooding, providing an adequate number of clusters. The method is tuned for the analysis of stock market series. Results obtained are promising although limited in scope.
keywords: financial markets, SOM, clustering, U-Matrix, flooding, neural networks.
Resumo
Neste trabalho é implementada e testada uma nova técnica de agrupamento. A abordagem proposta baseia-se na aplicação de uma rede neuronal SOM (mapa auto-organizado) e permite agrupar dados sobre a matriz de distancias (U-MAT). É utilizado um algoritmo de alagamento ("flooding") sobre a U-MAT e o índice de Calinski e Harabasz avalia a profundidade do alagamento determinando-se, assim, o número de grupos mais adequado. O método é desenhado especificamente para a análise de séries temporais da bolsa de valores. Os resultados obtidos são promissores, embora se registem ainda limitações.
palavras-chave: os mercados financeiros, SOM, agrupamento, U-Matrix, alagamento,
redes neuronais.
1. Introduction
The SOM algorithm (Kohonen 1982) (acronym, Self-Organizing Map SOM) has the ability to organize multivariate data, thus reducing its dimensionality while maintaining the representation of relevant properties of the input vectors.
80
SOM model is used for decision support in Economics and Finance. For example, in Chen, Ribeiro, Vieira and Chen (2013), the SOM model is used to analyse the possibility of company bankruptcy by using financial fundamentals for tracking important trajectory patterns in the acquired SOM. In the first stage, the SOM algorithm is used to cluster the data and the second stage analyses trajectory patterns over the map. In Sarlin and Peltonen (2013), the SOM algorithm is used to monitor the macro-financial vulnerabilities by locating a country in a macro-financial stability cycle represented by the pre-crises, crises, post-crises and tranquil cycles. In Panosso (2013), SOM component planes are used to highlight the role of different technical indicators in a financial security. The study finds volume, mean volume and the price variation as the most relevant indicators used.
SOM results can be presented in a U-MAT (Ultsch 1993). The U-MAT allows the visualization of groups deriving from the SOM analysis. This representation can pave the way to clustering analysis. However, despite its intuitive and expressive advantages, the U-MAT is a subjective instrument of analysis. Usually, a second stage clustering method is applied to the U-MAT to obtain a clustering (objective) solution.
In this paper we propose a two-step approach: a flooding algorithm to allow the exploration of U-MAT results and the use of a clustering quality indicator to select an adequate clustering solution. The proposed approach is used for a detailed analysis of trends in the evolution of a set of financial assets provided over the S&P 500 Financial Index. Groups of days exhibiting a similar profile are constituted, based on the relative similarity of their price variation.
2. Related work
The Self-Organizing Map (SOM) (Kohonen 1982) is an unsupervised neural-network algorithm with topology preservation. The powerful visualization techniques for SOM models result from the useful and unique feature of SOM for detection of emergent complex cluster structures and non-linear relationships in the feature space (Ultsch 1993). Indeed, the SOM can be visualized as a sheet-like neural network array, whose neurons become specifically tuned to various input vectors (observations) in an orderly fashion. SOM and K-means both represent data in a similar way through prototypes of data, i.e., centroids in K-means and neuron weights in SOM, and their relation and different usages have already been studied. It is the topological ordering of these prototypes in large SOM networks that allows the application of exploratory visualization techniques, providing insight on learned data, i.e., clusters and non-linear correlations between features (Ultsch and Herrmann 2005).
There are some techniques for the interpretation of the map produced by SOM. A well-known technique - the U-MATrix - represents the distance of each neuron to their neighbours (Ultsch 1993). The U-MAT provides a simple way to visualize cluster boundaries on the map. This method is useful because the user can find clusters in the input data without having any a priori information about them. Although the U-MAT is a good tool for exploratory data analysis, objective measures of clustering in U-MAT are still needed. Some solutions for identifying clusters in a U-MAT may be used,
81
namely two-stage clustering approaches (Chi and Yang 2008). The goal of a two-stage clustering method is to overcome the major problems of the conventional methods as the sensitivity to initial prototypes (proto-clusters) and the difficulty of determining an adequate number of clusters. The aim of the SOM at the first stage is to identify the number of clusters and corresponding topological relations; the second stage uses a partitioned clustering method for assigning each pattern to a final cluster. There are several classical post-processing methods. The most common is probably the classic K-Means algorithm (Hartigan and Wong 1979), which belongs to the class of non-hierarchical clustering methods, but many approaches are possible.
3. Proposed approach
In this work a method is developed to extract non-trivial patterns from financial series data.
The adopted architecture is illustrated in Figure 1 and can be defined as a three-stage system: the input layer, the main program and the output layer.
Figure 1 - Architecture adopted
The input layer uses the Yahoo Finance API (and may also use offline documents formatted by the program protocol). The main program layer defines the algorithms and calculus applied. Finally there is an output layer that integrates Program GUI Tools and Statistics files.
The work is developed on MATLAB with the integration of SOM Toolbox (Vesanto, Himberg, Alhoniemi and Parhankangas 1999).
The specific query in the Yahoo Finance System asks for the closing value of the stock, which is the last price value for each day, to include in the financial data series. The main program is then applied to the price matrix P =[pta] (t=1...T; a=1...A) where each
row pt+ represents a given day (𝑡) and each column p+a represents the closing prices of a
82
Finally, the proposed approach for analysing the financial data series can be summarized in the following steps:
1. Data processing: Pre-process the financial dataset in P and apply the SOM method. 2. Initial clusters: Find local minima in the SOM U-MAT
3. Flooding procedure and classification: Flood the U-MAT based on the local minima; classify the corresponding flooded neuron; classify the remaining neurons (with missing class labels)
3.1. Data Processing
The data to consider refers to price series of financial assets (P) and requires normalization before the application of the SOM algorithm.
Previous studies report sensibility analysis on the best time length to consider when using moving averages for pre-processing financial products data – e.g. (Marques and Gomes 2010).
In this study, a specific normalization is adopted which takes into account a specific time length of interest (𝐾): Max-Min normalization. The 𝑝𝑡𝑎𝑛 normalized price values
are:
𝑝𝑡𝑎𝑛 = 𝑝𝑡𝑎− 𝑀𝑖𝑛{𝑝𝑡−1,𝑎 , … 𝑝𝑡−𝐾,𝑎}
𝑀𝑎𝑥{𝑝𝑡−1,𝑎 , … 𝑝𝑡−𝐾,𝑎} − 𝑀𝑖𝑛{𝑝𝑡−1,𝑎 , … 𝑝𝑡−𝐾,𝑎} Equation 1
This normalization is quite meaningful for the present study as it gives a local perception of the variation of prices, the concept of “local” being defined by the time length 𝐾.
Empirical observation of many technical analysis measures, on different stock market prices, shows that when the chosen period is too short, variations of time series are confounded with trend change. Choosing too long a period makes the detection of trends more precise but less descriptive and also delayed when compared with a shorter period. So in order to be able to detect states/clusters with high and low variations in the price we should adopt an adequate time length (lag).
The SOM Toolbox (Vesanto, et al. 1999) is then applied to the normalised dataset – 𝑃𝑛 = [𝑝
𝑡𝑎𝑛] - using default parameters for “mapsize=big” (e.g. map size 𝑀 × 𝑁
= 16 × 60 and we use the hexagonal neighbourhood view).
3.2. Initial Clusters
The clustering procedure, based on the U-MAT obtained, requires the determination of initial seeds. For this end, we successively identify the local minima of the U-MAT. We consider the unit neighborhood to define these minima:
83
1. A U-MAT position (𝑚, 𝑛′) is selected iff 𝑑(𝑢𝑚; 𝑢𝑛′) is lower than all the 𝑑(𝑢𝑚; 𝑢𝑛) such that 𝑢𝑚 and 𝑢𝑛 are neighbors in the SOM map (6 neighbors in the hexagonal configuration used).
2. The selected (𝑚, 𝑛′) position defines a local minimum in the U-MAT; thus, the SOM neurons 𝑢𝑚 and 𝑢𝑛′ (that implicitly aggregate specific input vectors 𝑝𝑡+𝑛 ) are automatically classified into a cluster.
Steps 1. and. 2. are repeated for all entries in the U-MAT until all local minima are identified. These minima provide the appropriate starting seeds for our clustering method, which starts precisely by aggregating the most similar micro-clusters (SOM neurons).
This way, using a large enough SOM map this procedure provides an upper bound (number of local minima) for the number of clusters to be discovered.
3.3. Flooding procedure and Classification
The distance matrix of self-organizing map may be seen as a topographic landscape. The previous set of clusters’ seeds (“LocalMins”) is the starting point for clustering the entire dataset. The proposed method for “flooding” the U-MAT is based on the algorithm of Bond (2011). This technique is used in the "bucket" fill tool of paint programs to fill connected areas - similarly coloured areas filled with a different colour. This serves as an inspiration for our approach that starts flooding from the “LocalMins” or initial clusters. The following functions are used to get the final set of clusters (“FinalClusters”):
function [ FinalClusters ] = flood( LocalMins, Adjustment ) AllClusters = LocalMins
FinalClusters = []
Depth = Adjustment* mean(U-MAT) for Cluster in AllClusters
Cluster = floodACluster(Cluster, Depth) addCluster(FinalClusters, Cluster) endfor
end
The determination of the number of groups is done with the support of the Calinski and Harabasz measure (Caliński and Harabasz 1974).
The “Adjustment” parameter usually ranges from 0.1 to 2.0 (with step 0.1) and is used for tuning the flooding parameter (“Depth”). In Matos, Marques and Cardoso (2014) we present a sensitivity analysis of the SOM results to this parameter (for Wine and Iris data sets on the UCI Machine Learning Repository).
The “floodACluster” function appears as an auxiliary function for the flood algorithm. This function verifies each position of the cluster and flood to the boundary established, which is represented by the value Depth. The function “getNeighbours()” represents the six neighbour positions in the U-Matrix, that result from the hexagonal setting in SOM.
84
function [Cluster] = floodACluster(Cluster, Value) NewCluster = []
for X in Cluster
Neigh = getNeighbours(X) for Possib in Neigh
if(Possib < Value) add(NewCluster, Possib) endfor
endfor
add(Cluster, NewCluster) end
The program stopping criterion refers to the inability of this function to add more clusters to the solution.
After running the flooding algorithm, some neurons may remain with missing class labels. Therefore, a classification procedure is implemented that uses the nearest neighbour-neuron of the already classified neurons to provide the missing label.
4. Financial data series analysis
4.1. Data selection and pre-processing
In order to test the proposed clustering procedure data was collected from the Yahoo Finance web site that refers to the Standard & Poor's 500 (S&P 500). The S&P 500 is considered one of the leading indicators of US business cycles. It is a free-float capitalization-weighted index, with components selected by a committee using several company indicators, namely liquidity-based size requirements.
The period under study starts in 2004 and ends in 2014. This period encompasses the most recent economic crisis, which started in 2007 and started to ameliorate in 2009. First we adopt a (simplified) trend definition;
𝑡𝑟𝑒𝑛𝑑(𝑥𝑡) = {1 𝑥0 𝑥𝑡𝑡− 𝑥− 𝑥𝑡−1𝑡−1 > 0= 0 −1 𝑥𝑡− 𝑥𝑡−1 < 0
Equation 2
Data selection is then performed based on an empirical concept of association between two series that originates from domain knowledge and is measured as follows:
1) The sum of scores 𝝋 summarizes agreement between two series’ trends (where t0 and T stand for the first and last day of the series at hand):
𝝋 = ∑ 𝒔𝒄𝒐𝒓𝒆(𝒙𝒕, 𝒚𝒕) 𝑻 𝒕=𝒕𝟎 Equation 3 where 𝑠𝑐𝑜𝑟𝑒(𝑥, 𝑦) = { 0, 𝑡𝑟𝑒𝑛𝑑(𝑥) ≠ 𝑡𝑟𝑒𝑛𝑑(𝑦)1, 𝑡𝑟𝑒𝑛𝑑(𝑥) = 𝑡𝑟𝑒𝑛𝑑(𝑦) Equation 4
85
2) The sum of scores 𝝍 summarizes disagreement between two series trend:
𝝍 = ∑[𝟏 − 𝒔𝒄𝒐𝒓𝒆(𝒙𝒕, 𝒚𝒕)] 𝑻
𝒕=𝒕𝟎
Equation 5
We use a dataset with 11 series (referring to 11 companies) for evaluating the usefulness of the proposed approach. It is built around the Simon Property Group Inc., which was found to be the most closely “correlated” (see Equation 3 and Equation 4) with the remaining series listed in the S&P 500. Ten more companies are then selected that presented the largest correlations with Simon Property Group Inc.: Macerich, Boston Properties, Public Storage, AvalonBay Communities, Inc., Prologis, Equity Residential, Apartment Investment & Mgmt, Ventas Inc., HCP Inc. In general, these companies are in the financial sector of real estate investment industry. These series’ chronograms, during the period under study, are depicted in Figure 2. Since the selected companies all survived the economic crises of 2007, the selected series data may provide an illustration of the algorithms’ ability to discover this a priori known crisis period and related patterns of price variation in the real estate investment sector. In particular, it will be worth discovering any pre-crises or post-crises patterns.
Figure 2 - Financial data set A
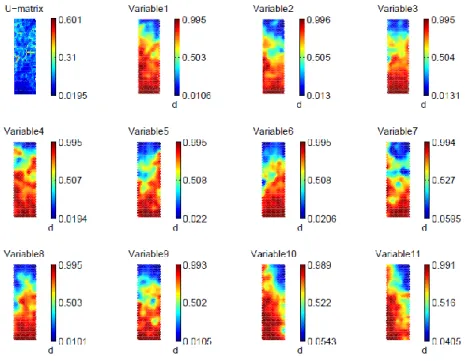
The time series values are first transformed according to the proposed method: the ratios between the price value (closing price) and the range of values corresponding to the previous 40 days are considered - Equation 1. SOM analysis is performed on these ratios and the corresponding U-MAT is obtained - Figure 3. In these figures - component planes - the red colors represent larger distances between neurons while blue colors represent lower distances.
86
Var1: Simon Property Group
Var2: Macerich, Var3: Boston Properties Var4: Public Storage Var5: Simon Property Group Inc.
Var6: AvalonBay Communities Inc. Var7: Prologis, Var8: Equity Residential Var9: Apartment Investment & Mgmt Var10: Ventas Inc. Var11: HCP Inc.
Figure 3 - U-MAT and component planes for Financial Data set A
An alternative data set is built around the most “inversely-correlated” (see Equation 3 and Equation 5) company with the S&P 500 data set - Dell Inc. The other companies selected (“inversely-correlated” with Dell Inc.) are: Mylan Inc., Brown-Forman Corporation, Lilly (Eli) & Co., United Health Group Inc., Jabil Circuit, People's United Bank, Gilead Sciences, SCANA Corp, The Hershey Company, Nucor Corp. Companies in this data set are very diverse. The series show a wide diversity of patterns in Figure 4.
Figure 4 – Financial data set B
4.2. Clustering the U-MAT data
As previously mentioned, we adopt a flooding procedure (“floodACluster”) in order to aggregate the micro-clusters identified in the U-MAT. In each analysis, the flooding parameter – depth of flooding - is empirically determined based on the clustering comparisons provided by the Calinski -Harabasz index.
87
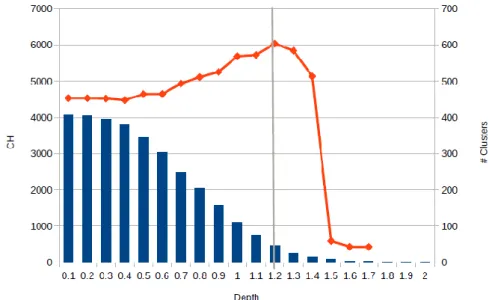
Figure 5 - Depth vs. CH for data set A
For the data set A, the selected clusters-states correspond to depth 1.2 (see x-axis in Figure 5) and 75 clusters (see right y-axis in Figure 5) which is the solution providing the best (maximum) Calinski and Harabasz (CH) index value (see left y-axis in Figure 5). In this solution, cluster number 33 is the modal cluster (color green in Figure 6 – right): it is apparent during a long time period which corresponds to positive variation of the stock market value. During the crisis period the importance of the cluster 39 (red coloured) and cluster 34 (blue coloured) is notable.
Figure 6 - Distance between clusters (left) and clusters colored (right)
In Figure 6 (left) the blue bars mark transitions between clusters and their heights illustrate distances between clusters. The horizontal green line shows the average distance between clusters. Between the year of 2008 and 2009 (the crises period) the distance between the clusters obtained assumes very unusual values, reflecting the clusters-states instability.
88
For data set B, the multiplicity and diversity of clusters is apparent, undermining the utility of this solution. Although there are some clusters with almost 100 days, there are many more with very few days.
5. Discussion and perspectives
A clustering procedure is proposed to group time units of financial series that show similar variation patterns. The clustering departs from the results of a SOM neural network that learns from the normalized prices of several S&P 500 series. Initial clusters are constituted based on the U-MAT local minima. Then, micro-groups summarized in U-MAT are used in a flooding procedure to enable the automatic grouping of the time series’ days showing similar variations.
The Calinski and Harabasz index is used to assess the quality of alternative clustering solutions derived from diverse flooding depths.
According to the results obtained, the groups of days with similar price variation provide interesting insights regarding the behaviour S&P500 series before and after the financial crises. For data set A three distinct patterns emerge, corresponding to the main market trends: upward market, downward market and unstable market (clusters associated with the green, red and blue lines, respectively, in Figure 6). The unstable patterns reveal representative moments in changing trends when decisions to invest or recover from an investment may be placed. For data set B too many clusters are obtained, which is consistent with the series’ diversity but provides no meaningful solution.
In the future, new applications with real data, as well as with synthetic data, should further illustrate the performance of the proposed clustering technique. Also in the future, new clustering quality indexes, besides the Calinski and Harabask index, can be used to support the automatic clustering of SOM results – e. g. see (Cardoso and Carvalho 2009).
The proposed approach relies on full data sets referring to specific periods. An alternative method – a streaming SOM (Silva and Marques to appear) can be used for online pattern detection (e.g. at the end of a trading day it can be used to give investment advice for the next trading day). In the future, the combination of this approach with the methodology proposed in this study may provide new tools for the analysis of financial series. Future research may also focus on the identification of rare events (e.g. events that may constitute a hazardous situation for the investor).
References
Bond, C. (2011), "An Efficient and Versatile Flood Fill Algorithm for Raster Scan Displays."
Caliński, T., and Harabasz, J. (1974), "A Dendrite Method for Cluster Analysis," Communications in Statistics-theory and Methods, 3, 1-27.
89
Cardoso, M. G. M. S., and Carvalho, A. P. d. L. F. (2009), "Quality Indices for (Practical) Clustering Evaluation.," Intelligent Data Analysis, 13, 725-740.
Chen, N., Ribeiro, B., Vieira, A., and Chen, A. (2013), "Clustering and Visualization of Bankruptcy Trajectory Using Self-Organizing Map," Expert Systems with Applications, 40, 385-393.
Chi, S.-c., and Yang, C. C. (2008), "A Two-Stage Clustering Method Combining Ant Colony Som and K-Means," J. Inf. Sci. Eng., 24, 1445-1460.
Hartigan, J. A., and Wong, M. A. (1979), "Algorithm as 136: A K-Means Clustering Algorithm," Applied statistics, 100-108.
Kohonen, T. (1982), "Self-Organized Formation of Topologically Correct Feature Maps," Biological cybernetics, 43, 59-69.
Marques, N. C., and Gomes, C. (2010), "Implementing an Intelligent Moving Average with a Neural Network," in ECAI, pp. 1129-1130.
Matos, D., Marques, N., and Cardoso, M. G. M. S. (2014), "Agrupamento De Dados De Uma Umat – Uma Aplicação Sobre Dados Financeiros," JOCLAD 2014 - XXI Jornadas de Classificação e Análise de Dados.
Panosso, G. C. (2013), "Análise Do Mercado Financeiro Baseada Em Análise Técnica Com Self-Organizing Maps."
Sarlin, P., and Peltonen, T. A. (2013), "Mapping the State of Financial Stability," Journal of International Financial Markets, Institutions and Money, 26, 46-76.
Silva, B., and Marques, N. C. (to appear), "Ubiquitous Self-Organizing Map: Learning Concept-Drifting Data Streams," WorldCIST 2015 - 3rd World Conference on Information Systems and Technologies.
Ultsch, A. (1993), "Self-Organizing Neural Networks for Visualisation and Classification," in Information and Classification, Springer, pp. 307-313.
Ultsch, A., and Herrmann, L. (2005), "The Architecture of Emergent Self-Organizing Maps to Reduce Projection Errors," in ESANN, Citeseer, pp. 1-6.
Vesanto, J., Himberg, J., Alhoniemi, E., and Parhankangas, J. (1999), "Self-Organizing Map in Matlab: The Som Toolbox," in Proceedings of the Matlab DSP conference, pp. 16-17.
90
Diogo Pires de Matos concluiu o Mestrado Integrado em Engenharia
Informática na FCT/UNL em Novembro de 2014. O seu trabalho de mestrado foi pioneiro ao aplicar modelos de inundação a matrizes de distâncias entre unidades num mapa auto-organizado. Diogo Matos colaborou em várias projetos de investigação com ligação Universidade-Empresa. Trabalha na Deloitte Portugal desde Novembro de 2014.
Nuno C. Marques é Professor Auxiliar na FCT/UNL desde Março de 2001.
Obteve o seu doutoramento em Informática pela Universidade Nova de Lisboa em Janeiro de 2000. O trabalho de doutoramento foi pioneiro na aquisição de conhecimento utilizando grandes volumes de texto em Português. Ensina na FCT/UNL desde Outubro de 2001. Nos últimos anos Nuno C. Marques tem desenvolvido o seu trabalho na Aplicação de Mapas Auto-organizados e outras Redes Neuronais Artificiais a problemas reais, nomeadamente para extração de conhecimento em fontes contínuas de dados financeiros e de texto.
Margarida G. M. S. Cardoso é Professora Associada (com Agregação) na
Escola de Gestão do ISCTE - Instituto Universitário de Lisboa, Portugal. É licenciada em Matemática (FC -Universidade de Lisboa), Mestre em Investigação Operacional e Engenharia de Sistemas e Doutorada em Engenharia de Sistemas (IST - Universidade de Lisboa). A sua investigação decorre no domínio da Análise de Dados, usando metodologias da Estatística Multivariada e da Aprendizagem Automática - técnicas de Agrupamento e Classificação, em particular. A pesquisa em Marketing destaca-se como uma área de aplicação.