www.adv-radio-sci.net/9/187/2011/ doi:10.5194/ars-9-187-2011
© Author(s) 2011. CC Attribution 3.0 License.
Radio Science
Context-based user grouping for multi-casting in heterogeneous
radio networks
C. Mannweiler, A. Klein, J. Schneider, and H. D. Schotten
Chair for Wireless Communications and Navigation, University of Kaiserslautern, Germany
Abstract. Along with the rise of sophisticated smartphones and smart spaces, the availability of both static and dynamic context information has steadily been increasing in recent years. Due to the popularity of social networks, these data are complemented by profile information about individual users. Making use of this information by classifying users in wireless networks enables targeted content and advertise-ment delivery as well as optimizing network resources, in particular bandwidth utilization, by facilitating group-based multi-casting. In this paper, we present the design and imple-mentation of a web service for advanced user classification based on user, network, and environmental context informa-tion. The service employs simple and advanced clustering algorithms for forming classes of users. Available service functionalities include group formation, context-aware adap-tation, and deletion as well as the exposure of group charac-teristics. Moreover, the results of a performance evaluation, where the service has been integrated in a simulator mod-eling user behavior in heterogeneous wireless systems, are presented.
1 Introduction
Group communication is of particular interest in wireless (access) networks, one example being the domain of multi-casting, i.e. simultaneously delivering the same content to multiple recipients. Chalmers and Almeroth (2001), Janic and Van Mieghem (2009), as well as Baumung and Zitterbart (2009), among others, have shown that multi-casting tech-nologies can considerably contribute to more efficiently ex-ploiting available network resources when applied under ap-propriate circumstances. A typical use case for exploiting multi-casting is a large-scale sport event with tens of thou-sands of spectators that can be grouped according to their user profile and context. Based on that classification, dif-ferent groups can receive adapted content. However, a user
Correspondence to:C. Mannweiler ([email protected])
classification service, as required in this use case, can also be exploited for selecting people with particular characteris-tics. Consumers with an affinity to a certain product category could be identified for specific marketing purposes. Both use cases would require a reliable means of data privacy and se-curity as well as the user’s approval.
The remainder of this paper is organized as follows: Sect. 2 presents the algorithms used for our user classification service and Sect. 3 briefly discusses implementation aspects. Section 4 evaluates the algorithms according to a compre-hensive set of criteria. Section 5 concludes the paper with a short summary and outlook.
2 Classification methods
In this section, we will briefly introduce the clustering meth-ods used for a context-aware user classification service. This includes the algorithm of the respective method as well as relevant characteristics such as hard vs. soft mapping or vari-able vs. fixed number of clusters. The notation employed in this paper is defined below:
– C: Set of all clusters,C= {C1,C2,...,Ck} – N: Set of all cluster centers (nodes),
N= {N1,N2,...,Nk} – K: Context space,K⊆Rl
– X: Set of observations (user’s context) to classify,
X= {x1,x2,...,xn},xj∈K
– n: Number of observations (users) to classify – k: Number of clusters (nodes)
– l: Dimension of context space
– : Tuple of a clusterCiand an observationxj, =(Ci,xj)
– µi: Center of clusterCi,µi∈Rl
– wi: Weighing vector of nodeNi (cluster center), wi∈Rl
2.1 Methods with fixed number of cluster centers Common to the methods presented in this subsection is the requirement to set the number of clusters before the start of the classification algorithm. During runtime, the number of clusters does not change.
2.1.1 K-Means algorithm
K-Means (MacQueen, 1967) is an algorithm that establishes a hard mapping betweenCi and an observationxj, i.e. an observation is unambiguously associated with one cluster. Across multiple iterations, the following error function is minimized:
E=
k
X
i=1
X
xj∈Ci
||xj−µi||2 (1)
The iteration steps of the algorithm are:
1. (Random) initialization of k cluster centers (nodes) – cluster centers are randomly initialized in the l-dimensional context space.
2. Mapping of observations to centers– each observation is mapped to the closest node based on the selected dis-tance metric such as Euclidean disdis-tance.
3. Update of cluster centers– position of nodes is recom-puted based on the observations that are assigned to the node. Go back to step 2.
The algorithm terminates as soon as a specified termina-tion criterion is reached, e.g. the error functermina-tion falls below a threshold. For further details on K-Means, the reader is referred to Steinhaus (1957).
2.1.2 Neural Gas
The Neural Gas algorithms establishes a graph ofk nodes that, independently of each other, move through the context space during the iterations. The core idea is to present avail-able observations to the graph and to accordingly adjust the cluster centers. In brief, the steps of the algorithms are as follows:
1. (Random) initialization of k cluster centers (nodes) – Cluster centers are randomly initialized in the l-dimensional context space.
2. Presentation of an observation– An observationxc∈X is randomly chosen and presented to the graph. (An observation can be drawn multiple times.)
3. Sorting of nodes– Nodes are sorted according to their Euclidean distance toxc.
4. Adjustment of node positions– The positionwi of the graph’s nodes within the context space is adjusted ac-cording to the following equation:
wi(t+1)=wi(t )+l(t )·hd(i)·(xc−wi(t )) (2) wherel(t )is the learning rate of the current iteration (l(t ) > l(t−1)for allt) andhd(i)the adjustment for an individual node depending on its ranking in step 3. If the termination criterion (e.g. number of iterations) has not been reached yet, the next iteration can begin, starting with step 2. Otherwise, observations are assigned to the closest node.
For further details on the algorithm, the reader is referred to Martinez and Schulten (1991) and Fritzke (1997).
2.1.3 K-Fixed-Means
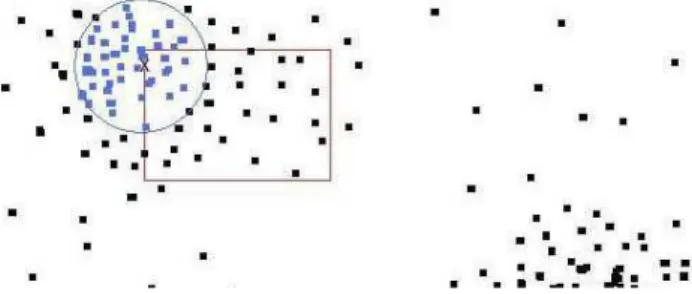
None of the presented algorithms considers fixed cluster cen-ters. However, for some of the use cases described in Sect. 1, this is an important alternative for user classification. There-fore, we have developed the so-called K-Fixed-Means algo-rithm, where the position of a cluster center is fix except for a defined tolerance interval (for each dimension of the con-text space) within which the cluster center can move. More-over, the maximum distance to a center is limited, i.e. some observations may not be assigned to any node at all. Fig-ure 1 depicts the idea of tolerance space (purple rectangle) and maximum distance (blue circle). The basic steps of the algorithm are:
1. Initialization–k cluster centers (nodes) are initialized at the determined (and fix) positions.
2. Mapping of observations to centers– each observation is mapped to the closest node based on the selected dis-tance metric such as Euclidean disdis-tance. Non-assigned observations (i.e. those whose distance is above the de-fined thresholds) are collected in a setU.
3. Adjustment of cluster centers – for each observation in U, it is checked whether there exists a node that, if moved within its tolerance room, can accommodate the given observation. If their exists such a node, it is moved according the following equation:
wi(t+1)=wi(t )+l(t )·d(xc,wi)·(xc−wi(t )) (3) wherel(t )is the learning rate andd(xc,wi)a factor that takes into account the different tolerance intervals. Af-ter all observations inU have been checked, the next iteration starts with step 2, unless the criterion for ter-mination is met.
Fig. 1.Concept of K-Fixed-Means algorithm.
2.1.4 Fuzzy-C-Means
In contrast to the algorithms presented so far, Fuzzy-C-Means can assign an observation to several clusters. The degreeuij of membership of an observationxj to a single clusterCi has to lie within the interval ]0,1]and the sum of all memberships of an observation must add up to 1, i.e.
Pk
i=1uij=1 for anyj. The algorithm minimizes the follow-ing error function:
E=
k
X
i=1 n
X
j=1
umij||xj−µi||2,1≤m≤ ∞ (4)
The exponentmis the so-called “fuzzifier”. The higher its value, the fuzzier the mappings of observations to nodes. In practice, values between 1 and 2.5 have proven to generate good clustering results (Bezdek, 1981). The basic steps of the algorithm are:
1. Initialization– (random) initialization of valuesuij 2. (Re)calculation of cluster centers– for the current
itera-tion step, the cluster centers are calculated according to
µi=
Pn j=1umijxj
Pn j=1umij
(5)
3. Recalculation of degreesuijof membership– the degree of membership of an observationxj to a clusterCi is calculated according to the following equation:
uij=
1
Pk l=1
||xj−µi||
||xj−µl|| 2 m−1
(6)
4. Test of termination criterion– if the termination crite-rion, e.g. sum of changes ofuijfor all combinationsi,j is below a defined threshold, is not satisfied yet, another iteration is performed starting with step 2.
The presented algorithm converges to a local minimum which is not necessarily the optimal solution. Moreover, the results depend on the initialization ofuij.
2.2 Methods with variable number of cluster centers In contrast to the algorithms presented so far, this class of al-gorithms is capable of adjusting the number of cluster centers during runtime. Hence, not only the assignment of observa-tions to clusters but also the number of clusters is optimized. Using the algorithms from the previous section, this could only be achieved by several runs with different amounts of clusters.
2.2.1 Growing Neural Gas
The Growing Neural Gas algorithm is an extended version of the Neural Gas algorithm as presented in the previous sec-tion. By the insertion and aging of edges between cluster centers (nodes) according to a set of rules, the topology of the underlying data shall be reflected more precisely. For a detailed description of the algorithm, the reader is referred to Fritzke (1995). Here, only a short overview of the algorithm steps is presented to sketch the basic idea:
1. Initialization– two nodes are randomly put in the con-text space (without an edge between them).
2. Selection of observation and calculation of closest nodes– from the set of observations, one is picked (ran-domly) and the closest node (N1) as well as the second closest (N2) are determined based on the Euclidean dis-tance
3. Insertion of edges– in case there is no edge betweenN1 andN2, it is inserted. In any case, the age of the edge is set to 0.
4. Calculation of a node’s statistical error value– for ev-ery node, the statistical errorENiis stored. It represents the total error of all observations assigned to that node. ForN1(as determined in step 2), the value is updated by adding its Euclidean distance to the current observation
xc:
EN1(t )=EN1(t−1)+ ||wN1−xc||. (7)
5. Adaptation of node positions – the position of N1 as well as its direct topological neighbors is adapted as fol-lows:
wi(t+1)=wi(t )+l·(xc−wi(t )). (8) The learning ratel, though being constant during all it-erations, is different forN1and its neighbors, i.e. for the neighbors, it is approximately two orders of magnitude lower than forN1.
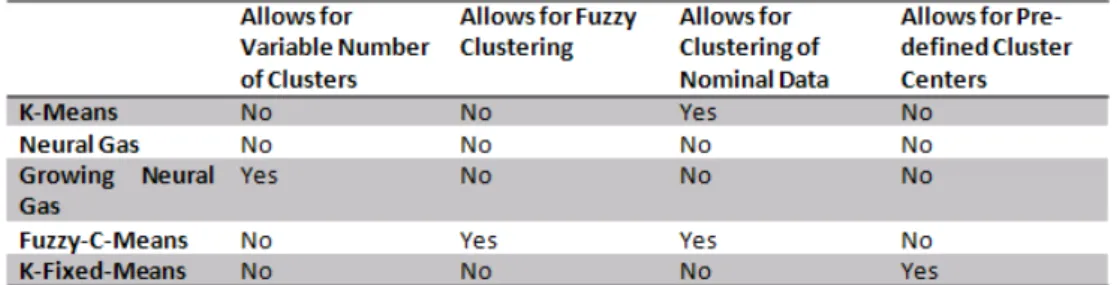
Fig. 2.Overview of algorithm characteristics.
7. Insertion of a new node– after a defined number of it-erations has passed, the nodeNEmax with the highest
ac-cumulated errorEmaxis determined. Among its direct topological neighbors, the one with the highest accu-mulated errorEnmax is chosen and a new node is placed
midway the selected nodes. The edge betweenNEmax
andNEn,maxis removed and edges between the new node
andNEmax andNEn,max, respectively, are inserted. The
accumulated error of the old nodes is decreased by a factorα. The accumulated error of the new node is set to arithmetic mean of these two (updated) values. 8. Reduction of accumulated error– for all nodes, the
ac-cumulated error is decreased by a factorβ≪α. 9. Test of termination criterion– if the termination
crite-rion (e.g. current number of nodes) is not fulfilled, the next iteration starts at step 2.
A summarizing overview of the employed algorithms and their characteristics is given in Fig. 2.
3 Implementation
Implementation of the user classification service has been guided by several objectives, most importantly:
– high availability of the service – high scalability
– simple extensibility
– usage of widely adopted protocols and data representa-tion formats
– adequate latency behavior
Taking these aspects into account, we designed a service creation and delivery environment utilizing the JavaEE plat-form in conjunction with the JBOSS Application Server (ver-sion 5.1.0.GA). Service functionality can be reached via http requests and, optionally, additional transmission of XML data. The service hence implements a so-called RESTful
(Tyagi, 2006) interface and can be made available to basi-cally any hardware/software platform and (almost) indepen-dently of the kind of access network. Available functional-ity currently includes group formation, context-aware group adaptation, and deletion as well as the provisioning of char-acteristics of active groups.
4 Results and performance evaluation
For evaluating the performance of the presented algorithms, the following set of criteria has been defined:
– Quality of clustering results – quality is given by the total classification error of a given result.
– Temporal performance – this criteria measures the total time necessary for a classification.
– Stability – evaluates similarity of outcomes for multiple runs with identical data set.
– Flexibility – are algorithms capable of handling other than metric data?
– Implementation – evaluates the amount of effort neces-sary for algorithm implementation
4.1 Quality and temporal performance of clustering methods
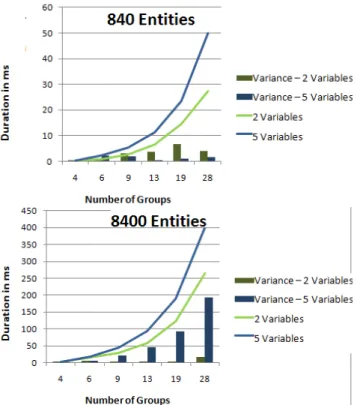
For a comprehensive evaluation within the given multi-casting scenario, every algorithm has been executed 100 times for any given input parameter combination. Input pa-rameters included number of entities (840 and 8400), number of groups to be formed (4, 6, 9, 13, 19, 28), and dimension of context space (2 and 5). We analyzed total execution time of an algorithm, its variance as well as total accumulated er-ror. In summary, most important observations and results are (a more detailed performance analysis of the individual algo-rithms can be found in Appendix A):
4.1.1 K-Means
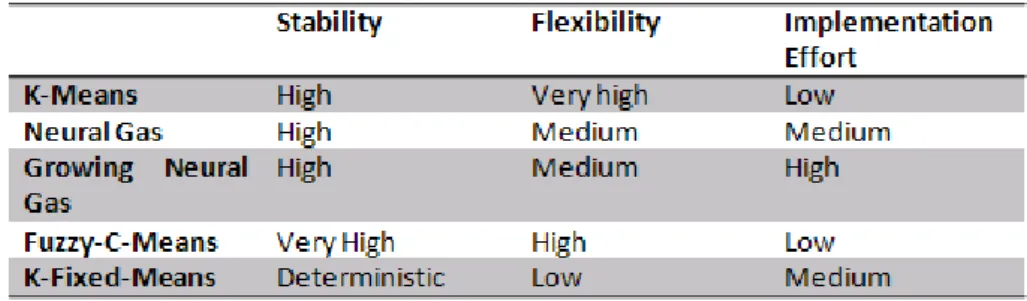
Fig. 3.Summary evaluation of classification algorithms.
number of users and groups. In terms of the absolute clas-sification error, it achieves the best result of all analyzed al-gorithms with an average of 133.52 across 100 runs of the standard scenario.
4.1.2 Neural Gas
Similar to K-Means, Neural Gas is a relatively fast algorithm. Moreover, runtime decreases significantly for larger amount of groups because assignment of observations, in contrast to K-Means, is done only once and not in every iteration. Moreover, with higher numbers of nodes, their final posi-tion is reached much faster. The average classificaposi-tion error was 133.54.
4.1.3 Growing Neural Gas
In terms of both temporal behavior and dependency on entity as well as group count, the algorithm behaves very similar to Neural Gas. Moreover, its average classification error was only slightly higher, averaging at 137.74.
4.1.4 Fuzzy-C-Means
With regard to performance, the algorithm performs worse with increasing numbers of observations, variables per obser-vation and number of groups. Due to its high computational effort, the algorithm cannot handle more than ten groups in a timely manner. For the calculation of the average classifi-cation error (134.69), observations have been assigned to the node they have had the highest affiliation to.
4.1.5 K-Fixed-Means
Overall, algorithm runtime is on a satisfying level and com-parable to that of K-Means. For five variables (i.e. a five-dimensional context space), the algorithm arrives in a stable state earlier since (with the given set of test observations) the cluster centers reach their final position faster. A comparison of the accumulated classification error does not make sense since some observations were not classified at all.
4.2 Overall evaluation
A brief summary of the remaining evaluation criteria is de-picted in Fig. 3.
Overall, the K-Means algorithm disposes of the most ap-propriate characteristics in the given multi-casting use case. Not only good results in terms of quality and performance but also its capability to handle nominal data makes it the de-fault choice for classification requests. Neural Gas is the pre-ferred algorithm for large entity and group counts; however, it should not be used for clustering observations with nom-inal data. In case that the number of groups is not known yet, Growing Neural Gas, despite its difficult parametriza-tion, is the best choice. Fuzzy-C-Means is especially recom-mended if the number of groups remains small and the struc-ture of the observation set is rather complex. Finally, the K-Fixed-Means algorithm should be chosen if cluster cen-ters, i.e. group characteristics, are pre-determined and should only be marginally changed during execution.
5 Conclusions
This paper has presented an evaluation of different user classification algorithms for enabling group communication and multi-casting in wireless networks. Classification tests have been performed based on simulated context information about users (such as location, music taste, and age) with dif-ferent numbers of both users and expected groups. K-Means and (Growing) Neural Gas as well as the newly developed K-Fixed-Means have consistently recognized the basic struc-ture within the set of users and produced fast and stable clas-sification results with low total errors.
Appendix A
Algorithms performance results
Fig. A1.Performance of K-Fixed-Means algorithm.
Fig. A2.Performance of K-Means algorithm.
Fig. A3.Performance of Neural Gas algorithm.
Fig. A5.Performance of Fuzzy-C-Means algorithm.
Acknowledgements. Parts of this work were funded by the Federal Ministry of Education and Research of the Federal Republic of Ger-many (Foerderkennzeichen 01 BK 0808, GLab). The authors alone are responsible for the content of the paper.
References
Baumung, P. and Zitterbart, M.: MAMAS – Mobility-aware Mul-ticast for Ad-hoc Groups in Self-organizing Networks, in: Ba-sissoftware f¨ur drahtlose Ad-hoc- und Sensornetze, edited by: Zitterbart, M. and Baumung, P., pp. 33–48, Universitaetsverlag Karlsruhe, March 2009.
Bezdek, J. C.: Pattern Recognition with Fuzzy Objective Function Algorithms. Plenum Press, New York, 1981.
Chalmers, R. and Almeroth, K.: Modeling the Branching Char-acteristics and Efficiency Gains of Global Multicast Trees, Pro-ceedings of IEEE Infocom, Anchorage (AK), 2001.
Fritzke, B.: A growing neural gas network learns topologies, in: Advances in Neural Information Processing Systems 7, edited by: Tesauro, G., Tesauro, G., Touretzky, D. S., and Leenet, T. K., MIT Press, Cambridge (MA), pp. 625–632, 1995.
Fritzke, B.: Some Competitive Learning Methods. Java Paper, 1997, http://www.neuroinformatik.ruhr-uni-bochum.de/VDM/ research/gsn/JavaPaper/, accessed 11 November 2010.
Janic, M. and Van Mieghem, P.: The Gain and Cost of Multicast Routing Trees. International Conference on Systems, Man and Cybernetics (IEEE SMC 2004), The Hague, 2004.
MacQueen, J.: Some methods for Classification and Analysis of Multivariate Observations: Proceedings of the Fifth Berkeley Symposium on Mathematical Statistics and Probability, pp. 281– 297, 1967.
Martinez, T. M. and Schulten, K. J.: A neural gas network learns topologies, in: Artificial Neural Networks, edited by: Kohonen, T., M¨akisara, K., Simula, O., Kangas, J. Elsevier, North-Holland, pp. 397–402, 1991.
Steinhaus, H.: Sur la division des corps matiriels en parties, Bull. Acad. Polon. Sci., 4(12), 801–804, 1956.