RESEARCH NOTE
Computerized image analysis of seedlings to evaluate broccoli seed vigor
11Submitted on 01/19/2017. Accepted for publication on 07/20/2017.
2Departamento de Produção Vegetal, USP/ESALQ, Caixa Postal 9, 13418-900 – Piracicaba, SP, Brasil. *Corresponding author <[email protected]>
Haynna Fernandes Abud
2*, Silvio Moure Cicero
2,
Francisco Guilhien Gomes Junior
2ABSTRACT – The computerized image analysis of seedlings constitutes an efficient technique to evaluate the quality of
seed lots, since it is quick in responding, has a simple execution and reproduction. The goal of this research was to verify the efficiency of the computer image analysis of seedlings to detect vigor differences among broccoli seed lots and compare them with other traditionally used vigor tests. Computerized image analysis were performed by the Seed Vigor Imaging System (SVIS®), using 3-day-old seedlings and the results were compared to germination at first count, seedling emergence,
accelerated aging and electrical conductivity tests. Evaluations were performed in three experimental periods (before storage, 6 and 12 months of storage at 20 °C and 45-50% RH). A completely randomized design with eight replications of 25 seeds was used. Data were submitted to analysis of variance and means were compared by Scott-Knott test at 5% error probability. It is concluded that it is possible to detect vigor differences among broccoli seed lots by the computerized image analysis of seedlings with SVIS®, similarly to traditional vigor tests.
Index terms: Brassica oleraceae L., seedling length, vigor.
Análise computadorizada de imagens de plântulas na avaliação do vigor de
sementes de brócolis
RESUMO - A análise computadorizada de imagens de plântulas se apresenta como técnica eficiente na avaliação da qualidade de lotes de sementes de várias espécies, sendo um método de rápida resposta, com metodologia de simples execução e
reprodução. Objetivou-se com esta pesquisa verificar a possibilidade de utilização da análise computadorizada de imagens de
plântulas na detecção de possíveis diferenças de vigor entre lotes de sementes de brócolis e comparar com os testes de vigor tradicionalmente utilizados. Foram utilizadas sementes de dois cultivares, Piracicaba Precoce e Ramoso Santana, representados
por dez lotes de cada. A pesquisa consistiu da utilização do sistema computadorizado de imagens de plântulas (Seed Vigor Imaging System - SVIS®) para detectar possíveis diferenças de vigor de sementes de brócolis durante o armazenamento, por doze meses, com três avaliações (antes do armazenamento, 6 e 12 meses de armazenamento a 20 ºC e 45-50% UR). O delineamento experimental utilizado foi o inteiramente casualizado, com oito repetições de 25 sementes. Os dados referentes
às avaliações foram submetidos à análise de variância e as comparações de médias realizadas pelo teste de Scott-Knott ao
nível de 5% de probabilidade de erro. É possível detectar diferenças de vigor entre lotes de sementes de brócolis pela análise
computadorizada de imagens de plântulas, com o SVIS®, de forma semelhante aos testes tradicionais de vigor.
Introduction
The production of broccoli seeds (Brassica oleraceae L. var. italica Plenk) tends to follow the plant growth system itself, which is undetermined. This species is characterized by presenting progressive flowering, fruiting and seed ripening throughout its cycle, allowing several harvests during some months of the year. Thus, after the harvest, in the same seeds lot it is possible to find seeds at different ripening stages (Lewis and Welbaum, 1996). This results in a seed lot with lower vigor, due to the unevenness of the characteristics related to the internal morphology of seeds.
The production of vegetable seeds is carried out by companies that have a high technological level, and aim at selling seeds with a high physiological potential. Thus, it is fundamental to use effective techniques to determine seed vigor, as they allow a reliable estimate of the physiological potential and the identification of differences between lots with similar germination.
Currently, computerized analysis of seedlings have shown high efficiency in the evaluation of seed vigor. One of the first systems proposed for this purpose was developed for the evaluation of lettuce seedlings and it was called Seed Vigor Imaging System (SVIS®) (Sako et al., 2001). The efficiency of SVIS® has already been demonstrated by researches on the seed vigor evaluation of several species from large crops and vegetables, such as soybean (Hoffmaster et al., 2003; Hoffmaster et al., 2005; Marcos-Filho et al. 2009), maize (Hoffmaster et al., 2005; Mondo et al., 2011), melon (Marcos-Filho et al., 2006), pumpkin (Silva et al., 2014), eggplant (Silva and Cícero, 2014a), and tomato (Silva and Cícero, 2014b).
Considering that the inclusion of new approaches depends directly on the research, image analysis is a recent alternative to help understanding different aspects of seed development, referring mainly to morphological aspects, and providing consistent information quickly and without the influence of the seed analyst’s subjectivity (Chiquito et al., 2012; Marcos-Filho, 2015).
Thus, computerized analyses of seedling images may be promising in determining the physiological potential of seeds from other species that were not contemplated by research yet.
Given the economic importance and the high technology used in the production of broccoli seeds, it is possible to observe a lack of methods determining the vigor of seed lots in a fast and safe way. Therefore, this research was conducted to verify the efficiency of the Seed Vigor Imaging System (SVIS®) in detecting vigor differences among broccoli seed lots and to relate the results to those from other traditionally used vigor tests.
Material and Methods
The research was conducted at the Image Analysis Laboratory and Seed Analysis, of the Agriculture College “Luiz de Queiroz”, University of São Paulo (LPV/ESALQ/ USP), in Piracicaba-SP, Brazil. Two broccoli cultivars were used, Piracicaba Precoce and Ramoso Santana, represented by ten lots each. Seeds were stored for 12 months in impermeable containers, kept in a controlled environment with a temperature of 20 ± 1 °C and relative air humidity of 45-50%. Evaluations were carried out in three experimental periods: before storage and after six and 12 months of storage.
For the computerized analysis of seedlings, sowing was performed on a sheet of blue blotting paper, previously dampened with a water volume equivalent to 2.5 times the weight of the dry substrate, using plastic boxes (11.0 x 11.0 x 3.5 cm), kept in a germinator, in the dark, under an alternating temperature of 20-30 °C (Brasil, 2009). The digitalization of the seedling images was performed three days after sowing.
Seedling images were obtained through an HP Scanjet 200 scanner, assembled in an inverted way inside a 60 x 50 x 12 cm aluminum box and the scanning resolution of 300 dpi. The obtained images were analyzed by the Seed Vigor Imaging System (SVIS®) software. After the images were processed in the SVIS®, vigor (VI), seedling development uniformity (UI) and seedling length (SL) indexes were obtained, as described by Hoffmaster et al. (2003). In order to obtain seedling length, data were converted from pixels to millimeters.
For the seedling analysis, software parameters were adjusted using a combination of growth parameters (70% contribution) and seedling uniformity (30% contribution) and a maximum seedling size equal to 7.0 cm.
on commercial substrate used to produce vegetable seedlings (Plantmax®), in polystyrene trays kept in a greenhouse. Daily counts emerged seedlings were performed up to ten days after sowing and the emergence speed index (ESI) was calculated according to Maguire (1962). The emergence percentage was determined by the total number of seedlings emerged until the last count. Accelerated aging: 1.0 g of seeds were distributed evenly on aluminum sheets adapted to the broccoli seed size and coupled in a plastic box (11.0 x 11.0 x 3.5 cm) containing 40 mL of distilled water. The capped boxes were taken to an aging chamber (Water Jacketed CO2 Incubator), where they remained at 42 °C ± 0.3 °C for 48 hours (Tunes et al., 2012). Afterwards, they were submitted to the germination test and evaluated five days after sowing. Electrical conductivity: the method described by Mello et al. (1999) was used. Seeds with known masses were immersed in 25 mL of distilled water and kept in a B.O.D-type incubator at 25 °C for six hours. The electrical conductivity of the imbibition solution was determined in a DIGIMED-type DM-31 model conductivity meter, and the results were expressed as μS.cm-1.g-1 of seeds.
A completely randomized design was used. Tests of variance and error normality were performed, with no data transformation required. The obtained data were submitted to analysis of variance and the means were compared by Scott-Knott test at 5% error probability.
Results and Discussion
The mean water content of the seeds showed little variation in the studied periods. It was lower than 2%; thus, with no interference in the obtained results. After seed aging, the variation among the lots was higher, approximately 10% (Table 1). However, the observed values are within the expected ones for the species, according to Mendonça et al. (2000). During the accelerated aging test, small seeds absorb water faster, resulting in a greater variation of the water content (Powell, 1995; Marcos-Filho, 2015).
For the cultivar Piracicaba Precoce, in the first evaluation period, the best performance as for germination percentage was observed for lots 1, 5, 6, 7, 8 and 9. Lots 6 and 8 presented values below 80% of germination which is less than the required minimum to sell certified broccoli seeds. The lowest germination was observed for lot 2, considered to have the lowest physiological quality (Table 2).
According to traditionally used vigor tests, for the cultivar Piracicaba Precoce, lots 1, 7 and 9 presented similar behavior, except for the accelerated aging (Table 2); they were the ones with the greatest vigor. An intermediate behavior was observed for lots 5, 6 and 8, where there was high variation in the test results.
Among lots 3, 4 and 10, the lot 10 may be classified as
Table 1. Mean water content of broccoli seeds at the beginning of each evaluation period and after seed aging, for the two analyzed cultivars, Piracicaba Precoce and Ramoso Santana.
Cultivar Lots Water content Water content (AA)
1st Period 2nd Period 3rd Period 1st Period 2nd Period 3rd Period
Piracicaba Precoce
L1 5.61 6.46 6.28 29.96 24.98 26.46
L2 5.47 6.19 6.28 28.63 25.56 25.66
L3 5.44 6.40 6.17 30.15 28.14 26.32
L4 5.00 5.82 5.74 26.06 24.76 24.50
L5 5.20 5.78 5.62 26.12 23.22 22.83
L6 5.32 5.83 5.88 28.74 23.28 23.14
L7 5.71 5.66 5.69 24.91 23.72 22.17
L8 5.35 5.97 5.96 27.81 21.77 22.07
L9 5.05 5.96 5.75 29.55 24.30 23.22
L10 5.57 5.74 5.70 31.16 26.40 24.76
Ramoso Santana
L1 5.15 5.78 6.02 27.17 24.86 22.57
L2 4.78 5.36 5.54 26.41 25.11 23.01
L3 4.49 5.15 5.39 26.59 24.35 23.13
L4 4.15 5.31 5.29 28.66 26.97 23.79
L5 3.87 4.55 4.78 26.91 25.93 23.04
L6 4.28 5.11 5.23 25.30 25.48 23.55
L7 4.27 5.07 5.17 26.19 25.53 22.26
L8 4.63 5.37 5.66 26.17 24.76 22.93
L9 4.15 4.96 5.07 27.56 26.46 23.20
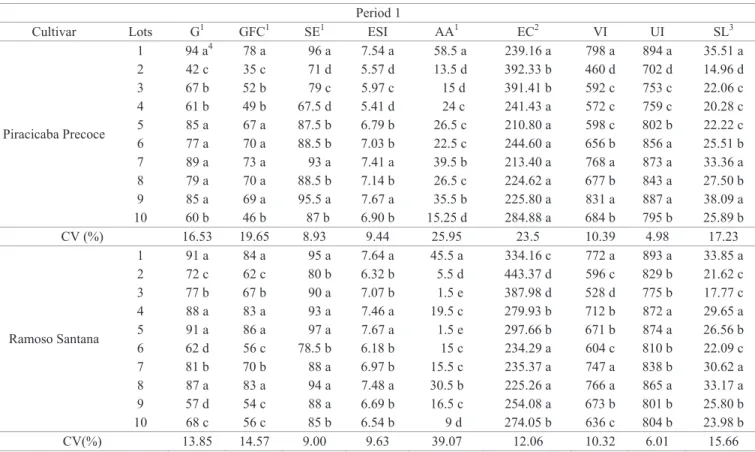
Table 2. Mean values for germination (G), germination at first count (GFC), seedling emergence (SE), emergence speed index (ESI), accelerated aging (AA), electrical conductivity (EC), vigor index (VI), seedling development uniformity index (UI) and seedling length (SL) tests, observed for broccoli seeds, cultivars Piracicaba Precoce and Ramoso Santana, in the first evaluation period.
Period 1
Cultivar Lots G1 GFC1 SE1 ESI AA1 EC2 VI UI SL3
Piracicaba Precoce
1 94 a4 78 a 96 a 7.54 a 58.5 a 239.16 a 798 a 894 a 35.51 a 2 42 c 35 c 71 d 5.57 d 13.5 d 392.33 b 460 d 702 d 14.96 d 3 67 b 52 b 79 c 5.97 c 15 d 391.41 b 592 c 753 c 22.06 c 4 61 b 49 b 67.5 d 5.41 d 24 c 241.43 a 572 c 759 c 20.28 c 5 85 a 67 a 87.5 b 6.79 b 26.5 c 210.80 a 598 c 802 b 22.22 c 6 77 a 70 a 88.5 b 7.03 b 22.5 c 244.60 a 656 b 856 a 25.51 b 7 89 a 73 a 93 a 7.41 a 39.5 b 213.40 a 768 a 873 a 33.36 a 8 79 a 70 a 88.5 b 7.14 b 26.5 c 224.62 a 677 b 843 a 27.50 b 9 85 a 69 a 95.5 a 7.67 a 35.5 b 225.80 a 831 a 887 a 38.09 a 10 60 b 46 b 87 b 6.90 b 15.25 d 284.88 a 684 b 795 b 25.89 b
CV (%) 16.53 19.65 8.93 9.44 25.95 23.5 10.39 4.98 17.23
Ramoso Santana
1 91 a 84 a 95 a 7.64 a 45.5 a 334.16 c 772 a 893 a 33.85 a 2 72 c 62 c 80 b 6.32 b 5.5 d 443.37 d 596 c 829 b 21.62 c 3 77 b 67 b 90 a 7.07 b 1.5 e 387.98 d 528 d 775 b 17.77 c 4 88 a 83 a 93 a 7.46 a 19.5 c 279.93 b 712 b 872 a 29.65 a 5 91 a 86 a 97 a 7.67 a 1.5 e 297.66 b 671 b 874 a 26.56 b 6 62 d 56 c 78.5 b 6.18 b 15 c 234.29 a 604 c 810 b 22.09 c 7 81 b 70 b 88 a 6.97 b 15.5 c 235.37 a 747 a 838 b 30.62 a 8 87 a 83 a 94 a 7.48 a 30.5 b 225.26 a 766 a 865 a 33.17 a 9 57 d 54 c 88 a 6.69 b 16.5 c 254.08 a 673 b 801 b 25.80 b 10 68 c 56 c 85 b 6.54 b 9 d 274.05 b 636 c 804 b 23.98 b
CV(%) 13.85 14.57 9.00 9.63 39.07 12.06 10.32 6.01 15.66
1Means in percentage; 2Means in μS.cm-1.g-1 of seeds; 3Means in mm; 4Means followed by the same letter in the columns for each cultivar do not differ among
themselves by Scott-Knott test at 5% error probability.
“intermediate vigor”, while lots 3 and 4 as “low vigor”. Lot 2 presented the worst performance in all the vigor tests performed (Table 2), being classified as having the lowest vigor.
For the cultivar Ramoso Santana, the lots presented four different classes of germination percentage. Lots 1, 4, 5 and 8 had the best performance, with a germination higher than 86%. Lots 3 and 7 presented similar behavior, which placed them in an intermediate position. The worst performance was observed for lots 2, 6, 9 and 10 (Table 2).
As for the traditional vigor tests, for cultivar Ramoso Santana, lots 1 and 8 showed the best performance. Other lots presented a high variation, which made it difficult to classify them. However, lots 3, 4, 5 and 7 showed an intermediate behavior, and, even presenting proper values for some vigor tests, the joint analysis of all tests ranked lots 2, 6, 9 and 10 as being of worse performance, characterizing them as of lower vigor (Table 2).
In some cases, mainly in lots with an intermediate behavior, divergent results are obtained in vigor tests. This
raises doubts about their validation to classify some lots. It is important to highlight that each test evaluates different aspects of the seeds. The accelerated aging, for example, expresses seed performance after a period of high temperature and relative air humidity, thus interfering with the storage potential of the lots (Torres and Marcos-Filho, 2003). The electrical conductivity test evaluates the reorganization capacity of cell membranes so that the more advanced it is the deterioration, slower it is the restructuring during imbibition, thus the greater is the electrical conductivity of the solution the lower is the seed quality (Panobianco and Vieira, 2007). Therefore, lots of different vigor levels may be classified differently by these tests (Marcos-Filho, 2015).
vigorous ones. Lots 5, 6, 8 and 10 presented an intermediate behavior, considering that there was variation among the indexes generated by the SVIS® software. On the other hand, lots 2, 3 and 4 presented the worst performance, being classified as having the lowest vigor (Table 2).
For the cultivar Ramoso Santana, those classified as the most vigorous by the computerized analysis of seedling images were lots 1, 4, 7 and 8. Lots 5 and 9 showed an intermediate behavior. Lots 2, 3, 6 and 10 were classified as less vigorous (Table 2).
In the second evaluation period, as for germination percentage, there was a different lot ranking from the one observed in the first evaluation period for the cultivar Piracicaba Precoce. Lots 1, 7 and 9 presented the highest germination percentages and lots 5, 6, 8 and 10 showed an intermediate behavior. These lots, although not presenting the highest germination percentages, are still within the commercialization standards for certified seeds. Lots 2, 3 and 4 showed a lower behavior (Table 3).
As for vigor tests, lots 1, 7 and 9 showed the best performance in all tests (Table 3). Intermediate behaviors were observed for lots 5, 6, 8 and 10, while lots 2, 3 and 4 showed lower vigor (Table 3). Lots were classified in a similar
way in the first and second evaluation periods.
For the cultivar Ramoso Santana, in the second evaluation period, germination also presented a different classification than the one observed in the first period. Lots 1 and 4 presented the highest germination percentages. Lots 5, 7 and 8 showed an intermediate behavior, with 88% of germination. For lots 2 and 3, germination was 81 and 79%, respectively. Those presenting the worst performance were lots 6, 9 and 10, with 71, 65 and 69% of germination, respectively (Table 3).
As for vigor tests, for the cultivar Ramoso Santana, during this evaluation period (Table 3), it was observed that among the groups with similar germination there was small variation among the results. For example, lots 1 and 4 showed the highest vigor, although for lot 4, a lower performance was observed in the accelerated aging test. Lots 5, 7 and 8 showed an intermediate behavior. Lower vigor was found for lots 2, 3, 6, 9 and 10.
Tests such as the electrical conductivity one, for example, showed sensitivity in the stratification of lots from the cultivar Piracicaba Precoce but was not efficient for the cultivar Ramoso Santana. Seedling emergence, emergence speed index and accelerated aging tests showed similar characteristics among lots from the cultivar Piracicaba Precoce, presenting
Table 3. Mean values for germination (G), germination at first count (GFC), seedling emergence (SE), emergence speed index (ESI), accelerated aging (AA), electrical conductivity (EC), vigor index (VI), seedling development uniformity index (UI) and seedling length (SL) tests, observed for broccoli seeds, cultivars Piracicaba Precoce and Ramoso Santana, in the second evaluation period.
Period 2
Cultivar Lots G1 GFC1 SE1 ESI AA1 EC2 VI UI SL3
Piracicaba Precoce
1 96 a4 94 a 96 a 7.46 a 55 a 289.20 a 825 a 893 a 37.99 a
2 71 c 65 c 71 d 5.24 d 8 d 540.25 d 513 e 762 c 15.26 e
3 75 c 73 b 79 c 6.00 c 25 c 424.83 c 661 c 824 b 24.74 c
4 72 c 65 c 67 d 5.13 d 26 c 324.27 b 572 d 770 c 18.91 d
5 82 b 76 b 84 b 6.54 b 38 b 285.11 a 590 d 840 b 21.40 d
6 84 b 79 b 89 b 6.80 b 46 b 319.70 b 665 c 842 b 25.86 c
7 93 a 90 a 93 a 7.34 a 64 a 272. 51 a 760 b 870 a 33.00 b
8 84 b 81 b 88 b 6.94 b 50 b 265.83 a 661 c 857 a 26.20 c
9 92 a 91 a 95 a 7.77 a 63 a 283.71 a 830 a 875 a 37.13 a
10 80 b 77 b 86 b 6.66 b 12 d 390.86 c 657 c 824 b 24.94 c
CV (%) 9.49 10.69 7.08 6.51 30.91 11.76 8.04 4.21 13.03
Ramoso Santana
1 96 a 96 a 94 a 7.64 a 82 a 316.17 a 881 a 910 a 41.01 a
2 81 c 78 c 76 b 5.75 c 31 c 325.22 a 639 c 825 c 23.21 d
3 79 c 78 c 89 a 6.84 b 35 c 335.56 a 608 d 809 c 22.08 d
4 95 a 95 a 92 a 7.49 a 50 b 315.93 a 750 b 894 a 32.41 b
5 88 b 88 b 95 a 7.45 a 35 c 295.62 a 681 c 881 b 27.84 c
6 71 d 71 d 78 b 5.96 c 34 c 295.22 a 569 d 817 c 19.91 e
7 88 b 88 b 88 a 6.84 b 51 b 377.36 a 723 b 867 b 30.35 b
8 88 b 88 b 92 a 7.32 a 44 c 267.21 a 677 c 862 b 27.89 c
9 65 d 65 d 80 b 6.13 c 14 d 294.61 a 621 d 812 c 22.95 d
10 69 d 69 d 80 b 6.21 c 22 d 304.69 a 567 d 789 c 19.01 e
CV (%) 10.23 10.45 8.21 8.57 24.66 21.53 7.4 3.83 11.97
1Means in percentage; 2Means in μS.cm-1.g-1 of seeds; 3Means in mm; 4Means followed by the same letter in the columns for each cultivar do not differ among
only small differences. For the cultivar Ramoso Santana, the result variation in these tests was higher among the lots.
As for the computerized analysis of seedling images, in the second evaluation period (Table 3), it was observed for the cultivar Piracicaba Precoce that lots 1 and 9 maintained the same classification obtained by traditional vigor tests, behaving like the most vigorous lots. However, lot 7 was classified as an intermediate one. All the other lots were classified as having lower performances, based on the values observed among the indexes generated by the SVIS® (Table 3).
As for the cultivar Ramoso Santana, a different classification was also verified between vigor tests and computerized analysis of seedling images. Only lot 1 showed a higher vigor in relation to the others. Lot 4 was classified as having an intermediate behavior. For lot 7, the intermediate behavior classification was adopted, in which high levels of vigor and uniformity and high seedling lengths were observed; however, these values did not present maximum potential (Table 3).
The other lots were considered as having lower vigor, given the low or intermediate values observed for seedling vigor, uniformity and length indexes. According to the observed results, it is possible to suggest that lots 6 and 10 presented the worst performance among all analyzed lots (Table 3).
Thus, it is possible to infer that the computerized image analysis of broccoli seedlings in the second evaluation period provided a proper evaluation of seed vigor, since lot stratification was performed efficiently by the SVIS® indexes. Marcos-Filho (2015) states that vigor, uniformity and seedling growth indexes are considered consistently comparable to the tests that are traditionally used to evaluate vigor.
In the third evaluation period (Table 4), for the cultivar Piracicaba Precoce, lots 1, 6, 7, 8 and 9 presented a high germination percentage, even after 12 months of storage. Lot 5, even with a different behavior than the aforementioned ones, still presented a high germination percentage, with 86%. On the other hand, lots 3, 4 and 10 presented lower germination in relation to the aforementioned lots. The worst germination
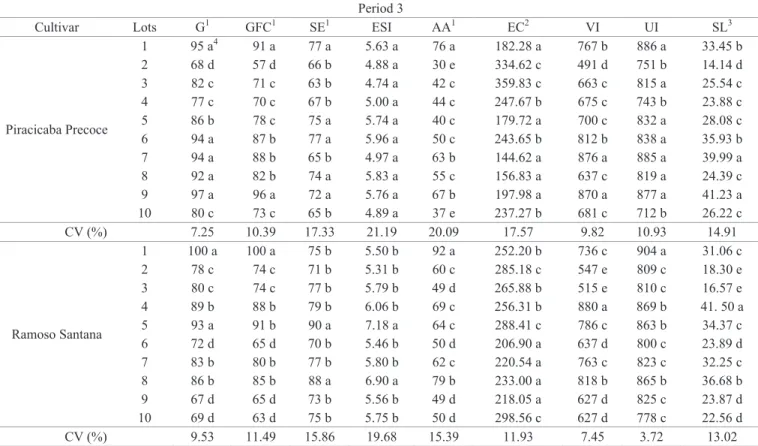
Table 4. Mean values for germination (G), germination at first count (GFC), seedling emergence (SE), emergence speed index (ESI), accelerated aging (AA), electrical conductivity (EC), vigor index (VI), seedling development uniformity index (UI) and seedling length (SL) tests, observed for broccoli seeds, cultivars Piracicaba Precoce and Ramoso Santana, in the third evaluation period.
Period 3
Cultivar Lots G1 GFC1 SE1 ESI AA1 EC2 VI UI SL3
Piracicaba Precoce
1 95 a4 91 a 77 a 5.63 a 76 a 182.28 a 767 b 886 a 33.45 b
2 68 d 57 d 66 b 4.88 a 30 e 334.62 c 491 d 751 b 14.14 d
3 82 c 71 c 63 b 4.74 a 42 c 359.83 c 663 c 815 a 25.54 c
4 77 c 70 c 67 b 5.00 a 44 c 247.67 b 675 c 743 b 23.88 c
5 86 b 78 c 75 a 5.74 a 40 c 179.72 a 700 c 832 a 28.08 c
6 94 a 87 b 77 a 5.96 a 50 c 243.65 b 812 b 838 a 35.93 b
7 94 a 88 b 65 b 4.97 a 63 b 144.62 a 876 a 885 a 39.99 a
8 92 a 82 b 74 a 5.83 a 55 c 156.83 a 637 c 819 a 24.39 c
9 97 a 96 a 72 a 5.76 a 67 b 197.98 a 870 a 877 a 41.23 a
10 80 c 73 c 65 b 4.89 a 37 e 237.27 b 681 c 712 b 26.22 c
CV (%) 7.25 10.39 17.33 21.19 20.09 17.57 9.82 10.93 14.91
Ramoso Santana
1 100 a 100 a 75 b 5.50 b 92 a 252.20 b 736 c 904 a 31.06 c
2 78 c 74 c 71 b 5.31 b 60 c 285.18 c 547 e 809 c 18.30 e
3 80 c 74 c 77 b 5.79 b 49 d 265.88 b 515 e 810 c 16.57 e
4 89 b 88 b 79 b 6.06 b 69 c 256.31 b 880 a 869 b 41. 50 a
5 93 a 91 b 90 a 7.18 a 64 c 288.41 c 786 c 863 b 34.37 c
6 72 d 65 d 70 b 5.46 b 50 d 206.90 a 637 d 800 c 23.89 d
7 83 b 80 b 77 b 5.80 b 62 c 220.54 a 763 c 823 c 32.25 c
8 86 b 85 b 88 a 6.90 a 79 b 233.00 a 818 b 865 b 36.68 b
9 67 d 65 d 73 b 5.56 b 49 d 218.05 a 627 d 825 c 23.87 d
10 69 d 63 d 75 b 5.75 b 50 d 298.56 c 627 d 778 c 22.56 d
CV (%) 9.53 11.49 15.86 19.68 15.39 11.93 7.45 3.72 13.02
1Means in percentage; 2Means in μS.cm-1.g-1 of seeds; 3Means in mm; 4Means followed by the same letter in the columns for each cultivar do not differ among
performance was observed for lot 2, with 68% germination. In this evaluation period, compared to the traditionally used vigor tests, there was a change in the classification of some lots from the cultivar Piracicaba Precoce in relation to the second evaluation period. As for the cultivar Ramoso Santana, changes in the classification of lots were more significant, suggesting that the storage potential of this cultivar is lower. In this evaluation period, results obtained through vigor tests also presented divergence between tests, mainly for lots with intermediate performances, making the classification of certain lots difficult.
For the cultivar Piracicaba Precoce, lots 1 and 9 presented the best performance in most vigor tests, except for lot 9 in the accelerated aging test. Lot 5, 6, 7 and 8 exhibited an intermediate behavior. As for lot 8, although good results were observed for most tests, the germination at first count and accelerated aging presented lower performances (Table 4).
Low vigor results were verified for lots 3, 4 and 10, as observed in previous periods. Lot 2 presented the lowest values for germination at first count and accelerated aging tests and high values for electrical conductivity. These lots could be classified as the ones with the worst performance, therefore with the lowest vigor (Table 4).
Cultivar Ramoso Santana (Table 4) presented higher result variation between the evaluation periods. Within each period, the divergence between the vigor test results was also higher, compared to the cultivar Piracicaba Precoce. The classification among lots according to traditional tests was not similar to the one established in the second evaluation period.
Lot 1 presented higher values for germination at first count and accelerated aging, being classified as having higher vigor. Lot 5 presented high results in seedling emergence and emergence speed index tests; however, the observed values for accelerated aging and electrical conductivity were not among the best, so this lot was classified as having an intermediate behavior. Lots 4, 7 and 8 were also classified as intermediate behavior (Table 4). Lots 2, 3, 6, 9 and 10 presented the same classification that was determined in the first and second evaluation periods, being classified as having lower vigor. As for lots 2 and 3, satisfactory results were observed only for emergence and seedling emergence rate index and for lot 3, low values were observed for the electrical conductivity test. For lots 6, 9 and 10 differences were observed only for the accelerated aging test, in which only lot 10 presented a lower result (Table 4).
The emergence speed index did not provide lot stratification for the cultivar Piracicaba Precoce. For Ramoso Santana, this test differentiated lots 5 and 8 as being superior to the others, proving to be not adequate for lot classification
of broccoli seeds after a long storage period.
As for the computerized image analysis of seedlings, in the third evaluation period, for the cultivar Piracicaba Precoce, there was a different classification compared to the one adopted through traditional tests. Lots 7 and 9 were classified as having the best performance. For lot 1, although high levels of vigor and uniformity were observed and there was a smaller reduction in seedling length. Therefore, this lot did not maintain the same classification of traditional tests, being considered of intermediate vigor (Table 4).
Lot 6 showed high seedling uniformity, which is a desirable characteristic for vegetables; however, vigor and seedling length values characterized the lot as intermediate performance. Lot 5 showed high seedling uniformity; however, low values for vigor and seedling length indexes characterized it as a lower performance one. Lots 2, 3, 4, 8, and 10 showed lower vigor (Table 4).
For the cultivar Ramoso Santana (Table 4), stratification presented a different result from the one highlighted by traditional tests. Only lot 4 stood out as the one with the greatest vigor in relation to the others. Lots 2 and 3 showed lower vigor, and the other ones presented an intermediate behavior.
Considering the results observed in different evaluation periods, it is possible to state that the computerized image analysis of seedlings can be used as an alternative method to evaluate the vigor of different broccoli seed lots. The SVIS® software was also efficient in the analysis of other species, such as: soybean (Hoffmaster et al., 2003; Marcos-Filho et al., 2009); maize (Otoni and McDonald, 2005; Mondo et al., 2011), cucumber (Chiquito et al., 2012); eggplant (Silva and Cicero, 2014a); tomato (Silva and Cicero, 2014b); melon (Marcos-Filho et al., 2006), among other species. It is worth highlighting that the computerized image analysis of seedlings is based on seedling growth and uniformity, whereas vigor tests such as accelerated aging, seedling emergence, cold test, and others, do not take into account the size and uniformity of seedling development, since the results are reported in percentages of normal seedlings or emergent seedlings; the differences among evaluation methods may explain the possible differences in lot ranking, especially those presenting intermediate behaviors.
Another important aspect is the speed in obtaining results when using the computerized image analysis of seedlings, which in the case of broccoli seeds, used in this research, can be conducted with seedlings obtained three days after the installation of the germination test.
Conclusion
Seed Vigor Imaging System, is efficient in evaluating the vigor of broccoli seeds, presenting similarities to the results obtained in other tests that are traditionally used for the same purpose.
Acknowledgments
To the “Fundação de Amparo à Pesquisa do Estado de São Paulo” (FAPESP) for granting scholarship to the first author and for all the financial support to develop this research.
References
BRASIL. Ministério da Agricultura, Pecuária e Abastecimento. Regras para análise de sementes. Ministério da Agricultura, Pecuária
e Abastecimento. Secretaria de Defesa Agropecuária. Brasília: MAPA/ACS, 2009. 395p. http://www.agricultura.gov.br/arq_editor/ file/2946_regras_analise__sementes.pdf
CHIQUITO, A.A.; GOMES-JUNIOR, F.G.; MARCOS-FILHO, J.
Assessment of physiological potential of cucumber seeds using the
software Seedling Vigor Imaging System (SVIS). Revista Brasileira
de Sementes, v.34, n.2, p.255-263, 2012. http://www.scielo.br/pdf/
rbs/v34n2/10.pdf
HOFFMASTER, A.L.; FUJIMURA, K.; MCDONALD, M.B.; BENNET,
M.A. An automated system for vigour testing three-day-old soybean seedlings. Seed Science and Technology, v.31, p.701-713, 2003. http:// www.ingentaconnect.com/content/ista/sst/2003/00000031/00000003/
art00019
HOFFMASTER, A. L.; XU, L.; FUJIMURA, K.; McDONALD, M.B.; BENNET, M. A.; EVANS, A.F. The Ohio State University seed vigor imaging system (SVIS) for soybean and corn seedlings.
Seed Technology, v.27, n.2, p.243-247, 2005. http://europepmc.org/
search/?page=1&query=AUTH:%22Hoffmaster+AF%22
LEWIS, W.J.; WELBAUM, G.E. Changes in broccoli Brassica oleracea L. seed weight, viability, and vigor during development and following
drying and priming. Seed Science and Technology, v.24, p.127-137, 1996.
http://cat.inist.fr/?aModele=afficheN&cpsidt=3142837
MAGUIRE, J.D. Speed of germination-aid selection and evaluation for
seedling emergence and vigor. Crop Science, v.2, n.2, p.176-177, 1962.
http://dx.doi.org/10.2135/cropsci1962.0011183X000200020033x MARCOS-FILHO, J. Seed vigor testing: an overview of the past,
present and future perspective. Scientia Agrícola, v.72, n.4, p. 365-374,
2015. http://www.scielo.br/pdf/sa/v72n4/0103-9016-sa-72-4-0363.pdf MARCOS-FILHO, J.; BENNETTI, M.A; McDONALD, M.B.; EVANS, A.F.; GRASSBAUGH, E.M. Assessment of melon seed
vigour by an automated computer imaging system compared to traditional procedures. Seed Science and Technology, v.34, n.2,
p.485-497, 2006. http://www.ingentaconnect.com/content/ista/
sst/2006/00000034/00000002/art00023
MARCOS-FILHO, J.; KIKUTI, A.L.P.; LIMA, L.B. Métodos
para avaliação do vigor de sementes de soja, incluindo a análise computadorizada de imagens. Revista Brasileira de Sementes, v.31,
p.102-112, 2009. http://www.scielo.br/pdf/rbs/v31n1/a12v31n1.pdf
MELLO, S.C.; SPINOLA, M.C.M.; MINAMI, K. Métodos de avaliação da qualidade fisiológica de sementes de brócolos. Scientia
Agrícola, v.56, n.4, p.1151-1155, 1999. http://www.scielo.br/scielo.
php?script=sci_arttext&pid=S0103-90161999000500017
MENDONÇA, E.A.F.; RAMOS, N.P.; FESSEL, S.A.; SADER, R. Teste
de deterioração controlada em sementes de brocoli (Brassica oleraceae
L.) var. italica. Revista Brasileira de Sementes, v. 22, n.1, p.280-287, 2000.
http://www.abrates.org.br/files/artigos/58984c50f00120.90283889_
artigo39.pdf
MONDO, V.H.V.; DIAS, M.A.N.; McDONALD, M.B. Seed vigor imaging system for two-day-old corn seedling evaluation.
Seed Technology, v.33, p.191-196, 2011. http://www.jstor.org/
stable/23433428?seq=1#page_scan_tab_contents
OTONI, R.R.; MCDONALD, M.B. Moisture and temperature effects on maize and soybean seedlings using the seed vigor imaging
system. Seed Technology, v.27, p.243-247, 2005. https://stjournal. org/volume-27-no-2-2005/
PANOBIANCO, M.; VIEIRA, R.D. Electrical conductivity and deterioration of soybean seeds exposed to different storage
conditions. Revista Brasileira de Sementes, v. 29, n. 2, p.97-105,
2007. http://www.scielo.br/pdf/rbs/v29n2/v29n2a13.pdf
POWELL, A.A. The controlled deterioration test. In: VAN DER VENTER, H.A. (Ed). Seed VigourTesting Seminar. The International
Seed Testing Association, 1995. p.73-87.
SAKO, Y.; McDONALD, M.B.; FUJIMURA, K.; EVANS, A.F.; BENNETT, M.A. A system for automated seed vigor assessment.
Seed Science and Technology, v.29, p.625-636, 2001.
SILVA, P.P.; FREITAS, R.A.; CICERO, S.M.; MARCOS-FILHO, J.; NASCIMENTO, W.M. Análise de imagens no estudo morfológico e fisiológico de sementes de abóbora. Horticultura Brasileira, v.32,
p.210-214, 2014.
http://www.scielo.br/pdf/hb/v32n2/0102-0536-hb-32-02-00210.pdf
SILVA, V.N.; CÍCERO, S.M. Análise de imagens de plântulas para avaliação do potencial fisiológico de sementes de berinjela.
Horticultura Brasileira, v.32, n.2, p.145-151, 2014a. http://www.
scielo.br/pdf/hb/v32n2/0102-0536-hb-32-02-00145.pdf
SILVA, V.N.; CÍCERO, S.M. Image seedling analysis to evaluate
tomato seed physiological potential. Revista Ciência Agronômica,
v.45, n.2, p.327-334, 2014b. http://www.ccarevista.ufc.br/seer/ index.php/ccarevista/article/view/2807
TORRES, S.; MARCOS -FILHO, J. Accelerated aging of melon
seeds. Scientia Agrícola, v.60, n.1, p.77-82, 2003. http://www.scielo. br/pdf/sa/v60n1/14546.pdf
TUNES, L.M.; TAVARES, L.C.; RUFINO, C.A.; BARROS, A.C.S.A.; MUNIZ, M.F.B.; DUARTE, V.B. Envelhecimento
acelerado em sementes de brócolis (Brassica oleraceae L. var.