www.ccarevista.ufc.br ISSN 1806-6690
Image seedling analysis to evaluate tomato seed physiological
potential
1Análise de imagens de plântulas para avaliação do potencial fisiológico de sementes
de tomate
Vanessa Neumann Silva2* e Silvio Moure Cicero3
ABSTRACT - Computerized seedling image analysis are one of the most recently techniques to detect differences of vigor between seed lots. The aim of this study was verify the hability of computerized seedling image analysis by SVIS® to detect differences of vigor between tomato seed lots as information provided by traditionally vigor tests. Ten lots of tomato seeds, cultivar Santa Clara, were stored for 12 months in controlled environment at 20 ± 1 °C and 45-50% of relative humidity of the air. The moisture content of the seeds was monitored and the physiological potential tested at 0, 6 and 12 months after storage, with germination test, first count of germination, traditional accelerated ageing and with saturated salt solution, electrical conductivity, seedling emergence and with seed vigor imaging system (SVIS®). A completely randomized experimental design was used with four replications. The parameters obtained by the computerized seedling analysis (seedling length and indexes of vigor and seedling growth) with software SVIS® are efficient to detect differences between tomato seed lots of high and low vigor.
Key words:Solanum lycopersicum L.. SVIS. Vigor.
RESUMO - A análise computadorizada de imagens de plântulas é uma das técnicas mais recentes para detectar diferenças de vigor entre lotes de sementes. O objetivo deste trabalho foi verificar a possibilidade de utilização do sistema computadorizado de análise de imagens de plântulas SVIS® (Seed Vigor Imaging System) para detectar diferenças de vigor entre lotes de sementes de tomate em comparação as informações fornecidas por testes de vigor tradicionalmente utilizados. Dez lotes de sementes de tomate, cultivar Santa Clara, foram armazenados por 12 meses em ambiente controlado a 20 ± 1 °C e 45-50% de umidade relativa do ar. O teor de água das sementes foi monitorado e o potencial fisiológico avaliado aos 0, 6 e 12 meses após o armazenamento, com os testes de germinação, primeira contagem de germinação, envelhecimento acelerado tradicional e com solução saturada de sal, condutividade elétrica, emergência de plântulas e com o sistema de análise computadorizada de plântulas (SVIS®). O delineamento experimental utilizado foi inteiramente casualizado com 4 repetições. Os parâmetros obtidos na análise computadorizada de plântulas (comprimento de plântulas e índices de vigor e de crescimento de plântulas) com o software SVIS® são eficientes para diferenciar lotes de sementes de tomate de alto e de baixo vigor.
Palavras chave:Solanum lycopersicum L.. SVIS. Vigor.
*Autor para correspondência
1Recebido para publicação em 26/02/2013; aprovado em 16/12/2013
Parte da Tese de Doutorado do primeiro autor apresentada ao Programa de Pós-Graduação em Fitotecnia na Escola Superior de Agricultura ‘Luiz de Queiroz’ da Universidade de São Paulo, Bolsista FAPESP
2Universidade Federal do Pampa, Campus Itaqui, Itaqui-RS, Brasil, [email protected]
3Departamento de Produção Vegetal, Escola Superior de Agricultura ‘Luiz de Queiroz’, Universidade de São Paulo, Piracicaba-SP, Brasil,
INTRODUCTION
The use of high quality seeds is essential to obtaining high quality seedlings. Seed quality can be defined by four components: genetic, sanitary, physic and physiological, and the last one represents germination capacity and seed vigor. The seed quality evaluation is essential in quality control programs, which must employ efficient, low cost and replicable methods. This evaluation is usually made through germination test and can be complemented by vigor tests, especially because germination test, once it is performed under controlled conditions, might overestimate the seed potential.
Vigor tests have been used mainly to identify differences associated to the seed performance during storage or after sowing, trying to highlight more highly efficient lots for establishing the stand under broad
variation of ambient conditions (MARCOS FILHOet al.,
2009). Among the vigor tests most commonly utilized, some are based on determinations of speed and uniformity of seedling growth or manual measurement of their parts. Tests of seedling length based on manual measurement present two limitations at least: results may vary from laboratory to laboratory due to the subject nature of the analysis and take excessive time to acquire results. By automating these tasks through the use of image processing computer programs, these two limitations can
be addressed (HOFFMASTERet al., 2003).
Recently, for seed vigor evaluation based on seedling growth, Sako et al. (2001) developed at Ohio State University/USA an automatized system for lettuce seed vigor evaluation, named Seed Vigor Imaging System (SVIS®); for that, scanned seedlings, which parts were identified and marked by a specific software, were worked on. After image processing on a computer, the following data were simultaneously obtained: the length of the primary root, of the hypocotyl and of the whole plant, besides the ratio root/hypocotyl and parameters based on speed and uniformity of growth. This kind of analysis has been making possible the determination of seed vigor
of other species such as wheat (SILVA et al., 2012a),
sweet corn (ALVARENGA et al., 2012), cucumber
(CHIQUITO et al., 2012), sunn hemp (SILVAet al.,
2012b), soybean (MARCOS FILHO et al., 2009),
melon (MARCOS FILHO et al., 2006), evaluation of
the effect of priming on sweet corn seeds (GOMES
JUNIORet al., 2009) and the evaluation of the effect
of fungicide treatments in the castor bean seed quality
(KOBORI et al., 2010) and peanut (MARCHI et al.,
2011). The method consists on the caption of multiple digital images, by scanning, of seedling, which is next processed on a computer, generating values which, collectively, represent the physiological potential of
the seeds. Data include seedling lengths and vigor
and growth indexes (SAKOet al., 2001). After image
processing, the software automatically generates values which refer to the rate of vigor (values from 0 to 1000, in direct proportion to the vigor) and of growth (also from 100 to 1000).
Nowadays, there are not researches related to the use of this technique for tomato seed quality evaluations, therefore this paper had the aim to verify the hability
of computerized seedling image analysis by SVIS® to
detect differences of vigor between tomato seed lots as information provided by traditionally vigor tests.
MATERIAL AND METHODS
The research was performed at the Laboratories of Seed and Image Analysis of the Crop Production Department of the Agriculture College “Luiz de Queiroz” at Sao Paulo University, located in Piracicaba, SP, Brazil. Ten tomato seed lots, cultivar Santa Clara, treated with Thiram were stored in aluminium packages, hermetically sealed, in a controlled environment room at 20 ± 1 °C and 45-50% of relative humidity of the air, after verification of seed moisture content. Physiological seed potential was evaluated through tests described as follows.
Moisture content: the oven method was adopted, at 105 3 ºC, for 24 hours with two samples of 1.0 g seeds per each lot and the results were registered in percentages (wet basis) (BRASIL, 2009).
Germination and first counting of germination:four replications of 50 seeds for each lot were distributed over two blotting paper sheets, moisturized with an amount of water equivalent to 2.5 times the dry mass of the subtract, inside plastic boxes (11.0 x 11.0 x 3.5 cm) and exposed to 20-30 °C with 8 hours of light and 16 hours of darkness. The evaluations were performed at 5 and 14 days after sowing (BRASIL, 2009). The results were registered in percentages of normal seedling per each lot. Traditional accelerated ageing: a layer of seeds was distributed over a metal screen attached to a plastic box (11.0 x 11.0 x 3.5 cm) containing 40 ml of distilled water on the bottom. Each box was covered and exposed to 41 °C for 48 hours in an incubator BOD; next, it was determined the seed moisture content and a germination test (four replications) was performed with evaluations after five days (MARCOS
FILHO, 1999). Saturared salt accelerated ageing:
made similarly to the traditional procedure, however with the use of 40 ml of saturated NaCl solution instead of water (JIANHUA; McDONALD, 1996).
for each lot were weighted and, following to that, immersed in 75 ml of distilled water, where they were left for 24 hours at 25 °C (ISTA, 1995). The reading of electric conductivity of the solution was made on a conductivemeter branded DIGIMED, model DM-31. The values of the readings were divided by the mass of the seeds and the results were expressed in µS cm-1 g-1
per seed.Seedling emergence: four replications of 50
seeds per lot were sowed on trays containing proper commercial subtract for production of oleraceous seedlings (Plantmax®). At 14 days after the sowing the immersed seedlings were counted (RODO, 1998).
Computerized seedling image analysis by software SVIS®: preliminary tests were at first performed aiming to check the most adequate method for obtaining seedlings for this analysis. Several conditions were tested to obtain seedlings as at 3, 4 and 5 days at 20-30 °C or 25 °C, in rolls of paper towel or paper in plastic box (11.0 x 11.0 x 3.5 cm), with light or darkness. The best condition for obtaining tomato seedlings, which was used in this research, was to submit four replications of 25 seeds for each lot at 20-30 °C in a germination chamber during 4 days in the absence of light in paper towel rolls moisturized with distilled water 2.5 times the mass of the paper.
Next, the seedlings were transferred from the paper towel to a black colored paper sheet being the seedling images obtained through scanning by a machine model HP Scanjet 2410, assembled upside down within an aluminum box operated by the software Photosmart, at a 100 dpi resolution. Next, the images
were analyzed using the software SVIS® (Seed Vigor
Imaging System), installed in a Pentium IV computer operated by Windows XP Professional system. In this analysis, the axis root/hypocotyl of each seedling was marked red, using the software itself. After the analysis
and evaluation of each seedling, the software SVIS®
provided the values for the rate of vigor (VI) and of growth (GI) and seedling length (SL). The data of seedlings length were provided by the software in pixels and were converted to cm, being a pixel considered as equivalent to 0.0254 cm.
The experimental design was completely randomized with four replications. Three evaluation periods were made, at 0, 6 and 12 months after storage. The data were submitted to analysis of variation and comparison of means through the Tukey test at 5% significance. Besides, the type of distribution of percentual data was verified and the Cochran test was applied aiming to check the uniformity of the variance. The data which did not present normal distribution and variance uniformity were changed into arc sen (x/100)1/2.
RESULTS AND DISCUSSION
The data of initial characterization of tomato seed lots can be observed in Table 1. The seed moisture content for the 10 lots varied from 6.2 to 7.7% in the first period; it is desirable, considering that a huge difference between the lots regarding to moisture content, could influence results of vigor, which has not occurred in this research in all periods (Tables 1 and 2).
The percentage of tomato seed germination was similar to all the lots in the first period and over 85% in most of the lots (Table 1); it is important to highlight that lots with a distinct physiological potential may present similar germination, which can be granted to the lack of sensitivity of this test as to identify small differences between lots, considering that the loss of germination capacity is one of the last stages in the process of seeds deterioration (DELOUCHE; BASKIN, 1973). Besides, the germination test is performed in controlled environment, possibly overestimating the potential of the seeds performance.
Despite germination results, vigor tests revealed differences between the lots. However, the lots classification based in vigor levels was not always the same; in general, lots 4 and 9 had a worse performance and lot 3 a better performance in the first period (Table 1). It must be highlighted that the seed vigor is not a single measurable property, like standard germination, but a concept describing several characteristics associated with one or more aspects of seed lot performance (TEKRONY, 2003); therefore, reunion of these information can make the forecast of seeds behavior more efficient.
The computerized seedling analysis with SVIS® was effective to differed tomato seed lots with less or more vigor in the first period of evaluation, based on the three parameters utilized. The best physiological potential of lots 3, 6 and 7 as compared to lot 9 was observed from the vigor index, the same way for lots 3, 6, 7 and 8 as compared to 5 from the growth index and for lot 3 as compared to 9 from seedling length (Table 1). An example of seed imaging analysis by SVIS is presented in Figure 1, in which are highlight the vigor index (555), uniformity of seedling development (998), and total seedling length (indicated by white arrow- 222 pixels).
*Data transformed at arc sin (x/100)1/2.1Means comparison within each column by the Tukey’s test (p<0.05)
As well as computerized seedling analysis, most of vigor tests used only showed differences between lots of higher and smaller potential, not allowing separation of lots of medium vigor. It is important to emphasize that there was not any significant difference in germination speed, evaluated in the first counting of the test, therefore possibly owing to that most lots have
not differed regarding SVIS® indexes and seedling
length, because these parameters are calculated based on speed and uniformity of seedlings growth.
Afterwards, in the second and third period, the germination test showed differences of potential between the lots; in the second period, lots 9 and 10 were better than lot 6 (Table 1), and in the third period, lot 4 was greater than lots 1, 3 and 9 (Table 2). It must be emphasized that in the third period, although the germination percentage of most lots have reached minimal standards for trading in Brazil, the vigor tests showed low physiological potential of these seeds.
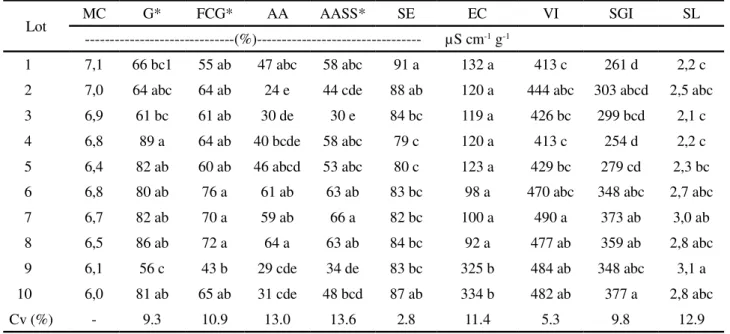
Table1 - Moisture seed content (MC), germination (G), first count germination (FCG), traditional accelerated ageing (AA), saturated salt accelerated ageing (AASS), seedling emergence (SE), electrical conductivity (EC), vigor index (VI), seedling growth index (SGI) and seedling length (SL) of ten tomato seed lots, cultivar Santa Clara, first and second analyzed periods
Lot MC G* FCG* AA AASS* SE EC VI SGI SL
---(%)--- µS cm-1 g-1
---First
period---1 6,2 89 a1 77 ab 46 ab 61 abc 80 b 241 d 599 ab 521 ab 4,0 ab
2 6,3 88 a 60 ab 51 ab 72 ab 84 ab 229 bcd 598 ab 531 ab 3,9 ab
3 6,3 90 a 68 ab 62 a 56 bc 92 a 235 cd 645 a 572 a 4,7 a
4 6,5 91 a 59 b 35 b 68 ab 90 ab 213 abcd 608 ab 525 ab 4,2 ab
5 6,4 84 a 71 ab 52 ab 65 ab 89 ab 216 abcd 572 b 479 b 3,5 ab
6 7,2 87 a 65 ab 58 a 62 abc 84 ab 192 a 640 a 586 a 4,2 ab
7 7,7 89 a 77 ab 59 a 76 a 86 ab 218 abcd 642 a 566 a 4,4 ab
8 7,6 91 a 83 a 53 ab 76 ab 83 ab 204 abc 604 ab 594 a 4,4 ab
9 7,0 86 a 59 b 54 ab 44 c 81 ab 193 ab 554 b 507 ab 2,8 b
10 7,5 89 a 73 ab 65 a 74 ab 83 ab 240 cd 588 ab 517 ab 4,2 ab
CV (%) - 5.7 13.8 17.8 11.6 6.1 6.9 4.4 6.9 18.2
---Second
period---Lot MC G* FCG* AA AASS* SE EC VI SGI SL
---(%)--- µS cm-1 g-1
1 7,7 77 ab1 40 b 51 ab 66 abc 87 bcd 194 e 478 ab 401 ab 2,0 bc
2 7,7 74 ab 44 b 54 ab 73 abc 91 bc 164 d 451 ab 329 bcd 2,0 bc
3 7,5 73 ab 57 ab 55 ab 75 abc 89 bcd 155 cd 481 ab 377 abc 2,1 bc
4 7,3 77 ab 47 b 60 ab 74 abc 90 bc 140 cd 422 b 299 d 1,5 c
5 7,1 77 ab 48 ab 48 b 70 abc 96 a 135 bc 453 ab 323 cd 1,9 bc
6 7,3 68 b 57 ab 55 ab 54 c 83 de 105 a 494 ab 420 a 2,0 bc
7 7,3 76 ab 63 ab 48 b 75 abc 90 bc 110 ab 484 ab 380 abc 2,5 ab
8 7,2 80 ab 58 ab 49 b 81 a 92 ab 107 ab 469 ab 371 abcd 2,3 abc
9 6,5 83 a 73 a 48 b 57 bc 79 e 274 f 516 a 425 a 2,9 a
10 6,5 84 a 73 a 68 a 63 abc 85 cde 290 f 522 a 418 a 3,0 a
*Data transformed at arc sin (x/100)1/2.1Means comparison within each column by the Tukey’s test (p<0.05)
Table 2 - Moisture seed content (MC), germination (G), first count germination (FCG), traditional accelerated ageing (AA), saturated salt accelerated ageing (AASS), seedling emergence (SE), electrical conductivity (EC), vigor index (VI), seedling growth index (SGI) and seedling length (SL) of ten tomato seed lots, cultivar Santa Clara, third analyzed period
Lot MC G* FCG* AA AASS* SE EC VI SGI SL
---(%)--- µS cm-1 g-1
1 7,1 66 bc1 55 ab 47 abc 58 abc 91 a 132 a 413 c 261 d 2,2 c
2 7,0 64 abc 64 ab 24 e 44 cde 88 ab 120 a 444 abc 303 abcd 2,5 abc
3 6,9 61 bc 61 ab 30 de 30 e 84 bc 119 a 426 bc 299 bcd 2,1 c
4 6,8 89 a 64 ab 40 bcde 58 abc 79 c 120 a 413 c 254 d 2,2 c
5 6,4 82 ab 60 ab 46 abcd 53 abc 80 c 123 a 429 bc 279 cd 2,3 bc
6 6,8 80 ab 76 a 61 ab 63 ab 83 bc 98 a 470 abc 348 abc 2,7 abc
7 6,7 82 ab 70 a 59 ab 66 a 82 bc 100 a 490 a 373 ab 3,0 ab
8 6,5 86 ab 72 a 64 a 63 ab 84 bc 92 a 477 ab 359 ab 2,8 abc
9 6,1 56 c 43 b 29 cde 34 de 83 bc 325 b 484 ab 348 abc 3,1 a
10 6,0 81 ab 65 ab 31 cde 48 bcd 87 ab 334 b 482 ab 377 a 2,8 abc
Cv (%) - 9.3 10.9 13.0 13.6 2.8 11.4 5.3 9.8 12.9
Figure 1- Digital images of 4 day-old tomato seedlings, cv. Santa Clara, from seed lot 2, and assessed by the software SVIS®.
Similarly to the initial characterization of the lots, the information obtained in the vigor tests did not rank the lots the same way. Information provided by different tests may be apparently paradoxical but, although unusual, in specific cases some samples of seeds considered more vigorous in a test may be
seen as less vigorous in other tests (CHIQUITOet al.,
2012). Therefore, the seed lots performance in the set of evaluations must be taken into consideration in order to identify the seed vigor for each lot.
Among the obtained results, it is interesting to note that in the first count germination besides separation of lots in vigor levels at all times of analysis, was observed differences between the lots that were not identified in the final count germination, as for example for lot 4, which in all periods of evaluation had a high percentage of normal seedlings, however their speed of germination was smaller than in other lots (Tables 1 and 2). According to Marcos Filho (1999) one of the problems of the utilization of the germination test is that this one does not allow the differentiation of lots regarding germination speed, which can be identified at first counting.
The traditional accelerated ageing provided different results in each period of evaluation, regarding vigor of the lots, as in general it was possible to identify the lots of higher vigor (2, 8 and 10), however, the lots of intermediate behavior and less vigor alternated between periods; although the lots are bunch equally, it is well known that the seeds within a lot and even parts of a same seed deteriorate at different speed (MARCOS FILHO, 2005).
For most of the lots, traditional accelerated ageing provided more stressful conditions for the seeds, as compared to the alternative method (saturated salt solution) which diminished germinate capacity of the seeds (Tables 1 and 2).
The seedling emergence did not allow the identification of differences between lots as occurred at the first germination counting and accelerated ageing in the second period (Table 1); however, it was possible to verify higher vigor in lot 3 as compared to lot 1 in the first period (Table 1), in lot 5 as compared to most of the lots in the second period and in lot 1 as compared to most of the lots in the third period (Table 2).
It is valid to emphasize that in the seedling emergence test only the aerial part of the seedling is checked, differently from germination test, in which, although there was high percentage of immersed seedlings, they presented problems in their roots, which was the main kind of abnormality seen on
germination, and they were not capable of producing useful seedlings for transplant. It is important to remind that this evaluation was made 14 days after sowing and usually the production of tomato seedlings involves at least 30 days.
Besides the already mentioned vigor tests, the computerized seedling analysis by SVIS® was efficient to differ the tomato seed lots in all times of analysis (Tables 1 and 2).
The vigor index revealed higher potential in lots 9 and 10 as compared to lot 4 in the second time (Table 1) and lot 7 as compared to lot 1, 3, 4 and 5 in the third period (Table 2). Similarly to this research, the use of the vigor index was efficient in the evaluation of the physiological
potential of cucumber seeds (CHIQUITO et al., 2012),
crotalaria (SILVA et al., 2012) and melon (MARCOS
FILHOet al., 2006).
Another parameter provided by SVIS®, the growth index, showed a higher vigor in lots 6, 9 and 10 as compared to lots 2, 4 and 5 in the second period (Table 1) and in lot 10, as compared to lots 1, 3, 4 and 5 in the third period (Table 2). The use of growth index was also efficient for the vigor evaluation of
Impatiens wallerana seeds (OAKLEYet al., 2004) in a
system of seedlings images analysis similar to SVIS®. According to the same authors, the evaluation of the seedlings growth after germination can be considered an interesting vigor test. There is a tendency that seedling growth decreases as seed deterioration advances, a process to which seeds are subject from physiological maturity on; it is known that more vigorous seed lots must deteriorate slower than the less vigorous ones. For seeds of maize it was observed that the small rate of growth of deteriorated seeds is related to the decreasing of the expansion and cellular division
growth areas (SVEINSDOTTIRet al., 2009).
Another information obtained through seedling image analysis with SVIS® was the seedlings length, which highlighted a better performance of lots 9 and 10 as compared to most of the lots in the second period (Table 1) and lot 9 as compared to lots 1, 3, 4 and 5 in the third period (Table 2). The seedling length evaluation has been considered efficient to detect differences in the physiological potential of seeds for several species (NAKAGAWA, 1999). Simultaneously, besides this sensitivity, this results can show relation with the
seedlings emergence on the field (VANZOLINIet al.,
Similarly to the rest of the vigor tests, the seedlings images analysis by SVIS® allowed identification of lots with more or less vigor. The identification of lots with low vigor may contribute for the improvement of the efficiency of agricultural production systems, making possible the correct choice of the sowing materials. It is important to highlight that once less vigorous seeds may take more time to establish plants, this might benefit pathogens attack, which ones usually are already present in the soil and this might lead to seedlings damping-off or even seed death. As a consequence, plant stand decreases may occurs, which will directly reflect on production, besides facilitating establishment of weeds, which will compete for nutrients and other essential resources for the development of the plants.
According to Rodo and Marcos Filho (2003), the use of high vigor seeds can be justified to assure the adequate establishment of the stand of plants in different environmental conditions. Besides, the identification of low vigor lots might allow discharge of them and thus reduce costs for seed processing and storage.
Another important aspect which must be mentioned, is that the use of SVIS® is not restricted only to direct comparison of the vigor of different lots through the analysis of seedlings growth, but involves the possibility of its introduction as a complement of
other tests (SEKHARAMet al., 2005).
Companies which produce seeds have the need of developing specific tests which can guarantee the adequate analysis to identify lots with a higher level of quality for trading and efforts must be applied in the future aiming the use of this kind of technologic information, which can be included as a key to global precision and sustainability agriculture, and to the standardized data transfer for seeds analysts for decision making (DELL’ÁQUILA, 2009).
The possibility of using a seeds quality evaluation system which provides accurate, objective and quick information is essential for any seed quality control system and must be a priority of researches. The use of SVIS®, besides the advantages previously mentioned, provide images archiving for later analysis and it is a low cost system, equivalent to germination
test (GOMES JUNIORet al., 2009).
This technology has been commonly used by labs of certifying entities of seeds and production companies in the United States of America, particularly in the State of Ohio, being considered a promising procedure for a safe evaluation of seed vigor for several
cultivated species (MARCOS FILHOet al., 2009).
CONCLUSION
The parameters obtained in the computerized seedlings analysis with the software SVIS® are efficient to differ lots of tomato seeds of low and high vigor.
ACKNOWLEDGEMENTS
The Fundação de Amparo à Pesquisa do estado de São Paulo (Fapesp) for the Ph.D. scholarship granted to the first author and for financing this study.
REFERENCES
ALVARENGA, R.; MARCOS FILHO, J.; GOMES JUNIOR, F. G. Avaliação do vigor de sementes de milho superdoce por meio da análise computadorizada de imagens de plântulas.
Revista Brasileira de Sementes, v. 34, n. 3, p. 488-94, 2012.
BRASIL. Ministério da Agricultura e Reforma Agrária.
Regras para Análise de Sementes. Brasília: SNDA/ DNDV/ CLAV, 2009. 365 p.
CHIQUITO, A. A.; GOMES JUNIOR, F. G.; MARCOS FILHO, J. Assessment of physiological potential of cucumber seeds using the software Seedling Vigor Imaging System® (SVIS®).Revista Brasileira de Sementes, v.34, n. 2, p. 255-263, 2012.
DELL’AQUILA, A. Digital imaging information technology applied to seed germination testing. A review.Agronomy for Sustainable Development, v. 29, n. 1, p. 213-221, 2009.
DELOUCHE, J.C.; BASKIN, C. C. Accelerated aging techniques for predicting the relative storability of seed lots.Seed Science and Technology, v. 1, n. 2, p. 427-52, 1973.
GOMES JUNIOR, F. G. et al. Evaluation of priming effects on sweet corn by SVIS. Seed Technology, v. 31, n. 1, p. 95-100, 2009.
HOFFMASTER, A. L.et al. An automated system for vigour
testing three-day-old soybean seedlings. Seed Science and Technology, v. 31, n. 3, p. 701-713, 2003.
ISTA - INTERNATIONAL SEED TESTING ASSOCIATION.
Handbook of vigour test methods, 117 p. 1995.
JIANHUA, Z.; McDONALD, M. B. The saturated salt accelerated aging test for small seeded crops.Seed Science and Technology, v. 25, n. 1, p. 123-131, 1996.
KOBORI, N. N. et al. Effects of gamma radiation on
physiological and phytosanitary qualities of Brazilian Castor Bean seeds,Ricinus communis (cv. IAC Guarani). Research Journal of Seed Science, v. 3, n. 1, p. 70-81, 2010.
tratadas com fungicida e inseticida. Revista Brasileira de Sementes, v. 33, n. 4, p. 652-662, 2011.
MARCOS-FILHO, J. Teste de envelhecimento acelerado In: KRZYZANOWSKI, F. C.; VIEIRA, R. D.; FRANÇA NETO, J. de B. (Ed.). 1999.Vigor de sementes: conceitos e testes.
Londrina: ABRATES, 1999, p. 1-21.
MARCOS FILHO, J. Fisiologia de sementes das plantas cultivadas. Piracicaba: Fealq. 2005. 495 p.
MARCOS FILHO, J.et al. Assessment of melon seed vigour
by an automated computer imaging system compared to traditional procedures. Seed Science and Technology, v. 35,
n. 2, p. 485-497, 2006.
MARCOS FILHO, J.; KIKUTI, A. L. P.; LIMA, L. B. Métodos para avaliação do vigor de sementes de soja, incluindo a análise computadorizada de imagens.Revista Brasileira de Sementes, v. 31, n. 1, p. 102-112, 2009.
NAKAGAWA, J. Testes de vigor baseados no desempenho de plântulas. In: KRZYZANOWSKI, F. C., VIEIRA, R. D.; FRANÇA NETO, J. B. Vigor de Sementes: conceitos e testes. Londrina: ABRATES, Comitê de Vigor de Sementes. 1999. 218 p.
OAKLEY, K.; KESTER, S. T.; GENEVE, R. L. Computer-aided digital image analysis of seedling size and growth rate for assessing seed vigour in Impatiens. Seed Science and Technology, v. 32, n. 3, p. 837-845, 2004.
RODO, A. B.; TILLMANN, M. A. A.; VILLELA, F. A. Testes de vigor na avaliação da qualidade fisiológica de sementes de tomate.Revista Brasileira de Sementes, v. 20, n. 1, p. 23-28, 1998.
RODO, A. B.; MARCOS FILHO, J. Accelerated aging and controlled deterioration for the determination of the physiological potential of onion seeds. Scientia Agricola, v. 60, n. 3, p. 465-469, 2003.
SAKO, Y. et al. A system for automated seed vigour
assessment.Seed Science and Technology, v. 29, n. 3, p. 625-636, 2001.
SEKHARAN, S. 2005.Aged soybean seeds - their physiology and vigor assessment. 180 p. (Tese de doutorado). The Ohio State University, Columbus, Ohio, Estados Unidos da America.
SILVA, V. N.; GOMES JUNIOR, F. G.; CICERO, S. M. Computerized imaging analysis of seedlings for assessment of physiological potential of wheat seeds.Revista Brasileira de Sementes, v. 34, n. 4, p. 589-596, 2012a.
SILVA, C. B. et al. Automated system of seedling image analysis (SVIS) and electrical conductivity to assess sun hemp seed vigor. Revista Brasileira de Sementes, v. 34,
n. 1, p. 55-60, 2012b.
SVEINSDOTTIR, H. Seed ageing-induced inhibition of germination and post germination root growth is related to lower activity of plasma membraneH+ ATPase in maizeroots.
Journal of Plant Physiology, v. 166, n. 2, p. 128-135, 2009.
TEKRONY, D. M. Precision is an essential component in seed vigour testing.Seed Science and Technology, v. 31, n. 2, p. 435-447, 2003.
VANZOLINI et al. Teste de comprimento de plântula na avaliação da qualidade fisiológica de sementes de soja.