http://www.uem.br/acta ISSN printed: 1679-9275 ISSN on-line: 1807-8621
Acta Scientiarum
Doi: 10.4025/actasciagron.v36i2.21957
Automated image analysis of seedlings for vigor evaluation of
common bean seeds
Francisco Guilhien Gomes Junior*, Helena Maria Carmignani Pescarin Chamma and Silvio Moure Cicero
Departamento de Produção Vegetal, Escola Superior de Agricultura “Luiz de Queiroz”, Universidade de São Paulo, Av. Pádua Dias, 11, 13418-900, Piracicaba, São Paulo, Brazil. *Author for correspondence. E-mail: [email protected]
ABSTRACT. Quickly and precise evaluations of the vigor of seeds are highly desirable for the success of quality control programs applied to the seed industry. The objective of this experiment was to determine the number of days necessary to calculate the vigor index of common bean seeds using an automated system of seedling images (SVIS®), and compare its results with the traditional tests of seed vigor. Samples of five seed lots of the IAC Carioca cultivar were submitted to germination, accelerated aging, seedling emergence in sand and electrical conductivity tests. The parameters measured by the Seed Vigor Imaging System (SVIS®) were mean seedling length, growth (ratio of the actual seedling growth to the maximum possible growth), uniformity of growth and the vigor indexes 30:70, 40:60, 50:50, 60:40 and 70:30 (based on different growth/uniformity ratios), and computed from scanned images of three- and four-day-old seedlings. Results of SVIS® analyses were consistent with the physiological potential evaluations provided by the traditional tests of seed vigor. Therefore, the SVIS® is efficient for detecting differences in vigor among seed lots of common bean (IAC Carioca cultivar) using three- or four-day-old seedlings, independently of the growth/uniformity ratios used to calculate the vigor index.
Keywords: Phaseolus vulgaris L., image analysis, quality control.
Análise automatizada de imagens de plântulas para avaliação do vigor de sementes de feijão
RESUMO. Avaliações rápidas e precisas do vigor são altamente desejáveis nos programas de controle de qualidade das empresas produtoras de sementes. O objetivo desta pesquisa foi determinar o período necessário para calcular o índice de vigor utilizando a análise computadorizada de imagens de plântulas (SVIS®) e comparar os resultados com outros testes rotineiramente utilizados para avaliação do vigor de sementes de feijão. Cinco lotes de sementes da cultivar IAC Carioca foram submetidos às avaliações de germinação, envelhecimento acelerado, emergência de plântulas em areia e condutividade elétrica. Nas análises SVIS® foram avaliadas plântulas com três e quatro dias de idade, sendo obtidos dados de comprimento de plântulas, crescimento (proporção do tamanho atual em relação ao tamanho máximo possível), uniformidade de crescimento e índices de vigor 30:70, 40:60, 50:50, 60:40 e 70:30 (baseados em diferentes variações da proporção crescimento/uniformidade). Os resultados das análises SVIS® foram consistentes na avaliação do potencial fisiológico, com sensibilidade comparável aos testes de vigor utilizados tradicionalmente. O SVIS® é eficiente para identificar diferenças de vigor entre lotes de sementes da cultivar IAC Carioca, e as análises em plântulas com três e quatro dias de idade apresentam resultados equivalentes, independentemente das proporções crescimento/uniformidade utilizadas no cálculo do índice de vigor.
Palavras-chave:Phaseolus vulgaris L., análise de imagens, controle de qualidade.
Introduction
Vigor tests are essential for evaluating the physiological potential of seed lots and are a basic parameter for developing programs to control the seed quality (MARCOS FILHO, 1999). The first apparent manifestation of seed aging is a decrease in the germination rate followed by a reduction in seedling size and culminating in an increased number of abnormal seedlings (MATTHEWS, 1985).
One of the most important methods for evaluating the seed vigor consists of determining the rate and
species. However, when these determinations are done by hand-labor, they are time-consuming and depend on subjective interpretations, resulting in different results between laboratories and analysts, or both.
With the aim of obtaining information on seed vigor quickly and consistently, a relatively recent alternative has been the use of digital images of seedlings, a procedure which does not directly involve the seed analyst. Sako et al. (2001) proposed the alternative based on the automated analysis of the digital images from lettuce seedlings, measuring the rate and uniformity of seedling growth and creating a computer program called the Seed Vigor Imaging System - SVIS®.
Later efforts by the SVIS® inventors were focused
on evaluating the seedling images of soybean (HOFFMASTER et al., 2003, 2005), corn (HOFFMASTER et al., 2005) and melon (MARCOS FILHO et al., 2006). Further research with this software has been focused on the evaluation of physiological potential of seeds and comparing results with those from the traditional tests. Species studied include sweet corn (GOMES JUNIOR et al., 2009; ALVARENGA et al., 2012), peanuts (MARCHI et al., 2011), crotalaria (SILVA et al., 2012a), cucumber (CHIQUITO et al., 2012) and wheat (SILVA et al., 2012b). However, there is no information yet demonstrating the efficiency of the SVIS® for evaluating the physiological potential of
common bean seeds.
One of the main requirements in the adjustment of the SVIS® analysis is the definition of seedling age
for obtaining the images and further evaluation by the software. The softwares developed for the analysis of lettuce, corn and soybean seedlings require their evaluation three days after the sowing in the germination test (SAKO et al., 2001; HOFFMASTER et al., 2003; HOFFMASTER et al., 2005). However, for the adaptation and use of the SVIS® for studies on other species, seedling age
needs to be determined to obtain a higher consistency and equivalence with the results of the other routine tests. Included in this procedure are melon (MARCOS FILHO et al., 2006) and cucumber (CHIQUITO et al., 2012).
The SVIS® software also permits the adjustment
of the ratio of indexes of growth/ growth uniformity for calculating the vigor index. The most consistent results in sweet corn seeds were obtained using the ratios of 70:30 for growth and uniformity respectively, when compared with 30:70 and 50:50, for identifying the effects of the priming (GOMES JUNIOR et al., 2009). Otherwise, when evaluating the physiological potential of cucumber seeds the ratios 60:40, 70:30 and 80:20 did not affect the
accuracy of the results (CHIQUITO et al., 2012). Complementary research is, therefore, important to verify whether these ratios show variable results depending on the sample and seed species. These studies should always include comparisons with the results of the routine tests for seed vigor.
The objective of this experiment was to determine the number of days necessary to calculate the vigor index of common bean seeds using an automated system of seedling images (SVIS®) and compare its
results with other tests routinely used to evaluate the physiological potential of common bean seeds.
Material and methods
The experiment was carried out using five seed lots of common beans (Phaseolus vulgaris L., IAC Carioca cultivar). The moisture content was determined by the oven method at 105°C for 24h (BRASIL, 2009), and the seeds were submitted to the following tests:
Germination test
Every lot had four replications of 50 seeds distributed on two sheets of paper towel moistened 2.5 times the weight of the dry substrate, and covered with another moistened sheet after sowing. The paper towel sheets were then turned into rolls, and maintained in the seed germinator at 25oC.
Seedlings evaluation was performed at the fifth (first count) and ninth day after sowing, according to prescriptions in the Rules for Seed Analysis (BRASIL, 2009). The results were expressed in percentage of normal seedlings from every seed lot.
Accelerated aging test
Four replications of 50 seeds per lot starting with 220 seeds accommodated on a stainless steel sieve in the upper third of the plastic box (11 x 11 x 3.5 cm) containing 40 mL of water. After closing the lid, the box was maintained in a BOD chamber at 41°C for 48h. Thereafter, the seeds were submitted to the germination test and the normal seedlings were evaluated at the fifth day.
Seedling emergence
Electrical conductivity test
Four replications of 50 seeds per lot were weighed on a scale with accuracy of 0.01 g and immersed in 75 mL of distilled water for 24h at 25oC. The electrical conductivity of the solution was
read using a DIGIMED DM-31 conductivity meter. The records were divided by the weight of the seeds and the results expressed in μS cm-1 g-1.
Computerized analysis of the seedling images (SVIS®)
The current software for evaluating the seed vigor of soybean was applied to three- and four-day-old seedlings. Every treatment had four replications of 25 seeds per lot, distributed on two paper towels placed longitudinally (two rows on the upper third of the paper towels) and covered with a third sheet; the substratum was moistened 2.5 times its dry weight. The rolls with the seeds were placed in a seed germinator at 25oC for three or four days. After
the third and fourth days the seedlings were transferred from the germination roll to a black cardboard sheet to improve the color contrast during software evaluation, and the seedling images were digitalized using an HP Scanjet G2410 scanner, fixed upside-down in an aluminum box (60 x 50 x 12 cm), adjusted to a resolution of 100 dpi and connected to a Pentium 4 computer (2.0GHz CPU, 768MB RAM and a 40GB HD).
The images were processed and the uniformity and growth parameters generated as described by Sako et al. (2001). The uniformity value was determined using the computed standard deviation over the length measurements in pixels from the normal seedlings. The growth was computed as a ratio of the actual growth to the maximum possible growth of the seed lot. The maximum possible growth was computed by multiplying the number of seedlings found in the seed lot by the maximum growth possible for three- or four-day-old seedlings. The maximum of five (12.7 cm) for three- and seven inches (17.8 cm) for four-day-old seedlings were established in the software configurations. The combination between the uniformity and growth indexes, which can range from 0 to 1000, was used to calculate the indexes of seed vigor. Adjustments in the ratios of seedling growth and uniformity were evaluated during the analyses for calculating the vigor index. The aim was to verify which ratio would promote the most consistent results using 30:70, 40:60, 50:50, 60:40 and 70:30. For example, the ratio 30:70 corresponds to 30% of the value for the growth index added to 70% of the value for uniformity index. The SVIS® software also permits
the determination of the seedling length by positioning the cursor of the mouse on every
seedling and recording the values in millimeters although the results are informed in centimeters. Thus, after processing the images, the mean values of growth, uniformity and vigor indexes as well as the values for the seedling length for each lot were obtained. The time necessary for digitalizing the images and the end of the analyses for every replication was less than five minutes.
The data were submitted to the analysis of variance (ANOVA), using a completely randomized experimental design. After to confirm the normal distribution of data by Lillieforts test, the means were compared using the Tukey test (p ≤ 0.05).
Results and discussion
The initial moisture content of the seeds ranged from 10.9 to 11.8%, which is suitable for the germination and vigor tests without affecting the reliability of the results. After the accelerated aging test, these values ranged from 28.3 to 30.1%, which were also within the limits established to assure uniform conditions for the (SVIS®) analysis
(MARCOS FILHO, 1999).
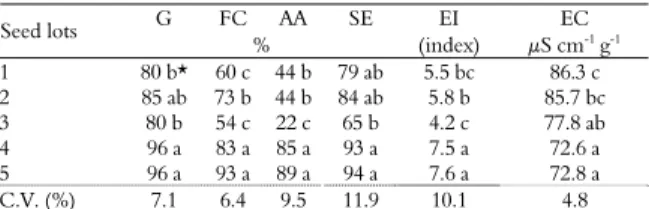
The analyses of variance showed differences in physiological quality between the common bean seed lots; lots 4 and 5 germinated better than lots 1 and 3 and all of them showed a minimum value of 80%, which is mandatory for commercialization in Brazil (Table 1). The vigor tests also classified lots 4 and 5 as having a higher physiological quality, with the lower response observed in lot 3. These differences in seed vigor were expected because the lots showed significant differences in the percentage of germination.
Table 1. Results of the germination (G), first count (FC), accelerated aging (AA), seedling emergence (SE), emergence index (EI) and electrical conductivity (EC) in five seed lots of common bean, IAC Carioca cultivar.
G FC AA SE EI EC
Seed lots
% (index) μS cm-1 g-1
1 80 b* 60 c 44 b 79 ab 5.5 bc 86.3 c 2 85 ab 73 b 44 b 84 ab 5.8 b 85.7 bc 3 80 b 54 c 22 c 65 b 4.2 c 77.8 ab 4 96 a 83 a 85 a 93 a 7.5 a 72.6 a 5 96 a 93 a 89 a 94 a 7.6 a 72.8 a C.V. (%) 7.1 6.4 9.5 11.9 10.1 4.8
*Means followed by the same letter in every column do not differ among themselves
according to the Tukey test, (p ≤ 0.05).
One of the basic requirements when introducing new procedures for evaluating seed vigor is their equivalence with the routine standard laboratory tests. The results of evaluations obtained from the SVIS®
Table 2. Means data from SVIS® analyses of three-day-old seedlings in five seed lots of common bean, IAC Carioca cultivar: seedling length (SL), growth (G), uniformity (U) and vigor (V) indexes.
Indexes V (indexes) Seed lots SL (cm)
G U 30:70 40:60 50:50 60:40 70:30 1 4.4 c* 433 b 915 b 771 b 723 b 675 b 626 b 578 b 2 4.5 c 440 b 913 b 771 b 724 b 677 b 629 b 582 b 3 3.1 d 306 c 917 b 734 c 672 c 612 c 550 c 489 c 4 8.6 b 852 a 945 a 917 a 908 a 899 a 889 a 880 a 5 9.4 a 920 a 933 ab 929 a 927 a 927 a 925 a 924 a C.V. (%) 5.6 5.6 1.4 1.4 1.7 2.1 2.7 3.2
*Means followed by the same letter in each column do not differ among themselves
according to the Tukey test, (p ≤ 0.05).
The highest values for the SVIS® evaluations of
seedling length and the growth index were observed for lots 4 and 5 in contrast with lot 3 that showed the worst response among those lots classified as having a lower physiological potential (Tables 2 and 3). For the vigor tests, accelerated aging showed the greatest similarity with the results of the SVIS® evaluations in
classifying lots with low vigor from those presenting high vigor. These results confirm those from soybean (MARCOS FILHO et al., 2009) and super sweet corn seeds (ALVARENGA et al., 2012). The literature reports a high efficiency for the accelerated aging test for identify vigor differences between common bean seed lots (ALIZAGA et al., 1990) and the results of the current experiment demonstrated the SVIS® analysis as
a reliable procedure for evaluating seed vigor in common bean.
The identification of the seedling age for the SVIS® analyses of unstudied species has been
based on the first count from the germination test prescribed in the Rules for Seed Analysis (BRASIL, 2009). The evaluations of three-day-old seedlings allowed a better differentiation between seed lots for uniformity (Table 2). Seedling age did not influence the results for seedling length, growth and vigor indexes and classified the seed lots in a similar manner (Tables 2 and 3).
Table 3. Means data from SVIS® analyses of four-day-old seedlings in five seed lots of common bean, IAC Carioca cultivar: seedling length (SL), growth (G), uniformity (U) and vigor (V) indexes.
Indexes V (indexes)
Seed lots SL (cm)
G U 30:70 40:60 50:50 60:40 70:30 1 8.7 b* 622 b 909 a 823 b 794 b 766 b 737 b 708 b 2 8.8 b 623 b 920 a 831 b 802 b 772 b 742 b 712 b 3 6.0 c 432 c 923 a 776 c 727 c 678 c 629 c 580 c 4 13.0 a 909 a 915 a 913 a 912 a 912 a 912 a 911 a 5 12.5 a 886 a 902 a 897 a 896 a 894 a 892 a 891 a C.V. (%) 5.5 6.3 1.9 2.5 2.9 3.4 3.8 4.4
*Means followed by the same letter in each column do not differ among themselves
according to the Tukey test, (p ≤ 0.05).
However, the three-day-old seedlings was more sensitive for identifying differences between lots 3 and 4 (same germination), which was not observed in the
other vigor tests and may be an indication of increased deterioration among the seed lots. This information is important because it permit reduce by 24h the time for evaluating the seed vigor of common bean using the SVIS®. In melon and cucumber
seeds, in contrast, more accurate and consistent results were observed in four-day-old compared to three-day-old seedlings (MARCOS FILHO et al., 2006; CHIQUITO et al., 2012). Otherwise, the SVIS® evaluations in three-day-old seedlings of
Crotalaria juncea were more sensitive for
identifying differences in vigor between seed lots in comparison with the four-day-old seedlings (SILVA et al., 2012a). These results demonstrate the importance of new researches to adapt the SVIS® procedures in various species.
All the differences in the ratios of growth/uniformity evaluated (30:70, 40:60, 50:50, 60:40 and 70:30) allowed to classify the seed lots in a similar manner to those based on the results of other vigor tests (Table 1, 2 and 3), confirming results from cucumber seeds (CHIQUITO et al., 2012). In contrast, the priming effects on sweet corn seeds were more consistent when the ratio was 70:30 (GOMES JUNIOR et al., 2009). These discrepant results should be explained by differences in both growth and uniformity parameters among seed lots; for primed seeds the uniformity indexes tend to be similar among lots with low and high vigor.
Figure 1A shows the print screen of the SVIS®
analysis window and the adjustment of the growth/uniformity ratio to 70:30. The use of the 70:30 parameter, adopted in the first experiments with lettuce, soybean and corn seeds (SAKO et al., 2001; HOFFMASTER et al., 2005), has been satisfactory in species such as melon (MARCOS FILHO et al., 2006), soybeans (MARCOS FILHO et al., 2009), sweet corn (GOMES JUNIOR et al., 2009; ALVARENGA et al., 2012), peanuts (MARCHI et al., 2011), and Crotalaria
juncea (SILVA et al., 2012a) and may also be safely
used to evaluate the seed vigor of common bean, as demonstrated in the current experiment.
The software also allows the choice of the estimated maximum size for three-day-old seedlings and the selection of the unit for expressing the individual seedling length (in this case in mm), as can be seen in the seedling highlighted by the arrow, and the length shown in the Figure1B.
The correct choice of maximum seedling size is fundamental for standardizing the SVIS®
Figure 1. Images of three-day-old seedlings of common beans, IAC Carioca cultivar, analyzed by SVIS®, from lots 3 (A) and 4 (B). In highlight the program configurations where the ratios of the growth (growth contribution) and uniformity (uniformity contribution) were adjusted to 70 and 30 for calculating the vigor index, the maximum size estimated for three-day-old seedlings (5 inches = 12.7 cm), the values of growth (863), uniformity (943), vigor index (887) and the length of the seedling indicated by the arrow (148.08 mm).
One of the difficulties of the labor to determine seedling length is the curvature in the seedling hypocotyl (ALIZAGA et al., 1990), as seen in most of the seedlings in the Figure 1. Therefore, the automation of this determination can help to minimize
the errors by seed analysts who are using a high number of replications and working fast.
Research in Seed Technology made significant advances with the establishment of SVIS® as an
efficient procedure for evaluating seed physiological
A
quality. In Brazil there is a strong tendency to develop computer programs similar to the SVIS® to attend a
wide number of species and the technical/financial objectives of companies and research organizations. In addition to provide rapid and objective evaluations, these methods also help to optimize information management by storing images and numerical results in database for future studies.
The results of the current experiment demonstrated the consistency of the SVIS® analysis in
discriminating common bean seed lots of IAC Carioca cultivar in different vigor levels in a similar manner to standard laboratory tests. Although the analysis of the images of three- and four-day-old seedlings has provided similar results, the standardization of this evaluation for three days after germination may be considered promising because of the gain in time.
Conclusion
The computerized system of processing images (SVIS®) can identify efficiently differences in vigor of
common bean seed lots, IAC Carioca cultivar, with sensitivity comparable to the traditional vigor tests.
The analyses done on three- and four-day-old seedlings gave similar results, and the ratios growth/uniformity for calculating the vigor index did not interfere in the accuracy of the results.
References
ALIZAGA, R. L.; MELLO, V. D. C.; SANTOS, D. S. B.; IRIGON, D. L. Avaliação de testes de vigor em sementes de feijão e suas relações com a emergência em campo. Revista Brasileira de Sementes, v. 12, n. 2, p. 44-58, 1990.
ALVARENGA, R. O.; GOMES JUNIOR, F. G.; MARCOS FILHO, J. Avaliação do vigor de sementes de milho superdoce por meio da análise computadorizada de imagens de plântulas. Revista Brasileira de Sementes, v. 34, n. 3, p. 488-494, 2012.
BRASIL. Ministério da Agricultura, Pecuária e Abastecimento. Regras para análise de sementes. Brasília: SNDA/DNDV/CLAV, 2009.
CHIQUITO, A. A.; GOMES JUNIOR, F. G.; MARCOS FILHO, J. Assessment of physiological potential of cucumber seeds using the software Seed Vigor Imaging System (SVIS). Revista Brasileira de Sementes, v. 34, n. 2, p. 255-263, 2012.
DAN, E. L.; MELLO, V. D. C.; WETZEL, C. T.; POPINIGIS, F.; ZONTA, E. P. Transferência de matéria seca como modo de avaliação do vigor de sementes de soja. Revista Brasileira de Sementes, v. 9, n. 3, p. 45-55, 1987. GOMES JUNIOR, F. G.; MONDO, V. H. V.; CICERO, S. M.; McDONALD, M. B.; BENNETT, M. A.
Evaluation of priming effects on sweet corn seeds by SVIS. Seed Technology, v. 31, n. 1, p. 95-100, 2009. HOFFMASTER, A. L.; FUJIMURA, K.; McDONALD, M. B.; BENNETT, M. A. An automated system for vigour testing three-day-old soybean seedlings. Seed Science and Technology, v. 31, n. 3, p. 701-713, 2003. HOFFMASTER, A. L.; XU, L.; FUJIMURA, K.; McDONALD, M. B.; BENNETT, M. A.; EVANS, A. F. The Ohio State University seed vigor imaging system (SVIS) for soybean and corn seedlings. Seed Technology, v. 27, n. 1, p. 7-26, 2005.
MAGUIRE, J. D. Speed of germination aid in selection and evaluation for seedling and vigour. Crop Science, v. 2, n. 2, p. 176-177, 1962.
MARCHI, J. L.; CICERO, S. M.; GOMES JUNIOR, F. G. Utilização da análise computadorizada de plântulas na avaliação do potencial fisiológico de sementes de amendoim tratadas com fungicida e inseticida. Revista Brasileira de Sementes, v. 33, n. 4, p. 652-662, 2011. MARCOS FILHO, J. Testes de vigor: importância e utilização. In: KRZYZANOWSKI, F. C.; VIEIRA, R. D.; FRANÇA NETO, J. B. (Ed.). Vigor de sementes: conceitos e testes. Londrina: Abrates, 1999. p. 1-21. MARCOS FILHO, J.; BENNETT, M. A.; EVANS, A. S.; GRASSBAUGH, E. M. Assessment of melon seed vigour by an automated computer imaging system compared to traditional procedures. Seed Science and Technology, v. 34, n. 2, p. 507-519, 2006.
MARCOS FILHO, J.; KIKUTI, A. L. P.; LIMA, L. B. Métodos para avaliação do vigor de sementes de soja, incluindo a análise computadorizada de imagens. Revista Brasileira de Sementes, v. 31, n. 1, p. 102-112, 2009. MATTHEWS, S. Physiology of seed ageing. Outlook on Agriculture, v. 14, n. 2, p. 89-94, 1985.
SAKO, Y.; McDONALD, M. B.; FUJIMURA, K.; EVANS, A. F.; BENNETT, M. A. A system for automated seed vigour assessment. Seed Science and Technology, v. 29, n. 3, p. 625-636, 2001.
SILVA, C. B.; LOPES, M. M.; MARCOS FILHO, J.; VIEIRA, R. D. Automated system of seedling image analysis (SVIS) and electrical conductivity to assess sun hemp seed vigor. Revista Brasileira de Sementes, v. 34, n. 1, p. 55-60, 2012a.
SILVA, V. N.; GOMES JUNIOR, F. G.; CICERO, S. M. Computerized imaging analysis of seedlings for assessment of physiological potential of wheat seeds. Revista Brasileira de Sementes, v. 34, n. 4, p. 589-596, 2012b.
Received on September 20, 2013. Accepted on September 23, 2013.