MAGNETIC SUSCEPTIBILITY TO IDENTIFY LANDSCAPE
SEGMENTS ON A DETAILED SCALE IN THE REGION OF
JABOTICABAL, SÃO PAULO, BRAZIL
(1)Mariana dos Reis Barrios (2), José Marques Junior(3), Alan Rodrigo Panosso(4), Diego Silva Siqueira(5) & Newton La Scala Junior(6)
SUMMARY
The agricultural potential is generally assessed and managed based on a one-dimensional vision of the soil profile, however, the increased appreciation of sustainable production has stimulated studies on faster and more accurate evaluation techniques and methods of the agricultural potential on detailed scales. The objective of this study was to investigate the possibility of using soil magnetic susceptibility for the identification of landscape segments on a detailed scale in the region of Jaboticabal, São Paulo State. The studied area has two slope curvatures: linear and concave, subdivided into three landscape segments: upper slope (US, concave), middle slope (MS, linear) and lower slope (LS, linear). In each of these segments, 20 points were randomly sampled from a database with 207 samples forming a regular grid installed in each landscape segment. The soil physical and chemical properties, CO2 emissions (FCO2) and magnetic
susceptibility (MS) of the samples were evaluated represented by: magnetic susceptibility of air-dried fine earth (MSADFE), magnetic susceptibility of the total sand fraction (MSTS) and magnetic susceptibility of the clay fraction (MSCl) in the 0.00 0.15 m layer. The principal component analysis showed that MS is an important property that can be used to identify landscape segments, because the correlation of this property within the first principal component was high. The hierarchical cluster analysis method identified two groups based on the variables selected by principal component analysis; of the six selected variables, three were related to magnetic susceptibility. The landscape segments were differentiated similarly by
(1)Received for publication in November 1, 2011 and approved in March 20, 2012.
(2) Graduate student (Master degree) of Agronomy (Plant Production) at the Faculty of Agricultural and Veterinary Sciences /São
Paulo State University "Julio de Mesquita Filho" (FCAV/UNESP). Via de Acesso Prof. Paulo Donato Castellani (unnumbered). Postal CEP 14870-900 Jaboticabal (SP), Brazil. CAPES MSc scholarship. E-mail: mariana_r.barrios@yahoo.com.br
(3) Professor Dr., Department of Soils and Fertilizers', FCAV/UNESP. E-mail: marques@fcav.unesp.br
(4) Postdoctoral student, FCAV/UNESP. FAPESP scholarship, process number: 10/20364-9. E-mail: arpanosso@yahoo.com.br (5) Doctoral student of Post-graduation Program in Agronomy (Plant Production) of FCAV/UNESP. FAPESP scholarship, process
number: 2011/06053-3. E-mail: diego_silvasilqueira@yahoo.com.br
the principal component analysis and by the cluster analysis using only the properties with higher discriminatory power. The cluster analysis of MSADFE, MSTS
and MSCl allowed the formation of three groups that agree with the segment division established in the field. The grouping by cluster analysis indicated MS as a tool that could facilitate the identification of landscape segments and enable the mapping of more homogeneous areas at similar locations.
Index terms: landforms, principal component analysis, cluster analysis.
RESUMO: SUSCETIBILIDADE MAGNÉTICA NA IDENTIFICAÇÃO DE COMPARTIMENTOS DA PAISAGEM EM ESCALA DETALHADA NA REGIÃO DE JABOTICABAL (SP)
A avaliação e adequação do potencial agrícola são realizadas com base na visão unidimensional do perfil do solo, porém a produção sustentável tem estimulado estudos sobre técnicas e métodos de avaliação do potencial agrícola em escalas detalhadas, que sejam mais rápidos e precisos. Assim, o objetivo deste trabalho foi investigar o potencial da suscetibilidade magnética do solo na identificação de compartimentos da paisagem em escala detalhada na região de Jaboticabal (SP). A área estudada possui duas curvaturas de relevo: côncava e linear, sendo subdividida em três compartimentos da paisagem: encosta superior (ES), meia encosta (ME) e encosta inferior (EI). Foram amostrados 20 pontos em cada compartimento, de forma aleatória, a partir de um banco de dados composto por 207 amostras oriundas de um gradeado amostral regular instalado em cada compartimento da paisagem. Foram avaliados os atributos físicos e químicos, a emissão de CO2 (FCO2) e a suscetibilidade magnética (SM), representada por: suscetibilidade magnética da terra fina seca ao ar (SMTFSA), da fração areia total (SMAT) e da fração argila (SMARG), na profundidade de 0,00 - 0,15 m. Os resultados, obtidos por meio da análise de componentes principais, demonstraram que a SM é um importante atributo, capaz de ser empregado na identificação dos compartimentos da paisagem, pois a correlação desse atributo dentro do primeiro componente principal foi alta. A análise de cluster, método hierárquico, permitiu identificar dois grupos, segundo as variáveis selecionadas por meio da análise de componentes principais, entre os quais três das seis variáveis selecionadas correspondem à suscetibilidade magnética. A distinção dos compartimentos da paisagem na análise de componentes principais foi similar à do agrupamento formado na análise de cluster utilizando-se somente os atributos de maior poder discriminatório. A submissão da SMTFSA, SMAT e SMArg à análise de cluster possibilitou a formação de três grupos que concordam com a divisão de compartimentos estabelecida em campo. O agrupamento observado na análise de cluster evidencia a possibilidade de a SM ser utilizada como ferramenta que facilite a identificação de compartimentos da paisagem e viabilize o mapeamento de áreas mais homogêneas em locais semelhantes.
Termos de indexação: formas de relevo, análise de componentes principais, análise de cluster.
INTRODUCTION
The increased recognition of sustainable production has stimulated studies on evaluation techniques and methods of the agricultural potential on a detailed scale that are fast, accurate and economical. Therefore, the evaluation of the expected performance of agricultural systems must be improved by the application of quantitative indicators, e.g., the magnetic susceptibility of the soil (Siqueira et al., 2010), which allow objective comparisons and the exact identification of boundaries of landscape segments in the field.
In general, the agricultural development in the tropics needs characterization and precise mapping of
the soil for appropriate recommendations of the management system to be used (Shepherd & Walsh, 2007). To meet this need, several studies have adressed the efficacy of using mathematical tools associated with landscape models (Pennock & Corre, 2001; Pennock et al., 2001; Kravchenko et al., 2005; Barbieri et al., 2009; Leão et al., 2010) Studies about the relationships between geomorphic and pedologic processes are needed to deepen the understanding of the synergistic processes occurring in soil, thus enabling the planning of more appropriate management practices (Young & Hammer, 2000; Bui, 2004; Vidal-Torrado et al., 2005)
the establishment of the soil physical and mineralogical properties (Souza et al., 2009). The mapping of a soil, characterized as free or categorical mapping is based on the knowledge of the different landforms found at a site of interest (Legros, 2006). Such studies, aside from providing information for the characterization of homogeneous areas, permit knowledge take-over for the same sites of pedogeomorphic domain (Marques Jr., 2009), contributing to management strategies that are in agreement with sustainable production.
Therefore, Marques Jr. (2009) proposed the use of magnetic susceptibility (MS) to help identify the limits of accuracy between different landscape forms, emphasizing the possibility of using MS to indirectly evaluate some soil properties quantitatively. This information is useful for the soil classification systems in use, because it may direct the development of criteria for detailed soil mapping, allowing more detailed and site-specific management practices.
Magnetic susceptibility is a property of iron-containing minerals (Souza Jr. et al., 2010), found in rocks, sediments and soil. The level of magnetic susceptibility depends on the concentration and characteristics of the minerals (composition, spatial structure and crystal size) (Verosub & Roberts, 1995; Fontes et al., 2000; Blundell et al., 2009; Silva et al., 2010). This soil property can be a useful tool to gain further insights on soil knowledge, aside from being fast and cheap, applied in a number of areas, e.g., environmental monitoring, paleoclimatology, limnology, archeology, stratigraphy, and in pedology (Chaparro et al., 2008).
Siqueira et al. (2010) found significant correlations between MSADFE and some soil properties in a study
on correlations between soil properties and MSADFE,
in the 0.00 to 0.20 m layer of a eutrophic Acrisol with arenitic source material, harvested by hand with sugarcane burning in the pre-harvest period.
The mapping of magnetic susceptibility is ideal for studies that require large amounts of samples, as of spatial variability, for example (Dearing et al., 1996). Thus, the combined use of this method of indirect analysis with multivariate statistics provides valuable information for the mapping of homogeneous areas with a view to develop strategies for different agricultural systems. The objective of this study was to investigate the potential of magnetic susceptibility in the identification of landscape segments on a detailed scale in an area located in Jaboticabal (SP), under mechanically harvested sugarcane.
MATERIAL AND METHODS
The experiment was conducted in the region of Jaboticabal, a municipality in the northeastern state of São Paulo (latitude 21º 17' S, longitude 48º 08' W,
on the western highland of São Paulo. The regional climate was classified as Aw, with tropical rainy summers and dry winters, according to Köppen.
Two terrain curvatures were mapped, concave and linear (Troeh, 1965). Increasing the mapping scale, the area was subdivided into three segments, according to the slope segment: upper slope (US), middle slope (MS) and lower slope (LS), according to Darlymple et al. (1968) (Figure 1).
The area is located in a region of lithostratigraphic transition between basalts of the Serra Geral formation of the São Bento group, and arenites of the Adamantina formation, Bauru group. The soil was classified as clayey Eutroferric Oxisol (LVef), but in a small area of the higher upper slope, the occurrence of a clayey Eutrofic Oxisol (LVe) was detected (Embrapa, 2006). The topography is slightly undulating with a slope ranging from 3 to 8 % and a mean altitude of 600 m asl.
The experimental area had been used for sugarcane cultivation for more than 60 years, with mechanical harvesting (green cane management system) in the last 14 years. For each landscape segment, a sample grid of 90 x 90 m was established, in which 49 points were distributed at regular intervals of 15 m. Five points were added to each of the four quadrants of the sample grid, resulting in a total of 69 replications per landscape segment in the 0.00 to 0.15 m layer.
To determine the total iron (Fe2O3) content, soil
was sampled from the 0.00 to 0.15 m layer, with five replicates per landscape segment, and Fe extracted by sulfuric acid attack (Embrapa, 1997). The total iron content (Fe2O3) in the segments upper slope (US),
middle slope (ME) and lower slope (LS) in the 0.00 to 0.15 m layer were 15.35, 19.25 and 21.00 %, respectively.
The particle size (total sand content - TS; clay content - Cl; silt content - Silt) was determined by the
method proposed by Embrapa (1997). Aggregate stability, referring to the Geometric Mean Diameter (GMD) was calculated as described by Kemper & Rosenau (1986). The total pore volume (TPV) was calculated based on the value of bulk density. Soil moisture (M) was determined by gravimetry, according to Gardner (1986). Organic matter (OM), hydrogenic potential (pH), available phosphorus (PAV),
and base saturation (V%) were obtained according to Raij et al. (1987).
The magnetic susceptibility of air-dried fine earth (MSADFE) was evaluated using an adapted analytical
scale (Carneiro et al., 2003;). This consists of a small permanent neodymium-iron-boron permanent magnet used as magnetization source, a height-adjustable support for the magnet, a sample holder and a precision scale. The equivalent mass recorded on the scale, the drawing power, must be converted into mass magnetic susceptibility, based on the soil bulk density.
To measure the magnetic susceptibility of the total sand fraction (MSTS) and magnetic susceptibility of
the clay fraction (MSCL) on the adapted analytical
scale, the soil samples were treated with NaOH 0.5 mol L-1 and subjected to mechanical agitation for 10
min to disperse the particles. After this treatment, the total sand fraction was removed in a 0.05 mm sieve. The separation of the silt fraction occurred by centrifugation (1,600 rpm) and the operation time was determined by the temperature of the samples during analysis. The clay suspension was flocculated with concentrated HCl and centrifuged (2,000 rpm for 2 min).
The results were presented based on descriptive statistics (mean and coefficient of variation). At first the ANOVA F test and the data normality assumptions were evaluated and then Tukey’s test at 5 % expressed the difference between the property means of the different landscape segments. Multivariate analyses were performed after standardization of the soil properties, with mean 0 and variance 1.
The principal components analysis (PCA) was applied to all soil variables in order to explain the variance structure of the evaluated data, taking a smaller set of variables without interrelations into consideration (PC), from linear combinations among the original variables (Johnson & Wichern, 2002; Hair et al., 2005). This analysis selected a set of soil properties, subsequently used in cluster analysis (Sena et al., 2002). Cluster analysis is a hierarchical grouping analysis, which serves to group more similar accessions (Freddi et al., 2008). In this study the Euclidean distance and the Ward algorithm were used for clustering. Descriptive statistics were performed using MINITAB 14 while for the multivariate statistics the program STATISTICA 7.0 (StatSoft. Inc., Tulsa, OK, USA) was used.
RESULTS AND DISCUSSION
The highest clay contents were found in the upper slope (Table 1). The values of MSTS, M, OM, V% and
pH were highest in the middle slope position, while TS, Silt, MSADFE, MSCl, FCO2, GMD and TPV were
highest in the lower slope. Possibly, the variation of these properties in the segments was related to the source material, as well as to the position of the soil in the landscape (Daniels & Nelson, 1987). The higher MSADFE, MSCl and total iron content (Fe2O3) in the
LS indicated greater proximity to the basalt, confirming the influence of the source material on the greater soil magnetic susceptibility (Fontes et al., 2000).
The MS data and their relation to the source material of the soils are highly relevant for lithostratigraphic transition regions as studied here. The color is a diagnostic attribute used in the Brazilian Soil Classification at the 2nd taxonomic level
(suborder). By this attribute, evaluated by the Munsell chart, only one environment was identified in the study area, demonstrating the subjectivity of this assessment method of hue, value and chroma. However, when the MS data were taken into consideration, three environments were detected. Tropical and subtropical regions are favorable for the neoformation of magnetic minerals, leading to an increased magnetic susceptibility of the clay fraction (Torrent et al., 2006), making the minerals present in this fraction important pedoambiental markers (Torrent et al., 2010).
With the exception of the property PAV, the property
means (of clay and silt content, MSADFE, MSTS, FCO2
and V%) differed significantly between the three segments. The properties with significantly different means between two segments only were: total sand content, MSCl, M, GMD, TVP, OM and pH. This
indicates that soil analysis based on mean values may fail to represent the spatial variability of the soil properties adequately, especially when the limits of the landscape segments are not taken into account. It can be concluded that MSTA as well as MSADFE can
be used as auxiliary properties in the study of the segments found in areas under the influence of different source materials or of lithostratigraphic transition.
Although there are significant differences between the diagnostic properties Clay and V% in the landscape segments, the field determined limits based on readings of a mapper, by clay analysis, would hardly allow an exact division of the existing segments within a same area. Thus, the use of other possible diagnostic properties for a more detailed separation of the environments is necessary.
moderate (12 % < CV < 60 %). Studies use the CV to assess the spatial variability in the soil properties and report greater spatial variability of chemical and physical properties in concave than in linear or convex curvatures (Souza et al., 2004; Montanari et al., 2008; Souza et al., 2009). Sanchez et al. (2009) showed in their work the influence that the water and solution flow, be it surface or subsurface, vertical or horizontal, have on the processes of variability in soil properties. Cunha et al. (2005) studied an Oxisol area in lithostratigraphic transition (sandstone - basalt) and confirmed that field limits can be established, which can be useful for more consistent surveys of soils and pedogenesis.
The first four principal components, PC1, PC2, PC3 and PC4, whose eigenvalues are greater than the unit (Kaiser, 1958), could explain 74.91 % of the variability in the soil properties in the three segments studied (Table 2). The first principal component, PC1 explained 30.50 % of the total variance in the soil properties, PC2 explained 22.06 % while PC3 explained 13.44 % and 8.90 were explained by PC4. To identify and quantify the changes in the soil associated with the different pedogenetic processes some authors have worked with a number of principal components that explain up to 70 % of the variance of the data (Carvalho Jr. et al., 2008).
In the first principal component and in order of importance, the properties with correlation coefficients above ± 0.70 (Jolliffe, 1972) were used to characterize the factors. The first component was characterized by variable MSCl , Clay, and MSADFE and Silt, while
the second principal component by V%, and pH, in order of importance (Table 2). Components 1 and 2 can be characterized respectively as the “physical” and “chemical” components of the soils.
In this study, the two first principal components, PC1 and PC2 were used to generate a two-dimensional graphic of the original sampling space, called biplot graphic, by which it is possible to explain the structure of the variables by vectors of variables in the regions of maximum variability (Figure 2). These two principal components together explained 53 % of the variability of the soil properties in the three segments studied (US, MS, LS). Siqueira et al. (2010), when studying the ability of MS to predict some soil properties, found that the first principal component explained 42 % of the variance of the set of soil properties studied, among which MS was the attribute of greatest discriminatory power within the PC1.
The variable correlation with the principal components (PC1 and PC2) expressed the formation of at least three groups: US, on the left of the biplot
Property Upper Slope Middle Slope Lower Slope
Mean CV1 Mean CV1 Mean CV1
TS (g kg-1) 170.49 b 23.58 170.36 b 4.05 210.34 a 7.39
Clay (g kg-1) 590.70 a 5.80 580.49 b 2.77 500.31 c 5.45
Silt (g kg-1) 220.81 c 14.38 240.05 b 5.33 280.24 a 11.39
MSADFE (m3 kg-1 10-5) 4.27 c 13.00 5.56 b 5.40 7.60 a 6.98
MSTS* (m3 kg-1 10-5) 6.84 c 17.86 9.97 a 13.79 7.85 b 10.57
MSCl* (m3 kg -1 10-5) 1.80 b 12.10 1.81 b 6.39 4.70 a 8.84
M (%) 26.00 b 9.23 27.00 a 5.67 2500 b 6.13
MDG (mm) 2.59 b 9.30 3.74 a 13.33 3.83 a 11.78
TPV (m3m-3) 0.54 b 5.13 0.53 b 5.10 0.55 a 4.29
OM (g dm-3) 28.58 b 16.31 32.36 a 12.92 28.61 b 12.58
PAV (mg dm-3) 47.57 a 52.12 49.64 a 31.03 42.77 a 56.34
V (%) 58.45 b 18.29 64.41 a 8.80 51.30 c 19.75
pH 5.17 a 6.29 5.27 a 3.56 4.93 b 5.83
Table 1. Descriptive statistics regarding the landscape segments: Upper Slope; Middle Slope and Lower Slope, in area under sugarcane cultivation, in the 0.00 to 0.15 m layer
N = 69 Atribute TS (total sand), Cl (clay content), Silt (silt content), MSADFE (magnetic susceptibility of the air-dried fine earth), MSTS (magnetic susceptibility of the total sand fraction), MSCl (magnetic susceptibility of the clay fraction), M (soil moisture), FCO2 (soil CO2 emission), GMD (geometric mean diameter), TPV (total pore volume), OM (soil organic matter), PAV (available phosphorus), V % (base saturation), pH (hydrogenic potential). Mean: statistic of the Tukey test significant at 5 % (p <0.05). Means followed by the same letter do not differ from each other by Tukey test. CV1: coefficient of variation. MS
TS*; MSCl*: 20
graph and at the bottom of the graph, while some of its points are superimposed on characteristic samples of the MS group, which is also on the left but in the upper part of the biplot graph, whereas the LS group is located to the right of the graph (Figure 2). Factor 1 separates the US from the LS soils by lower values of the variables MSCl, MSADFE and silt and the higher
clay content. Factor 2 separated the MS from US soils, by higher V and pH values. One possible cause of the similarity between certain points of the US and of the MS may be attributed to the fact that both landscape segments are located in a transition region, with regard to the terrain curvature, from concave to linear. The concave curvature, characterized by convergent water flow, can potentially facilitate a greater water flow in this area in the vertical direction, making this curvature more susceptible to depositional processes (McKenzie & Gallant, 2007).
In summary, the magnetic susceptibility of the ADFE and of the clay fraction (characterized by Factor 1) allowed the separation of the soils of the LS from the MS and US soils. These last two elements of the landscape were separated based on their chemical
properties (Factor 2) rather than on their magnetic susceptibility.
To date, no studies have been published addressing the soil magnetic susceptibility, combined with chemical and physical properties of different landscape segments, using principal component analysis. Our results suggest that magnetic susceptibility of ADFE, which is simple to obtain, was sufficient to separate the soils of the lower slope from the other landscape segments.
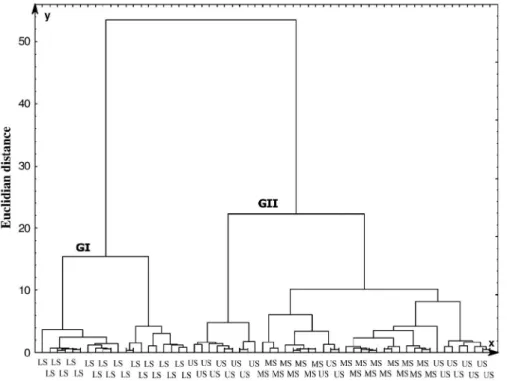
The dendrogram obtained by cluster analysis (Figure 3) shows the formation of two groups: GI grouped samples of the LS, and GII contained samples from the US and MS. The Hotelling’s test for the centroid of means (for the variables MSADFE, MSTS,
MSCL, Clay, V% and pH) was significant at 5 %,
confirming the discrimination between groups GI and GII observed in the cluster analysis. The result of the cluster analysis shows that 100% of the points originally belonging to the LS are grouped within GI. The samples which originated from the US and MS, were represented in their totality (100 %) within GII. The cluster analysis (Figure 3) was applied successfully
Main Component PC1 PC2 PC3 PC4
Eigenvalues* 4.27 3.08 1.88 1.24
Percentage explained (%) 30.50 22.06 13.44 8.90
Cumulative eigenvalues* 4.27 7.35 9.24 10.48
Percentage explained AC (%) 30.50 52.56 66.00 74.91
Property Correlation Ranking Correlation Ranking Correlation Ranking Correlation Ranking
TS 0.575 5 -0.294 10 0.514 3 0.436 2
Clay -0.928 2 -0.212 12 -0.182 11 0.002 14
Silt 0.704 4 0.493 5 -0.177 12 -0.345 4
MSADFE 0.884 3 0.307 9 -0.217 10 0.127 10
MSTS -0.122 13 0.668 3 -0.371 7 0.063 11
SMCl 0.949 1 -0.052 14 -0.110 13 0.021 13
M -0.333 9 0.258 11 -0.572 2 -0.279 6
FCO2 0.380 7 -0.310 8 0.386 6 -0.435 3
GMD 0.570 6 0.496 4 -0.282 8 0.292 5
TVP 0.360 8 -0.171 13 -0.105 14 -0.669 1
OM -0.195 12 0.481 7 -0.214 9 0279 7
PAV -0.061 14 0.492 6 0.577 1 -0.053 12
V% -0.257 11 0815 1 0.428 5 -0.132 9
pH -0.259 10 0.772 2 0.477 4 -0.135 8
Table 2. Eigenvalues and percentage of variation explained by the first four principal components and correlation coefficients between the original properties and the principal components. Ranking of the original parameters in the discrimination of landscape segments
N = 60. PC1: principal component 1; PC2: principal component 2; PC3: principal component 3; PC4: principal component 4. *: Eigenvalues greater than the unit established by Kaiser (1958), AC: Cumulative. Correlation values in bold used to characterize
to verify and separate landscape segments. Studies conducted in a topographic sequence in Pereira Barreto, SP confirmed the interdependence between the different diagnostic horizons, as the cluster analysis grouped accessions from different geomorphic surfaces (Campos et al., 2007).
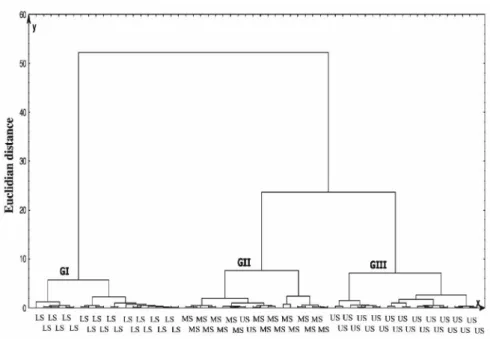
Figure 4 shows the formation of three groups, considering the set of three magnetic susceptibility components (MSADFE, MSTS, MSCl). Group one (GI) is
the group formed by samples from the LS segment (in their totality 100 %), GII from the MS segment (in their totality 100 %) and the GIII from the US segment (in their totality 100 %). The use of the MS enables the formation of three groups, which coincides with the division into landscape segments. The centroid of the means test (based on the variables MSADFE, MSTS,
MSCL, Clay, V% and pH) of Hoteling was significant
at 5 %, confirming the discrimination between groups GI and GII observed in the cluster analysis.
The dendrogram (Figure 4) provided highly important information, by clearly showing the possibility of identifying landscape segments based on soil MS, which is an important soil property capable of mapping more homogeneous areas, in lithostratigraphic transition areas of sandstone-basalt in Oxisols. Therefore, the results obtained by descriptive statistics and multivariate analysis allow the conclusion that magnetic susceptibility could be applied at a larger scale in the identification of landscape
Figure 2. Biplot dispersion graph of the scores of the principal components PC1 and PC2: TS (total sand), Cl (clay content), Silt (silt content), MSADFE (magnetic susceptibility of the air-dried fine earth), MSTS (magnetic susceptibility of the total sand fraction), MSCl (magnetic susceptibility of the clay fraction), M (soil moisture), FCO2 (soil CO2 emission), GMD
(geometric mean diameter), TPV (total pore volume), OM (soil organic matter), PAV (available phosphorus), V% (base saturation), pH (hydrogenic potential). Landscape segments: Upper Slope (US), Middle Slope (MS) and Lower Slope (LS), N=60.
segments and to provide knowledge about soils on a detailed scale, in view of the current discussions about the establishment of standard mapping criteria.
CONCLUSIONS
1. The magnetic susceptibility of the air-dried fine earth and of the clay fraction seems to be able to separate the soil from the lower slope from the soils of the upper and middle slope in the transition areas of sandstone-basalt.
2. The multivariate statistics, by principal component analysis showed that the property magnetic susceptibility of the clay fraction had the greatest discriminatory power, with the highest correlation with magnetic susceptibility of ADFE in the first principal component. However, in view of the simpler measurement and also its high correlation with the first component, the magnetic susceptibility of ADFE can be considered a tool that facilitates the identification of landscape segments and enables the mapping of more homogeneous areas in regions with soil magnetic susceptibility.
LITERATURE CITED
BARBIERI, D.M.; MARQUES JR., J.; ALLEONI, L.R.F.; GARBUIO, F.J. & CAMARGO, L.A. Hillslope curvature, clay mineralogy, and phosphorus adsorption in an Alfisol cultivated with sugarcane. Sci. Agric., 66:819-826, 2009.
Figure 4. Dendrogram of the interrelationships of the three landscape segments: Upper slope (US), Middle Slope (MS) and Lower Slope (LS), obtained in the cluster analysis using the Euclidean distance and Ward algorithm, referring to the properties MSADFE (magnetic susceptibility of the air-dried fine earth), MSTS (magnetic susceptibility of the total sand fraction), MSCl (magnetic susceptibility of the clay fraction), Clay (clay content), V% (base saturation) and pH (hydrogenic potential), N = 60.
BLUNDELL, A.; HANNAM, J.A.; DEARING, J.A. & BOYLE, J.F. Detecting atmospheric pollution in surface soils using magnetic measurements: A reappraisal using an England and Wales database. Environ. Pollut., 157:2878-2890, 2009. BRITO, L.F.; MARQUES JR, J.; PEREIRA, G.T. & LA SCALA JR., N. Spatial variability of soil CO2 emission in different
topographic positions. Bragantia, 69:19-27, 2010. BUI, E.N. Soil survey as a knowledge system. Geoderma,
120:17-26, 2004.
CAMPOS, M.C.C.; MARQUES JR, J.; PEREIRA, G.T.; MONTANARI, R. & CAMARGO, L.A. Relações solo paisagem em uma litossequência arenito-basalto na região de Pereira Barreto, SP. R. Bras. Ci. Solo., 31:519-529, 2007. CARNEIRO, A.A.O.; TOUSO, A.T. & BAFFA, O. Avaliação da susceptibilidade magnética usando uma balança analítica. Quím. Nova, 26:952-956, 2003.
CARVALHO JR, W.; SCHAEFER, C.E.G.R.; SILVA CHAGAS, C. & FERNANDES FILHO, E.I. Análise multivariada de argissolos da faixa atlântica brasileira. R. Bras. Ci. Solo., 32:2081-2090, 2008.
CUNHA, P.; MARQUES JR, J.; CURI, N.; PEREIRA, G.T. & LEPSCH, I.F. Superfícies geomórficas e atributos de Latossolos em uma seqüência arenítico-basaltica da região de Jaboticabal (SP). R. Bras. Ci. Solo, 29:81-90, 2005. CHAPARRO, M.A.E.; CHAPARRO, M.A.E.; MARINELLI, C.
DANIELS, R.B. & NELSON, L.A. Future variability and productivity: Future developments. Soil Sci. Soc., 51:279-291, 1987.
DARLYMPLE, J.B.; BLONG, R.J. & CONACHER, A.J. A hypothetical nine unit land surface model. Geomorphologie, 12:60-76, 1968.
DEARING, J.A.; HAY, K.L.; BABAN, S.M.K.; HUDDLESTON, A.S.; WELLINGTON, E.M.H. & LOVELAND, P.J. Magnetic susceptibility of soil: an evaluation of connecting theories using a national data set. Geophys. J. Inter., 127:728-734, 1996.
EMBRAPA - Empresa Brasileira de Pesquisa Agropecuária. Centro Nacional de Pesquisa de Solos. Manual de métodos de análise de solo. 2. ed. Brasília: Ministério da Agricultura e do Abastecimento / EMBRAPA-CNPS, 1997. 212 p. EMPRESA BRASILEIRA DE PESQUISA AGROPECUÁRIA
-EMBRAPA. Centro Nacional de Pesquisa de Solos. Sistema brasileiro de classificação de solos. Brasília, 2006. 306p. FONTES, M.P.F.; OLIVEIRA, T.S.; COSTA, L.M. & CAMPOS,
A.A.G. Magnetic separation and evaluation of magnetization of Brazilian soils from different parent materials. Geoderma, 96:81-99, 2000.
FREDDI, O.S.; FERRAUDO, A.S. & CENTURION, J.F. Análise multivariada na compactação de um latossolo vermelho cultivado com milho. R. Bras. Ci. Solo., 32:953-961, 2008. GARDNER, W.H. Water content. In: KLUTE, A., ed. Methods of soil analyses. Madison, ASA, 1986. p.493-541. (Agronomy Monography, 9).
HAIR, J.F.; ANDERSON, R.E.; TATHAM, R.L. & BLACK, W. Análise multivariada de dados. Porto Alegre, Bookman, 2005. 593p.
JOHNSON, R.A. & WICHERN, D.W. Applied multivariate statistical analysis. 5.ed. Upper Saddle River, Prentice Hall, 2002. 767p.
JOLLIFFE, I.T. Discarding variables in a principal component analysis. I: Artificial data. J. Royal Statist. Soc. Series C, 21:160-173, 1972.
KAISER, H.F. The varimax criterion for analytic rotation in factor analysis. Psychometrika, 23:187-200, 1958. KRAVCHENKO, A.N.; ROBERTSON, G.P.; THELEN, K.D. &
HARWOOD, R.R. Management, topographical, and weather effects on spatial variability of crop grain yields. Agron. J., 97:514-23, 2005.
KEMPER, W.D. & ROSENAU, R.C. Aggregate stability and size distribution. In: KLUTE, A., ed. Methods of soil analysis. Physical and mineralogical methods. 2.ed. Madison, ASA, 1986. Part 1. p.425-441. (Agronomy Monography, 9).
LEGROS, J.P. Mapping of the soil. Lausanne, Presses Polytechniques et Universitaires Romandes, 2006. 411p. LEÃO, M.G.A.; MARQUES JR., J.; SOUZA, Z.M. & PEREIRA, G.T. Variabilidade espacial da textura de um latossolo sob cultivo de citros. Ci. Agrotec., 34:121-131, 2010.
MARQUES JR, J. Caracterização de áreas de manejo específico no contexto das relações solo-relevo. Jaboticabal, Universidade Estadual Paulista, 2009. 113p. (Tese Livre-Docência)
McKENZIE, N.J. & GALLANT, J.C. Digital soil mapping with improved environmental predictors and models of pedogenesis. In: LAGACHERIE, P.; MCBRATNEY, A.B. & VOLTZ, M., eds. Deve lopments in soil science. Amsterdam, Elsevier, 2007. v.31. p.327-349.
MONTANARI, R.; PEREIRA, G.T.; MARQUES JR, J.; SOUZA, Z.M.; PAZETO, R.J. & CAMARGO, L.A. Variabilidade espacial de atributos químicos em Latossolo e Argissolos. Ci. Rural., 38:1266-1272, 2008.
PENNOCK, D.J. & CORRE, M.D. Development and application of landform segmentation procedures. Soil Tillage Res., 58:151-162, 2001.
PENNOCK, D.; WALLEY, F.; SOLOHUB, M.; SI, B. & HNATOWICH, G. Topographically controlled yield response of canola to nitrogen fertilizer. Soil Sci. Soci. Am. J., 65:1838-1845, 2001.
RAIJ, B. van; QUAGGIO, J.A.; CANTARELLA, H.; FERREIRA, M.E.; LOPES, A.S. & BATAGLIA, C.O. Análise química do solo para fins de fertilidade. Campinas, Fundação Cargill, 1987. 170p.
SANCHEZ, R.B.; MARQUES JR., J.; SOUZA, Z.M.; PEREIRA, G.T. & MARTINS FILHO, M.V. Variabilidade espacial de atributos do solo e de fatores de erosão em diferentes pedoformas. Bragantia, 68:1095-1103, 2009.
SENA, M.M.; FRIGHETTO, R.T.S.; VALARINI, P.J.; TOKESHI, H. & POPPI, R.J. Discrimination of management effects on soil parameters by using principal component analysis: a multivariate analysis case study. Soil Tillage Res., 67:171-181, 2002.
SHEPHERD, K.D. & WALSH, M.G. Infrared spectroscopy -enabling an evidence-based diagnostic surveillance approach to agricultural and environmental management in developing countries. J. Near Infrared Spectrosc., 15:1-19, 2007. SILVA, A.R.; SOUZA JR., I.G. & COSTA, A.C.S. Suscetibilidade
magnética do horizonte B de solos do Estado do Paraná. R. Bras. Ci. Solo, 34:329-338, 2010.
SIQUEIRA, D.S.; MARQUES JR., J.; MATIAS, S.S.R.; BARRÓN, V.; TORRENT, J.; BAFFA, O. & OLIVEIRA, L.C. Correlation of properties of Brazilian Haplustalfs with magnetic susceptibility measurements. Soil Use Manag., 26:425-431, 2010.
SOUZA, Z.M.; MARQUES JR., J.; PEREIRA, G.T. & MOREIRA, L.F. Variabilidade espacial do pH, Ca, Mg e V% do solo em diferentes formas do relevo sob cultivo de cana-de-açúcar. Ci. Rural., 34:1763-1771, 2004.
SOUZA, Z.M.; MARQUES, JR., J. & PEREIRA, G.T. Spatial variability of the physical and mineralogical properties of the soil from the areas with variation in landscape shapes. Braz. Arch. Biol. Technol., 52:305-316, 2009.
TORRENT, J.; LIU, Q.S. & BARRO, N.V. Magnetic minerals in Calcic Luvisols (Chromic) developed in a warm mediterranean region of Spain: Origin and paleoenvironmental significance. Geoderma, 154:465-472, 2010.
TORRENT, J.; BARRÓN, V. & LIU, Q.S. Magnetic enhancement is linked to and precedes hematite formation in aerobic soil. Geophys. Res. Letters, 33:L02401, 2006.
TROEH, F.R. Landform equations fitted to contour maps. Am. J. Sci., 263:616-627, 1965.
VEROSUB, K.L. & ROBERTS, A.P. Environmental magnetism: Past, present and future. J. Geophys. Res., 100:2175-2192, 1995.
VIDAL-TORRADO, P.; LEPSCH, I.F. & CASTRO, S.S. Conceitos e aplicações da relações pedologia-geomorfologia em regiões tropicais úmidas. In: VIDAL-TORRADO, P.; ALLEONI, L.R.F.; COOPER, M.; SILVA, A.P. & CARDOSO, G.J., eds. Tópicos em ciências do solo. Viçosa, MG, Sociedade Brasileira de Ciência do Solo, 2005. v.4. p.145-192.
WARRICK, A.W. & NIELSEN, D.R. Spatial variability of soil physical properties in the field. In: HILLEL, D., ed. Applications of soil physics. New York, Academic Press, 1980. p.319-344.