ISSN 0100-2945 http://dx.doi.org/10.1590/0100-29452016085
SPATIAL DISTRIBUTION AND SEQUENTIAL SAMPLING
OF
Brevipalpus phoenicis
IN CITRUS
1WALTER MALDONADO JR2, JOSé CARLOS BARBOSA3, MARíLIA GREGOLIN COSTA4,
PAuLO CéSAR TIBuRCIO GONçALvES5, TIAGO ROBERTO DOS SANTOS6
ABSTRACT-Among the pests of citrus, one of the most important is the red and black flat mite Brevipalpus phoenicis (Geijskes), which transmits the Citrus leprosis virus C (CiLv-C). When a rational pest control plan is adopted, it is important to determine the correct timing for carrying out the control plan. Making this decision demands constant follow-up of the culture through periodic sampling where knowledge about the spatial distribution of the pest is a fundamental part to improve sampling and control decisions. The objective of this work was to study the spatial distribution pattern and build a sequential sampling plan for the pest. The data used were gathered from two blocks of valencia sweet orange on a farm in São Paulo State, Brazil, by 40 inspectors trained for the data collection. The following aggregation indices were calculated: variance/
mean ratio, Morisita index, Green’s coefficient, and k parameter of the negative binomial distribution. The
data were tested for fit with Poisson and negative binomial distributions using the chi-square goodness of fit
test. The sequential sampling was developed using Wald’s Sequential Probability Ratio Test and validated through simulations. We concluded that the spatial distribution of B. phoenicis is aggregated, its behavior
best fitted to the negative binomial distribution and we built and validated a sequential sampling plan for
control decision-making.
Index terms: red and black flat mite, negative binomial, Poisson distribution, decision making, integrated pest management.
DISTRIBUIÇÃO ESPACIAL E AMOSTRAGEM SEQUENCIAL
DE Brevipalpus phoenicis EM CITRUS
RESUMO-Dentre as pragas dos citros, uma das mais importantes é o ácaro da leprose Brevipalpus phoenicis
(Geijskes), que transmite o vírus da leprose dos citros (CiLv-C). Quando um plano racional de controle de pragas é adotado, é importante se determinar o tempo correto para se dar início ao plano de controle. Para tanto, é necessário acompanhamento constante da cultura através de amostragens periódicas, onde o conhecimento do comportamento espacial da praga é fundamental. O objetivo deste trabalho foi estudar o padrão de distribuição espacial e desenvolver um plano de amostragem sequencial para a praga. Os dados utilizados foram coletados em dois talhões de laranja valência em uma fazenda no estado de São Paulo, Brasil, por 40 inspetores treinados para a atividade. Foram calculados os seguintes índices de agregação:
variância/média, índice de Morisita, coeficiente de Green e parâmetro k da distribuição binomial negativa. Foi testado o ajuste dos dados às distribuições de Poisson e binomial negativa utilizando o teste de qui-quadrado de aderência. O plano de amostragem foi desenvolvido utilizando o Teste Sequencial da Razão de verossimilhança de Wald e validado através de simulações. Foi concluído que a distribuição espacial de
B. phoenicis é agregada, seu comportamento espacial pode ser explicado e previsto através da distribuição binomial negativa e foi construído e validado um plano de amostragem sequencial para a tomada de decisão sobre seu controle.
Termos para indexação: ácaro da leprose, binomial negativa, distribuição de Poisson, decisão de controle, manejo integrado de pragas.
1(Paper 278-15). Received December 08, 2015. Accepted May, 03 2016.
2Postdoctoral Researcher, Department of Exact Sciences, São Paulo State university ‘Júlio de Mesquita Filho’, university of Agriculture and veterinary Sciences - FCAv/uNESP (CNPq). via de acesso Prof. Paulo Donato Castellane, 14884-900, Jaboticabal, SP, Brazil. E-mail: [email protected]
3Full Professor, Department of Exact Sciences, São Paulo State university ‘Júlio de Mesquita Filho’, university of Agriculture and veterinary Sciences - FCAv/uNESP (CNPq). via de acesso Prof. Paulo Donato Castellane, 14884-900, Jaboticabal, SP, Brazil. Brazil’s Citrus Defense Fund (Fundecitrus). E-mail: [email protected]
4Professor uNIFEB. Av. Prof. Roberto Frade Monte, n. 389 - Bairro Aeroporto, 14783-226, Barretos, SP, Brazil. E-mail: mariliagcosta@ hotmail.com
INTRODUCTION
Among the major pests of citrus, the red and
black flat mite Brevipalpus phoenicis (Geijskes) stands out because of the damage caused by the transmission of the Citrus leprosis virus (CiLv-C), which is the causal agent of the leprosis disease. The mite became important in Brazil in 1963 when it was discovered that the species was associated to CiLv-C transmission. Currently, the damage caused is estimated to reach from 35 to 100% of yield and includes early fall of fruit, depreciation of injured fruit for the fresh fruit market, defoliation of the plant, drying of affected branches, and reduction of next year’s bloom (YAMAMOTO et al., 2005). The time required for a severely infested area to recover can reach up to 2 years (MÜLLER et al.,2005).
The mite has a low ambulatory capacity, therefore, dispersion occurs mostly on trees located within rows. This dispersal might be due to human activities, such as pruning branches or harvesting fruits from infested trees located within a row (BASSANEZI and LARANJEIRA, 2007). Furthermore, wind speed is also considered an important agent of dispersal (ALvES et al., 2005). Making use of geostatistical methods, a recent study showed an aggregated distribution pattern for the
disease (i.e., incidence of CiLV-C), with fitted models
showing spatial dependence ranging from 9 to 30 m (OLIvEIRA JR et al., 2016).
It is also known that the combination of longer days, higher temperatures, lower relative humidity levels and lower evapotranspiration increases the probability of B. phoenicis infestation. On the other hand, successive rain events and relative humidity levels above 83% reduce this probability. Also, reduction in available soil-water fraction and increasing insolation and photoperiod promote higher infestation rates (LARANJEIRA et al., 2015).
The main method for controlling the citrus red
and black flat mite is the chemical intervention, which
is used to maintain the population density of the pest below the level of economic injury (OMOTO, 1995). The annual expenditure on acaricides to control red
and black flat mites has been approximately US$ 70 million, a figure that emphasizes the economic
importance of controlling this disease and its vector and the need for better integrated pest management strategies (YAMAMOTO et al., 2005). Rational control strategies have becoming a matter of great concern, particularly with respect to resistance development to acaricides, since some compounds have been used for more than 30 years (LEEuWEN et al., 2015).
Considering the lack of spatial association between infested and diseased plants, the fact that
sampling of B. phoenicis should be recommended
for action-threshold purposes (BASSANEZI and LARANJEIRA, 2007) and the compelling need for enforcement of good agricultural practices in orange production, specially regarding pesticide applications (NAKANO et al., 2016), we undertook this work to study the spatial distribution of B. phoenicis in citrus blocks and to develop a sequential sampling plan for the pest.
MATERIALS AND METhODS
Surveys were performed at Cambuhy Agrícola Ltd. Farm, located in the Municipality of Matão, São Paulo State, Brazil. The samples were collected by 40 inspectors who were trained for this activity.
Magnifying glasses (10X magnification) were used to identify and quantify the mites, and the field survey
data were recorded in a spreadsheet. The inspection was conducted in two predetermined blocks of six-year-old valencia sweet orange on Sunki mandarin rootstock, with 2388 and 3031 trees, respectively, with plant spacing of 3.5 x 7 m.
The survey was done inspecting three fruits from each one of the trees in the blocks, totaling 16257 fruits inspected. Fruits were collected from inside the canopy, with preference given to those with scab lesions (GRAvENA, 1992). The mites on the surface of the fruit were counted for numbers less than or equal to 10. The data were divided into three categories: mites in three fruits per plant, number of fruits with mites per plant and fruits with more than 10 mites per plant.
Spatial Distribution. To study the
degree of aggregation of the mites, we used the following indices of aggregation: variance/mean
ratio (I) (RABINOvICH, 1980), Morisita index
(Id) (MORISITA, 1962), Green’s coefficient (Cx)
(GREEN, 1966), and k parameter of negative
binomial distribution (BLISS and FISHER, 1953; SOuTHWOOD, 1978; ELLIOT, 1979), calculated using the maximum likelihood method. The data
were tested for fit with Poisson and negative binomial distributions using the chi-square goodness-of-fit test.
Index I is calculated according to I = s/m, where s2 is the sample variance, and m is the sample
mean. values equal to one indicate a random spatial distribution. values lower than one indicate a uniform distribution, and values above one indicate an aggregate distribution (Rabinovich, 1980).
Morisita index (Id) values equal to one indicate a random spatial distribution. values less than one
The negative binomial distribution, characterized by the variance being greater than the mean, represents an aggregated or contagious distribution of insects. The range of probabilities of negative binomial distribution is obtained using the following calculation (JOHNSON and KOTZ, 1969):
wherek is the k exponent of negative binomial distribution, m is the mean, and P(x) is the probability of x individuals in a sampling unit.
The chi-square goodness-of-fit test examines the fit of the data to each of the probability distributions.
The observed frequencies are compared with the expected frequencies for the distribution. The model
provides a good fit when the observed and expected
frequencies are close, as given by the following expression:
where Nc is the number of classes of the frequency distribution, OFi is the observed frequency in the i-th class, and EFi is the expected frequency in the i-th class.
The degrees of freedom (df) associated with the chi-square statistic are given by the following formula:
df = Nc – Np – 1
where Nc is the number of classes of frequency distribution and Np is the number of estimated parameters in the sample (including the sample mean).
The test rejects the adjustment of the studied distribution at a level of probability a if
X2 > X2
(Nc-NP-1 df, a)
Sequential Sampling. For development of the sequential sampling was used de Sequential Probability Ratio Test (SPRT). This method tests, using the lesser possible sample size, the hypothesis H0: m = m0 vs. H1: m = m1,where m represents the infestation means and m1 > m0. The rejection of H0 may indicate the decision to start control and its acceptance not to start any control methods. The decision in the SPRT is made through two parallel lines on the Cartesian plane, where the sum of the values observed is the ordinate and the sample index is the abscissa. When the indicate a uniform distribution, and values greater than
one indicate a contagious distribution. It is calculated by (MORISITA, 1962):
where n is the number of sampling units, and xi is the number of insects in the i-th trap. The departure from randomness was tested using the following formula:
Green’s coefficient (Cx) ranges from -1 to 1. Negative values indicate a uniform distribution. Positive, small values indicate a random distribution, and values close to one indicate maximum contagion (Green, 1966). Cx is determined using the following formula:
The k parameter of the negative binomial distribution estimated by the maximum likelihood method is calculated iteratively and is the value that equates the two members of the following (Bliss and Fisher, 1953):
where A(xi) is the sum of the frequencies of counts exceeding xi, N is the sample size, and nc is the number of classes of the frequency distribution.
Small k values indicate a highly aggregated
distribution. values between two and eight indicate moderate aggregation, and values greater than eight indicate a random distribution (SOuTHWOOD, 1978).
Poisson distribution, also known as random distribution, is determined by the variance equals the mean (BARBOSA and PERECIN, 1982). The range of probabilities of the Poisson distribution (JOHNSON and KOTZ, 1969) is given by the following:
ordinate value crosses the upper line, it recommends to start control. If the ordinate value of the respective sample index in the abscissa is between the lines it recommends to sample another unit and if it is below the lower line it recommends not to start any control (WALD, 1945).
The SPRT also makes it possible to estimate an operating characteristic curve (OC), that represents the probability of H0 acceptance in terms of the infestation mean, and the average amount of inspection required by the test to reach control decision (Ep(n)), also in terms of the infestation mean. SPRT’s type I and II
errors were defined as 0.05 both.
Plan validation. The constructed sequential sampling plan was validated through simulations in the year of 2014, with the surveys starting in September
22, 2014 and finished in October 28, 2014. Three
blocks were surveyed by sampling three fruits per plant of each and every plant and counting the number
of fruits with mites, where the first one had 2595, the
second 1856 and the third 473 plants. The plan was applied to the survey data to check the precision of the recommendations. All the calculations and simulations in this work were performed using Microsoft Excel and R (R CORE TEAM, 2016).
RESULTS AND DISCUSSION
Spatial Distribution. In all samples, the values of I-index were greater than one, indicating an aggregated distribution for all the variables: mites per plant, fruits with at least one mite, and fruits with more than 10 mites. Iδ was also greater than one for the three variables. These values were also tested with the chi-square test and were found to be
significant at the 1% level of probability, indicating
that the spatial arrangement of the mite in the blocks was aggregated (Table 1). Based on these results for the departure from randomness, we can state that Cx
also indicated aggregation.
The k parameter, estimated using the
maximum likelihood method, was between zero and two, which indicated a highly aggregated distribution. The observed values of the two blocks were very close, suggesting that the degree of infestation (22.67% of plants infested for block 1
and 8.6% for block 2) did not influence the degree
of aggregation of the pest.
With respect to the Poisson distribution fit,
chi-square results greater than those of the negative
binomial fit were obtained (Table 2), indicating the best fit of the negative binomial, confirmed by the
aggregation indices. Lower values of the chi-square
test were observed for the number of fruits with more than 10 mites, followed by the number of fruits with
at least one mite and, finally, the number of mites in
three fruits.
The model that best fitted all of the cases
studied was the negative binomial distribution model.
Even with a significant value for the chi-square
test in some cases, the negative binomial model is the most suitable for explaining and predicting the
spatial distribution of the pest, confirming that the
distribution of the mite is aggregated (PERECIN and OLIvEIRA, 1979; PINTO et al., 1995).
The best fit to negative binomial distribution
is a common occurrence among phytophagous mites. Aggregated distribution has been recorded for B. phoenicis (Geijskes) (PERECIN and OLIvEIRA, 1979) and Phyllocoptruta oleivora (Ashm) (HALL et al., 1994) on citrus, as well as Calacarus heveae
(Feres) on rubber (FERLA et al., 2007), Panonychus ulmi (Koch) on apple (RIBEIRO et al., 1990),
Tetranychus urticae (Koch) on roses (SO, 1991),
Oligonychus yothersi (McGregor) (Tetranychidae)
(GOuvEA et al., 2007) and Dichopelmus notus
(Keifer) (BERTOLDO et al., 2008) on mate. Sequential Sampling. The negative binomial distribution was used to build a sequential sampling plan using Wald’s (1945) SPRT, on the basis of the number of fruits with at least one mite data. The k
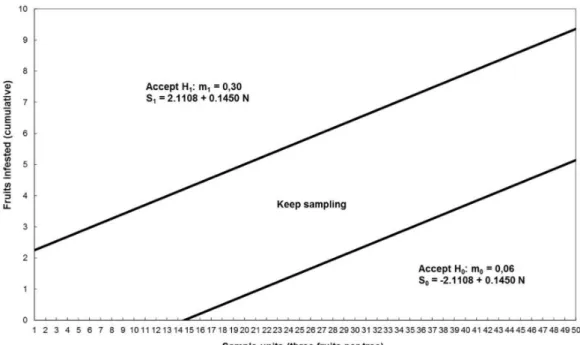
value common to the blocks was calculated by the mean of its individual k values, having 0.94325. The upper and lower threshold values were 2% and 10% of infestation (YAMAMOTO et al. 2005). Considering that the sampling should be conducted harvesting three fruits each sample unit (tree), these values represent infestation means of approximately µ0 = 0.06 and µ1 = 0.3.
Therefore, the upper threshold, where H1 is accepted and the infestation rate may be above 10% is S1 = 2.1108 + 0.145N and, the lower threshold where H0 is accepted and the infestation rate may be below 2% is S0 = -2.1108 + 0.145N (Fig. 1). It is also possible to verify the test’s probability results using an operating characteristic curve, that shows on the ordinate the H0 acceptance probability (Fig. 2), and an expected sample size curve, in terms of the infestation mean (Fig. 3). The maximum expected sample size is 27 sample units (trees) and may occur when the infestation mean is around 0.123 fruits infested per tree.
range from 45% to 55%. Our plan showed much better estimated error rates, with approximately the same sample size, or even lower. This might occur because of the consecutive tree sampling, which is done considering the spatial behavior of the pest.
Plan Validation. The validation data were subjected to simulations to test the constructed sequential sampling plan in two sets of simulations, one with 1000 applications of the plan and the other with only 10. This was done to show that the plan presents a reliable decision recommendation regardless of the order in which plants inspection occurs, since the plants picked in the simulations were randomized using a uniform distribution. In
other words, the validation proved that there is no
need for a specific walk pattern for carrying out
the sequential sampling plan. These results can be
verified in Table 3.
The validation results also showed that the recommendation errors are within the expected range. These errors rates are much lower than the currently
used fixed-size sampling method, which can reach
up to 67% (GONçALvES, 2007). Therefore, the proposed sampling plan for Brevipalpus phoenicis
showed reliable recommendations and should be considered as a management tool for reducing the time spent in sampling procedures.
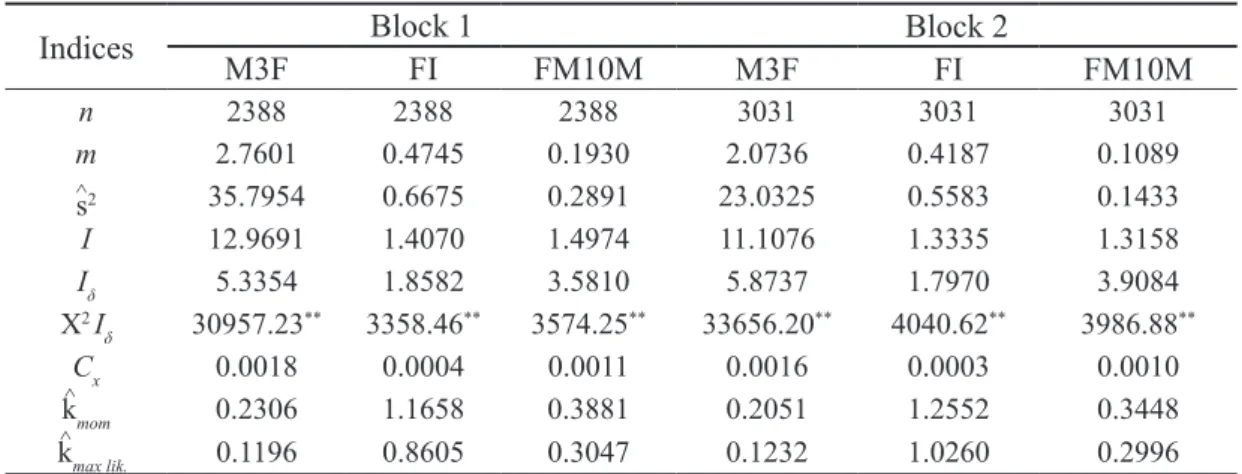
TABLE 1- Means, variances, and aggregation indices for number of Brevipalpus phoenicis mites per plant counted on three fruits (M3F), fruits infested (FI), and fruits with more than 10 mites (FM10M).
Indices Block 1 Block 2
M3F FI FM10M M3F FI FM10M
n 2388 2388 2388 3031 3031 3031
m 2.7601 0.4745 0.1930 2.0736 0.4187 0.1089
s2 35.7954 0.6675 0.2891 23.0325 0.5583 0.1433
I 12.9691 1.4070 1.4974 11.1076 1.3335 1.3158
Iδ 5.3354 1.8582 3.5810 5.8737 1.7970 3.9084
X2I
δ 30957.23** 3358.46** 3574.25** 33656.20** 4040.62** 3986.88**
Cx 0.0018 0.0004 0.0011 0.0016 0.0003 0.0010
kmom 0.2306 1.1658 0.3881 0.2051 1.2552 0.3448
kmax lik. 0.1196 0.8605 0.3047 0.1232 1.0260 0.2996
n = number of sample units; m = mean; s2 = variance; I = variance/mean; I
δ= Morisita index; X2Iδ = departure from randomness test
for Iδ; Cx = Green’s coefficient; kmom = k parameter estimated by the method of moments; kmax lik. = k parameter estimated by the method of maximum likelihood.
** = Significant chi-square test at 1% probability level.
TABLE 2 - Results of the chi-square goodness-of-fit test for the Poisson and negative binomial distributions for Brevipalpus phoenicis in citrus in two blocks.
Poisson Negative Binomial
X² DF P X² DF P
Block 1 – Fruits infested 245.88** 2 < 0.0001 6.51* 1 0.0107
Block 1 – Fruits with more than 10 mites 106.63** 1 < 0.0001 2.20NS 1 0.1379
Block 1 – Mites in three fruits 19363.14** 6 < 0.0001 77.73** 25 < 0.0001
Block 2 – Fruits infested 292.70** 2 < 0.0001 18.01** 1 < 0.0001
Block 2 – Fruits with more than 10 mites 357.28** 2 < 0.0001 5.93* 1 0.0149
Block 2 – Mites in three fruits 7666.32** 4 < 0.0001 40.36** 18 0.0016
X² = chi-square goodness-of-fit test; DF = degrees of freedom; P = probability level of the chi-square test; * = Significant at the 5% probability level; ** = Significant at the 1% probability level; NS = Non-significant at the 5% probability level.
^
^ ^
^
TABLE 3 - validation results for the sequential sampling of Brevipalpus phoenicis.
Fruits with mites
Block 1 Block 2 Block 3
Total plants 2595 1856 473
Survey data
Mean 0.03468 0.02424 0.01480
variance 0.05662 0.03014 0.01461
Standard deviation 0.23795 0.17361 0.12088
SPRT Results (1000 simulations)
Mean 0.03517 0.02033 0.01138
Mean number of requires samples 19 18 17
Standard deviation of the mean number of requires samples 8 6 5
Recommendation – Start control 23 (2.3%) 10 (1%) 0 (0%)
Recommendation – Do not start control 977 (97.7%) 990 (99%) 1000 (100%)
SPRT Results (10 simulations)
Mean 0.02144 0.02508 0.01363
Mean number of requires samples 21 19 17
Standard deviation of the mean number of requires samples 11 5 3
Recommendation – Start control 0 (0%) 0 (0%) 0 (0%)
Recommendation – Do not start control 10 (100%) 10 (100%) 10 (100%)
FIGURE 2- Operating characteristic curve (OC) of Wald’s SPRT for the sequential sampling plan of
Brevipalpus phoenicis.
ACkNOwLEDGMENTS
We thank CNPq for the fellowship to the first
author (WMJ), FCAv/uNESP for the infrastructure provided, Cambuhy Agrícola Ltd. and Citrosuco/ Fischer Ltd. for help with the surveys.
REFERENCES
ALvES, E.B.; CASARIN N.F.B.; OMOTO, C. Mecanismos de dispersão de Brevipalpus phoenicis
(Geijskes) (Acari: Tenuipalpidae) em pomares de citros. Neotropical Entomology, Londrina, v.34, p.89-96, 2005.
B A R B O S A , J . C . ; P E R E C I N , D . M o d e l o s probabilísticos para distribuições de lagartas de
Spodoptera frugiperda (J.E.SMITH, 1797), na cultura do milho. Cientifica, Jaboticabal, v.10, p.181-191, 1982.
BASSANEZI, R.B.; LARANJEIRA, F.F. Spatial patterns of leprosis and its mite vector in commercial citrus groves in Brazil. Plant Pathology, Oxford, v.56, p.97-106, 2007.
BERTOLDO, G.; GOuvEA, A.de; ALvES, L.F.A.
Plano de amostragem para Dichopelmus notus
(Eriophyidae) na cultura da erva-mate. Ciência Rural, Santa Maria, v.38, n.3, p.601–606, 2008.
BLISS, C.I.; FISCHER, R.A. Fitting the negative
binomial to biological data and a note on the efficient fitting of the negative binomial. Biometrics, New York, v.9, p.176-200, 1953.
ELLIOT, J.M. Some methods for the statistical analysis of samples of benthic invertebrates. 2nd ed. Westmoreland: The Ferry House, 1979.
F E R L A , N . J . ; M O R A E S G . J . ; B O N ATO , O.Distribuição espacial e plano de amostragem de
Calacarus heveae (Acari) em seringueira.Iheringia, Série Zoológica, Porto Alegre, v.97, p.447-451, 2007.
GONçALvES, P.C.T. Metodologia de amostragens para monitoramento do ácaro da leprose
Brevipalpus phoenicis (Geijskes, 1939) em cultura de citros. 2007. 52 f. Dissertação (Mestrado em Produção vegetal) – Faculdade de Ciências Agrárias e veterinárias, universidade Estadual Paulista, Jaboticabal, 2007.
GOuvEA, A.; BERTOLDO, G.; ALvES, L.F.A. Plano de amostragem presença-ausência para Oligonychus yothersi (McGregor) (Acari: Tetranychidae) na cultura da erva-mate. Neotropical Entomology, Londrina, v.36, p.583-586, 2007.
GRAvENA, S. MIP citros: avanços e inovações na citricultura brasileira. Laranja, Cordeirópolis, v.13, p.541-552, 1992.
GREEN, R.H. Measurement of non-randomness in spatial distributions. Researches on Population Ecology, Tokyo, v.8, p.1-7, 1966.
HALL, D.G.; CHILDERS, C.C.; EGER, J.E. Spatial dispersion and sampling of citrus rust mite (Acari: Eriophyidae) on fruit in ‘Hamlin’ and ‘valencia’ orange groves in Florida. Journal of Economic Entomology, Lanham, v.87, p.687-698, 1994.
JOHNSON, R.A.; KOTZ, S .Discrete distributions.
Boston: Houghton Mifflin, 1969.
LARANJEIRA, F.F.; SILvA, S.X.B.; ANDRADE, E.C.; ALMEIDA, D.O.; SILvA, T.S.M.; SOARES, A.C.F.; FREITAS-ASTÚA, J. Infestation dynamics of Brevipalpus phoenicis (Geijskes) (Acari: Tenuipalpidae) in citrus orchards as affected by edaphic and climatic variables. Experimental and Applied Acarology, Dordreht, v.66, n.4, p.491-508, 2015.
LOPES M.v.; OLIvEIRA, C.A.L.; BARRETO, M.; BARBOSA, J.C.; ROSSI, F.M. Dimensionamento de amostras para monitoramento do ácaro da leprose
Brevipalpus phoenicis (Geijskes, 1939) em citros. Revista Brasileira de Fruticultura, Jaboticabal, v.29, n.3, p.671-676, 2007.
MORISITA, M. Iδ-index, a measure of dispersion of
individuals. Researches on Population Ecology,
Tokyo, v.4, n.1, p.1-7, 1962.
MÜLLER, G.W.; TARGON, M.L.P.N.; CARvALHO, A.S.; SOuZA, A.A.; RODRIGuES, J.C.v. Doenças de citros causadas por vírus e viróides.In: MATTOS JuNIOR, D.; DENEGRI, J.D.; PIO, R.M.; POMPEu JuNIOR, J. Citros. Campinas: Instituto Agronômico e Fundag, 2005.p.569-604.
NAKANO, v.E.; KuSSuMI, T.A.; LEMES, v.R.R.; KIMuRA, I.A.; ROCHA, S.B.; ALABuRDA, J.; OLIvEIRA, M.C.C.; RIBEIRO, R.A.; FARIA, A.L.R.; WALDHELM, K.C. Evaluation of pesticide residues in oranges from São Paulo, Brazil. Food Science and Technology , Chichester, v.36, n.1, p.40-48, 2016.
OLIvEIRA JR, F.; FARIAS, P.R.S.; SILvA, A.G.; RODRIGuES, K.C.v.; ARAÚJO, F.C.B. Spatial distribution of citrus leprosis in the Eastern Amazon. Revista Ciência Agronômica, Fortaleza, v.47, n.1, p.56-68, 2016.
OMOTO, C. Resistência de Brevipalpus phoenicis.In: OLIvEIRA, C.A.L.; DONADIO, L.C. Leprose dos citros. Jaboticabal: Funep, 1995. p.179-188.
PERECIN, D.; OLIvEIRA, C.A.L. Análise estatística em contagem de Brevipalpus phoenicis (Geijskes, 1939) na cultura dos citros, baseada na distribuição binomial negativa. Cientifica, Jaboticabal, v.7, p.211-219, 1979.
PINTO, R.A.; YAMAMOTO, P.T.; PAIvA, P.E.B.; GRAvENA, S. Amostragem seqüencial: uma metodologia rápida e segura. In: OLIvEIRA, C.A.L.; DONADIO, L.C.Leprose dos citros. Jaboticabal: Funep, 1995.p.147-158.
RABINOvICH, J.E. Introducción a la ecologia de poblaciones animales. Mexico: Continental, 1980.
R CORE TEAM. R: a Language and environment for statistical computing. vienna: R Foundation for Statistical Computing, 2016.
RIBEIRO, L.G.; vILLACORTA, A.; FOERSTER, L.A. Plano de amostragem presença-ausência para
Panonychus ulmi (Kock, 1836) (Acari: Tetranychidae) em macieira. Anais da Sociedade Entomológica do Brasil, Londrina, v.19, p.211-220, 1990.
SO, P.M. Distribution patterns of and sampling plans for Tetranychus urticae Koch (Acarina: Tetranychidae) on roses. Researches on Population Ecology, Tokyo, v.33, p.229-243, 1991.
SOuTHWOOD, T.R.E. Ecological methods, with particular reference to the study of insect populations. 2nd ed. New York: John Wiley, 1978.
WALD, A. Sequential tests of statistical hypothesis. Annals Mathematical Statistics, Ann Arbor, v.16, n.2, p.117-186, 1945.