Cluster evaluation of Brazilian and Moroccan goat populations using
physical measurements
Luanna Chácara Pires1, Théa Mírian Medeiros Machado2, Adriana Mello de Araújo3, João Batista Lopes da Silva1, Ricardo Frederico Euclydes2, Márcio da Silva Costa1,
Timothy Aanen Olson4
1 Departamento de Agronomia, Universidade Federal do Piauí, Bom Jesus, PI, Brasil. 2 Departamento de Zootecnia, Universidade Federal de Viçosa, Viçosa, MG, Brasil. 3 Embrapa Meio-Norte, Teresina, PI, Brasil.
4 Department of Animal Science, University of Florida, Gainesville, Florida, USA.
ABSTRACT - The aim of this study was to compare the genetic diversity of 12 populations of goats in Brazil and Morocco (n = 796) through the use of physical measurements and different multivariate techniques. Traits measured included wither height (WH), distance from the brisket to the ground (BH) and ear length (EL). The standardized Euclidean distance (D) was adopted. The D values were submitted to clustering analysis using hierarchical methods (from nearest neighbor and UPGMA - Unweighted Pair Group Method with Arithmetic Mean) and the numbers of clusters were analyzed using the Tocher optimization method. The population clustering was different depending on the method of analysis used. Among the hierarchical methods, UPGMA showed the best fit (CCC = 0.82). The Tocher method enabled the formation of four different clusters. Although the hierarchical and Tocher methods resulted in different cluster formations, both contributed to the interpretation of the genetic cluster divergence. The results obtained through UPGMA and Tocher optimization enable their use for future studies that may include a larger number of biometric variables on greater numbers of individuals and additional populations.
Key Words:biometry, divergence genetic, genetic resources, multivariate, zoometric indexes
Introduction
Goats can be classified according to type, use (milk, meat or dual-purpose) and geographical distribution. The most popular of the European dairy breeds are the Saanen, Alpine, Toggenbourg and Anglo-Nubian (Mason, 1988). In South Africa, the most popular breed is the Boer (Casey & Van Niekerk, 1988; Almeida & Schwalbach, 2000) and in Morocco are Drâa and Rhâali (Hossaini-Hilari & Mouslish, 2002). There are three types of goats in the northeastern of Brazil, the Marota (Freitas, 1941; Santiago, 1944), Azul (Machado, 1995) and Nambi (Barros, 1987; Santos, 1987), but the goats in northeastern Brazil consist mainly of undefined breeds (UDB) which, as the name implies, include a vast variety of coat patterns and conformation.
The physical measurements are important in studies of genetic diversity for considering the variation existing among various breed groups and also allowing for breed identification (Epstein, 1953; Mason, 1988). This methodology has been enhanced using the simultaneous measurement of several characteristics and the establishment of index between two physical measurements (Bourzat et al.,
1993; Bouchel et al., 1997). The identification of different genotypes, including crossbred ones, has been successfully exploited by multivariate analysis techniques (James & McCulloch, 1990; Franci et al., 2001). Among the most used methods in genetic divergence are the hierarchical and optimization methods (Cruz & Carneiro, 2006).
The most dissimilar genetic groups based on these types of analyses can be used, for example, in the formation of the so-called composite-cattle, in which mating is performed in a way to maintain heterosis and genetic diversity. In small populations it is possible to use these results to suggest matings that may result in greater heterozygosity. Therefore, it becomes evident that the study of diversity among populations and intra-populations can be useful to genetic improvement and conservation, guiding public policies and private initiatives.
The objectives were to analyze, by data of physical measurements, some methodologies for evaluation of variability among goat populations and intra-populations, and to determine the most effective clustering method, as well as to contribute to the knowledge of divergence among the populations studied.
ISSN 1806-9290
www.sbz.org.br R. Bras. Zootec., v.42, n.10, p.713-720, 2013
Material and Methods
The data used in this study were obtained from 796 female goats, of more than two years of age, from various herds in Brazil and Morocco. In Brazil, the data were from commercial breeds in Minas Gerais State and the Federal District. A total of 34 Toggenbourg, 86 Saanen, 28 Anglo-Nubian, 78 Alpine and 26 Boer goats were sampled. In Piauí State, in the northeast region of Brazil, we sampled local types including 29 Azul, 32 Marota, 35 Nambi and 123 Undefined Breed or UDB-PI goats.
In Morocco, the goats evaluated included: 102 local Drâa goats at the Center for Goat Research and in Sidi Flah village, Skoura; 34 goats called Zagora (locally considered to be crossbreds of Drâa) in Demnate, Ouarzazate, Center for Goat Research in Tahnnaout and Marrakech; and 189 Rhâali goats in Zagora.
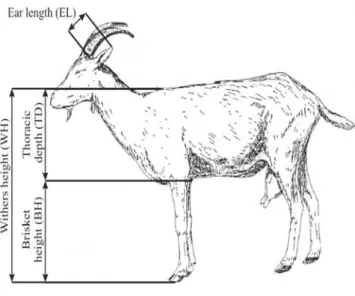
The physical measurements were taken using a tape measure and the animal was kept in a correct vertical position (Figure 1): wither height (WH) is the distance between the withers highest point to the front the distal extremity of the leg; the brisket height to the ground (BH) is the distance from the brisket to the ground; and the ear length (EL) is the distance from the base of the ear to its end. Thoracic depth (TD) is calculated as the difference between WH and BH. Although TD could be measured directly in the field, it is not easy to do so. Indexes were also calculated between the various measures, such as TD/WH, EL/TD and EL/WH.
The absence of valid records for birth dates resulted in the necessity of the use of dental chronology evaluation to
estimate age, according to the methodology described by Quittet (1978).
The data were analyzed by simple descriptive statistics, variance analysis (ANOVA) and Student Newman Keuls test – SNK (P<0.05) to compare averages of different populations (goat breeds and types) through the GLM procedure of SAS® (Statistical Analysis System,
version 8.0). Analysis of variance examined effect of population on the physical measurements. The effect of the multicollinearity linear dependence between variables, which can lead to the formation of singular or poorly conditioned matrices, was examined.
In the multivariate analysis of variance (MANOVA), the criterion of Wilks (Λ), quoted by Johnson & Wichern (1998), was adopted to evaluate the difference among the vectors of means of goat genetic groups; i.e., when there are significant differences among populations, it is expected to always have Λ<1, and the lower the estimate value, the more significant it is (Ferreira & Souza, 1997).
Clustering analysis was conducted by adopting the standardized Euclidean distance (D) as a dissimilarity measure. Three clustering methods were used, two of them hierarchical (Nearest neighbor and UPGMA – Unweighted Pair Group Method with Arithmetic Mean), and the Tocher optimization method. To circumvent both the problem of scale and the influence of the number of characters when using the mean Euclidean distance, it is recommended to standardize the data. This standardization was carried out according to Cruz & Carneiro (2006), by Xi = xi/S(xi), where S(xi) is the standard deviations of the characteristics. Thus, dii` = (1/v Σ (Xi – Xi`)2)0.5 is the standardized Euclidean
distance (D) for the populations i and i’, where v is the number of characteristics analyzed.
In the hierarchical method of nearest neighbor, the populations were clustered by means of smaller distances D through a process that is repeated at several levels until the dendrogram or tree diagram is established. In this case, there was some concern about the optimal number of groups, since the interest is in the “tree” and in the ramifications that are obtained (Cruz & Carneiro, 2006).
In the “average linkage” method or UPGMA (Unweighted Pair Group Method with Arithmetic Mean), the arithmetic average of D values was used to avoid characterizing the dissimilarity by extreme values (maximum or minimum) between the populations concerned.
The cophenetic correlation coefficient (CCC), proposed by Sokal & Rohlf (1962), was used in the hierarchical methods (nearest neighbor and UPGMA). The higher the value obtained for CCC, the lower the distortion caused by the population clustering. According to Rohlf (1970), in
Source: Lauvergne et al. (2000).
practice, the dendrograms with CCC lower than 0.7 indicate an inadequacy of the clustering method to summarize the information from the data set.
In the Tocher optimization method, quoted by Rao (1952), the criterion is that the average measure of dissimilarity within each group must be lower than the average distances between any groups. This method differs from the hierarchical methods by mutually forming exclusive groups.
The relative importance of the physical measurements and indexes for the divergence were evaluated according to the methodology of Singh (1981). To give a trustworthy interval to the dendrograms constructed through hierarchical methods, bootstrap analysis (1000 repetitions) was performed by providing the percentage of similar replication to the original data.
Analyses were performed by SAS for WindowsNT, (Statistical Analysis System, version 8.0), licensed by Universidade Federal de Viçosa, andGENES (version 6.0).
Results and Discussion
The results of ANOVA for the measurements and biometric indices assessed in 12 goat populations revealed the existence of significant differences through F tests
(P<0.05) among populations for all measures and indices evaluated (Table 1). The coefficient of variation (CV) of the characteristics and indexes indicated adequate precision of the estimations. The biometric measurements presented CV values lower than 13%. The variables that had the highest coefficients of variation were EL (12.8%) and indexes containing EL: EL/TD and EL/WH (18.2 and 13.0%, respectively). This higher variability of EL in the sample can be explained by the groups that exhibited very small ears, the Nambi breed, and the groups that presented medium and long ears. The percentage of CV for the variables was similar to those found by Dossa et al. (2007) in the study of goat populations in Western Africa (6.3% for WH; 10.5% for EL; and 11.1% for TD).
The occurrence of significant differences between goat populations (Table 1) was expected since the sample included populations that present some highly contrasting phenotypic characteristics. This situation is a favorable indication of substantial genetic divergence (Cruz & Carneiro, 2006).
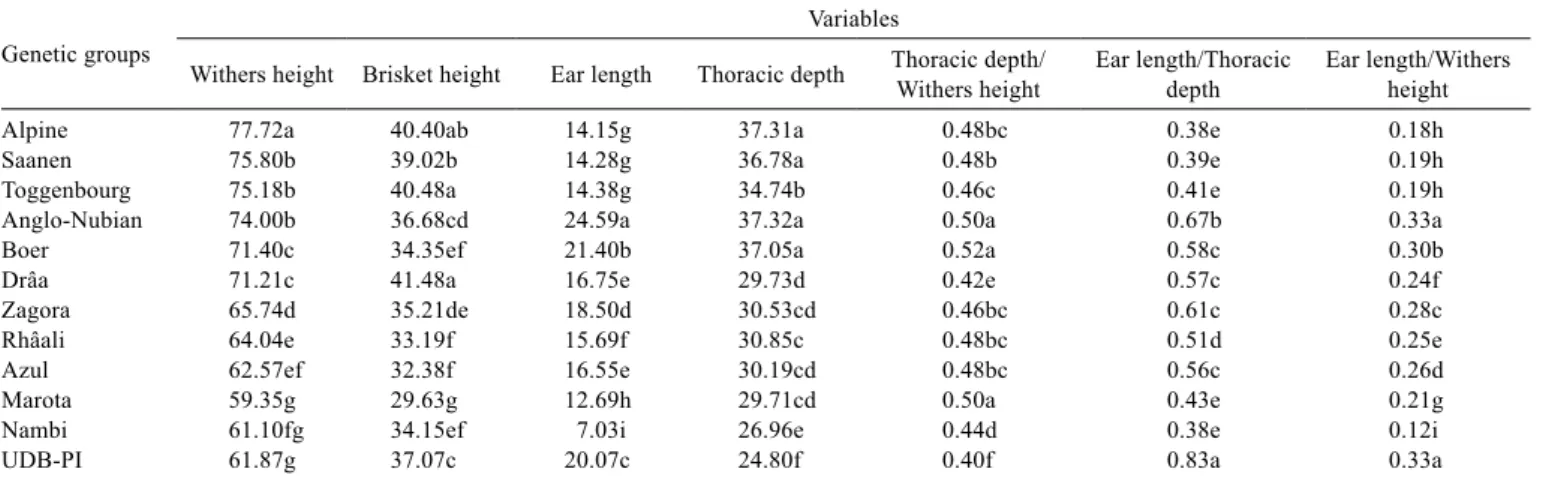
As the ANOVA was significant (P<0.05) for all physical measurements (Table 1), the SNK test was applied. Five to nine groups of averages were formed (Table 2). According to the mean biometric data of the different goat populations, compared by the SNK test (Table 2), the Saanen and Alpine
Table 1 - Variance analysis (ANOVA) for biometric data of goat populations in Brazil and Morocco
Characters Mean squares Mean (cm) Standard deviation (cm) Coefficient of variation (%)
Genetic group Error
Withers height 2671.1400* 19.6268 68.00 7.50 6.51
Brisket height 841.6252* 11.1470 36.61 4.76 9.12
Ear length 806.5983* 4.3290 16.29 3.93 12.77
Thoracic depth 1269.0500* 10.3510 31.39 5.27 10.25
Thoracic depth/Withers height 0.0946* 0.0014 0.46 0.05 8.15
Ear length/Thoracic depth 1.6692* 0.0095 0.54 0.18 18.16
Ear length/Withers height 0.2224* 0.0010 0.24 0.06 12.98
* Significant at 5% probability by the F test.
Table 2 - Average biometric data from different goat populations compared by the SNK test at 5% probability
Genetic groups
Variables
Withers height Brisket height Ear length Thoracic depth Thoracic depth/Withers height Ear length/Thoracic depth Ear length/Withers height
Alpine 77.72a 40.40ab 14.15g 37.31a 0.48bc 0.38e 0.18h
Saanen 75.80b 39.02b 14.28g 36.78a 0.48b 0.39e 0.19h
Toggenbourg 75.18b 40.48a 14.38g 34.74b 0.46c 0.41e 0.19h
Anglo-Nubian 74.00b 36.68cd 24.59a 37.32a 0.50a 0.67b 0.33a
Boer 71.40c 34.35ef 21.40b 37.05a 0.52a 0.58c 0.30b
Drâa 71.21c 41.48a 16.75e 29.73d 0.42e 0.57c 0.24f
Zagora 65.74d 35.21de 18.50d 30.53cd 0.46bc 0.61c 0.28c
Rhâali 64.04e 33.19f 15.69f 30.85c 0.48bc 0.51d 0.25e
Azul 62.57ef 32.38f 16.55e 30.19cd 0.48bc 0.56c 0.26d
Marota 59.35g 29.63g 12.69h 29.71cd 0.50a 0.43e 0.21g
Nambi 61.10fg 34.15ef 7.03i 26.96e 0.44d 0.38e 0.12i
UDB-PI 61.87g 37.07c 20.07c 24.80f 0.40f 0.83a 0.33a
dairy breeds only diverged in WH, in which the Alpine was the highest of all the populations. Toggenbourg goats were similar to Saanen and Alpine for EL and differed from both in TD, in which they were inferior to both but superior to all the other groups. The average WH for the Anglo-Nubian was similar to that found by Mello & Schmidt (2008), in a study of purebred goats (PB) of this same breed in Rio Grande do Sul State, Brazil (75.4 cm). The Anglo-Nubian differed from the European dairy breeds with respect to BH, EL and EL/TD, in which they were the highest of all the populations. Boer and Drâa were similar only in WH and EL/TD. Boer and Anglo-Nubian were only similar for TD and TD/WH. Moroccan Drâa, Zagora and Rhâali differed completely among themselves with respect to WH, and BH, EL and EL/WH. Among the Northeast Brazilian goats, UDB-PI showed long-legged with a lower, statistically different TD (24.8 cm) when compared with others breeds and to also have longer ears. The Nambi showed 7.3 cm of EL, which was shorter than all of the other populations sampled. This ear length is very similar to those found in French goats with small ears, of 6.4 and 6.7 cm, reported, respectively, by Audiot et al. (1985) and Martrès & Benadjaoud (1986) and bigger than the 2 cm reported by Paredes (1952) in Spanish goats. The American LaMancha (breed with short ear length) is divided in two types according to the ear length: the first with 2.5 cm and the other with 5.1 cm, according to ADGA (2008). The EL of the Marota does not differ from that described for the Moxotó breed and it is very close to that described for the Canindé breed (Machado, 1995; Rocha et al., 2007). The UDB-PI had the lowest TD among the populations studied and an EL similar to that of the UDB from Ceará (Machado, 1995).
Comparing the Brazilian northeastern populations under study, the Azul goat had the highest WH (62.6 cm) and the deepest chest (TD = 30.2 cm). The Marota had the lowest BH (29.6 cm), the lowest WH (59.3 cm), and the second lowest EL (12.7 cm); the first lowest was the Nambi. The
differences between an old naturalized Brazilian type such as the Marota (a breed type currently involved in preservation effort) and the current UDB from Piauí State (a mixed population including multiple crossbred types) showed that they diverged from each other for all the variables studied. Except for TD/WH, these data suggest a possible influence from long-legged, long-eared animals and with low chest depth in these UDB animals. Such characteristics are noticed in the Indian breeds Jamnapari and Bhuj, which have been used in crossbreeding programs in northeastern Brazil (Machado, 2001). Also, there have been reports of other breeds of taller stature such as Mambrina and Anglo-Nubianhave in the Brazilian northeast since the 1940s (Pinheiro Júnior, 1985).
Through MANOVA, significant differences (P<0.05) were also observed among population mean vectors. Thus, the rejection of the hypothesis that the population mean vectors are equal justifies the use of other multivariate techniques aimed at size reduction or the discarding of variables.
An evaluation of multicollinearity, performed using the Montgomery & Peck (1981) procedure, indicated that the condition number of the correlation matrix between the measured traits (WH, BH, EL and TD) and the indexes (TD/WH, EL/TD and EL/WH) was considered excessively high (NC≥1000). The variables that caused the greatest problems regarding multicollinearity were the TD and the indexes (TD/WH, EL/TD and EL/WH), because they are calculated by the combination of other variables and, therefore, naturally have high correlations with other variables. Thus, the measures considered in the cluster analysis were WH, BH and EL because they presented low multicollinearity (CN<100) values in this sample. A similar result was found in Spanish herds of local goats (Herrera et al., 1996), in which the chest depth was not discriminating and, therefore, should not be taken into consideration when evaluating breed differences.
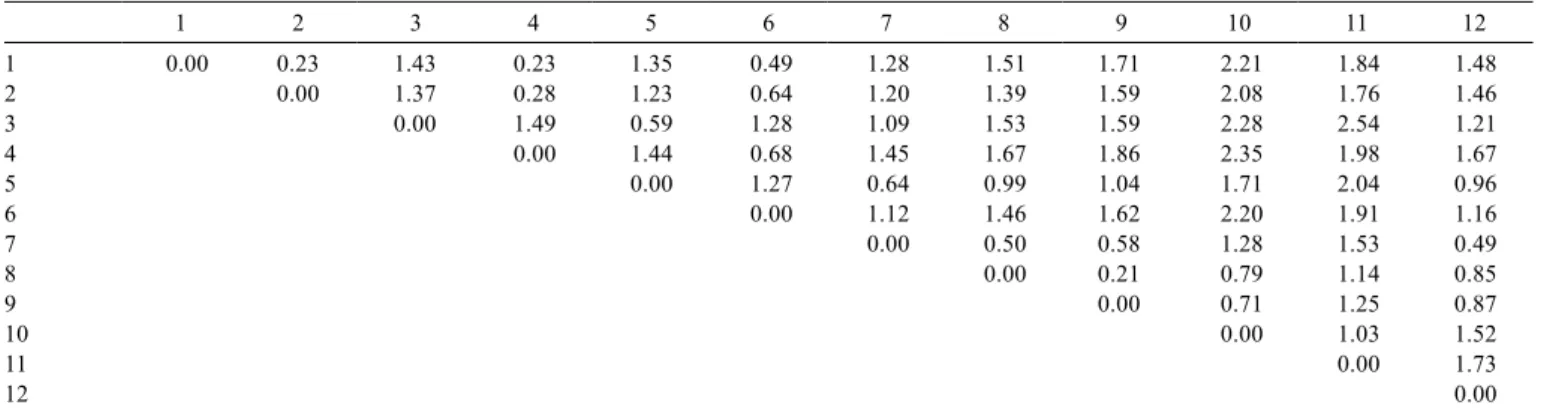
Table 3 - Euclidean distance matrix among goat populations assessed in Brazil and Morocco
1 2 3 4 5 6 7 8 9 10 11 12
1 0.00 0.23 1.43 0.23 1.35 0.49 1.28 1.51 1.71 2.21 1.84 1.48
2 0.00 1.37 0.28 1.23 0.64 1.20 1.39 1.59 2.08 1.76 1.46
3 0.00 1.49 0.59 1.28 1.09 1.53 1.59 2.28 2.54 1.21
4 0.00 1.44 0.68 1.45 1.67 1.86 2.35 1.98 1.67
5 0.00 1.27 0.64 0.99 1.04 1.71 2.04 0.96
6 0.00 1.12 1.46 1.62 2.20 1.91 1.16
7 0.00 0.50 0.58 1.28 1.53 0.49
8 0.00 0.21 0.79 1.14 0.85
9 0.00 0.71 1.25 0.87
10 0.00 1.03 1.52
11 0.00 1.73
12 0.00
Through observation of the Euclidean distance matrix D (Table 3), it is possible to see that the maximum value was between Anglo-Nubian and Nambi populations (2.54), making them the most divergent breeds. Furthermore, the lowest value was between Rhâali and Azul (0.21), the most similar populations for the characteristics considered. It is important to remember that for any dissimilarity measure the value will only be comparable within the same study; the comparison of similarity with individual or sample which is not involved in its determination would not be valid (Silveira Neto, 1986). The numeric values of D in this study could not, therefore, be numerically compared to others mentioned in the literature.
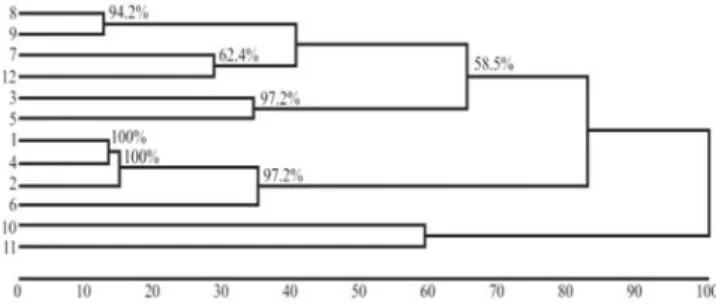
Through the Euclidean distances among populations and the clustering method of nearest neighbor, a dendrogram was generated by the D values (Figure 2). The relative proportions of distances (D) were expressed in the line below the dendrogram. Only bootstrap values above 50% were utilized, because they are trustworthy for the node formation of the dendrogram presented. This dendrogram showed the formation of groups using the dissimilarity measure D, which represents the genetic similarity/dissimilarity of populations. One of those groups formed included the European dairy breed (Saanen, Alpine and Toggenbourg) along with the Moroccan Drâa population with a bootstrap over 95%; the second group formed included the Rhâali and Azul populations with bootstrap over 95%; the third group formed included the second group and the Moroccan populations (Rhâali and Zagora) with populations from Brazilian Piauí State (Azul and UDB-PI) with a 67% bootstrap; and the forth group formed included Anglo-Nubian and Boer breeds with a bootstrap over 70%.
The similarities among dairy goat breeds fromEurope using biometric markers corroborates the clustering between
Saanen and Alpine, and the clustering of these two with Toggenbourg (Figure 2) observed both by electrophoresis of serum proteins and erythrocytes and by using microsatellite markers (Igarashi et al., 2000; Oliveira et al., 2007).
To assess the degree of adjustment between the dissimilarity matrix and the matrix resulting from the clustering for the formation of the dendrogram, the cophenetic correlation coefficient (CCC) was estimated. In the present study, the CCC was 0.73 for the method of nearest neighbor through D. From this coefficient, it can be concluded that the standardized mean Euclidean distance was adequate to summarize the information from the data set, the second criterion mentioned by Rohlf (1970).
The UPGMA clustering method (Figure 3) showed better CCC (0.82) than the method of nearest neighbor. Therefore, UPGMA may provide a more reliable graphical representation of the clustering. The dendrogram formed similar clusters to those obtained through the nearest neighbor method (Figure 2). Most of the bootstraps obtained in the formation of clusters from both the nearest neighbor method and the UPGMA were above 50%, which demonstrates a reliability of the inferences.
According to the groups formed in this study, there is evidence of a high similarity between European dairy population and those Moroccan Drâa populations. In studies of genetic diversity using microsatellite markers, Araújo et al. (2006) also obtained high similarity between pure and upgraded flocks of Saanen and Alpine. The formation of a stemthat included Toggenbourg, Alpine and Saanen in both dendrograms (Figures 2 and 3) is consistent with the literature (Igarashi et al., 2000; Oliveira et al., 2007) and reflects a common origin among them (Igarashi et al., 2000).
The Anglo-Nubian population was isolated from European dairy breeds. This finding is justified in part because the Anglo-Nubian origin is not completely
1 - Toggenbourg; 2 - Saanen; 3 - Anglo-Nubian; 4 - Alpine; 5 - Boer; 6 - Drâa; 7 - Zagora; 8 - Rhâali; 9 - Azul; 10 - Marota; 11 - Nambi; 12 - UDB-PI.
Figure 2 - Dendrogram obtained from the standardized mean Euclidean distance and the clustering method of nearest neighbor based on biometric data from 12 goat populations.
1 - Toggenbourg; 2 - Saanen; 3 - Anglo-Nubian; 4 - Alpine; 5 - Boer; 6 - Drâa; 7 - Zagora; 8 - Rhâali; 9 - Azul; 10 - Marota; 11 - Nambi; 12 - UDB-PI.
European, but also includes Middle Eastern and, probably, Indian ancestry (Jeffery, 1977; Mason, 1988). Additional studies with this breed would be useful as the sample of Anglo-Nubian goats in this study contained crossbred animals and only a small number of individuals were sampled. The Anglo-Nubian and Boer breeds were clustered with a bootstrap of 97%. The Boer breed was created in South Africa by crossing local goats with origins from eastern countries, including India (Eramus, 2000; Malan, 2000).
The clustering of the Moroccan populations Zagora and Rhâali in the dendrograms (Figures 2 and 3) indicates that the geographical proximity of these two was more important than the alleged kinship between Zagora and Drâa. The allele frequencies of visible characters also allowed Machado et al. (2000) to cluster Zagora and Rhâali, which were nearest from each other among the Moroccan goats, while the Drâa goats clustered with Mediterranean goats. Comparing French and Moroccan goats using microsatellite markers INRA and α-casein polymorphism, Oauli et al. (2002) observed that the sample of Drâa-Zagora clustered with Rhâali, and not with French goats. These authors also observed that goats from the Pyrenees formed a separate stem from Saanen, Alpine and Poitevine.
The Azul and UDB-PI were first clustered with Zagora and Rhâali populations and later with Anglo-Nubian and Boer. The Nambi and Marota are isolated cases, and Azul and UDB-PI are the most similar to each other (Figure 3). These results may be related to genetic isolation of the Marota population by controlled mating, which possibly caused genetic drift to occur. As previously mentioned, the ecotype Nambi has a unique ear size as compared with the other populations considered.
Although the results of dendrograms are easily interpreted, it was not possible to identify the optimal number of clusters. Therefore, the Tocher optimization method was used. A cluster analysis using the Tocher optimization method enables the formation of four distinct clusters using D (Table 4). It is known that the use of methods based on different dissimilarity measures may lead to different patterns of clustering (Cruz & Carneiro, 2006). Indeed, it was found that the Tocher method and hierarchical method were discordant in the partition of the groups, which corroborates the results found by other authors (Sakaguti et al., 1996; Barbosa et al., 2005).
The average distance within the group (intragroup) was calculated using the average distances between each pair of populations that compose it. Therefore, it is not possible for groups consisting of a single population to occur (group IV). The average distances between groups were obtained by averaging the distances between pairs of populations
belonging to different groups (Table 5). It is observed that the intragroup average distance is always lower than intergroup average distance. Higher variability between individuals within populations than among populations was also found by Spritze et al. (2003) and by Serrano et al. (2004) in Brazilian cattle; by Paiva et al. (2005) in sheep; and by Albuquerque et al. (2006) in buffaloes.
The intragroup distance D (Table 5) ranged from 0.43 (group II) to 1.02 (group III). The presence of Nambi ecotype in group III explains its greater intragroup heterogeneity. Group II was similar to that found through hierarchic methods (Figures 2 and 3). The intergroup distance ranged from 1.20 (group I and IV) to 2.41 (group III and IV). This greater distance between groups III and IV is due to the presence of Nambi ecotype in group III and Anglo-Nubian in group IV. The Anglo-Nubian and Nambi populations were again the most divergent (D = 2.54; Table 3).
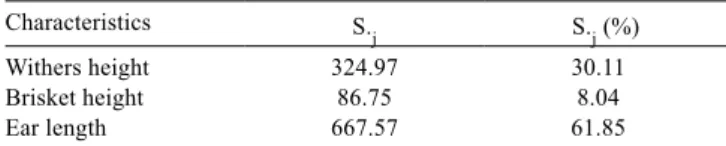
All biometric characters measured (WH, BH and EL) contributed to the determination of genetic divergence among populations, to a greater or lesser extent. Using the methodology of Singh (1981) (Table 6), ear length measurement had the highest relative contribution to divergence (61.9%), followed by WH and then BH. Ear length was the most discriminating because this variation did not only occur among individuals for all populations, but because the variation occurred especially among populations for this particular variable. The combined
Table 4 - Formation of goat population clusters through Tocher optimization method using Standardized mean Euclidean distance
Group Populations
I Rhâali, Azul, Zagora, UDB-PI and Boer
II Toggenbourg, Alpine, Saanen and Drâa
III Marota and Nambi
IV Anglo-Nubian
Table 5 - Standardized mean Euclidean distance within and between goat population through biometric data
Groups I II III IV
I 0.71 1.45 1.37 1.20
II 0.43 2.04 1.39
III 1.02 2.41
I - Rhâali, Azul, Zagora, UDB-PI, Boer; II - Toggenbourg, Alpine, Saanen, Drâa; III - Nambi and Marota; IV - Anglo-Nubian.
Table 6 - Relative importance of the characteristics (S.j) for study of the genetic divergence in twelve goat populations
Characteristics S.j S.j (%)
Withers height 324.97 30.11
Brisket height 86.75 8.04
effect of the traits EL and WH contributed to 92% of the assessment of diversity among populations. Similar results were found in herds of Spanish goats (Herrera et al., 1996) and in West African goats (Dossa et al., 2007) in which one of the most discriminating variables in this study was WH.
The use of a different set of population groups or the use of other indicator traits/markers may result in different results regarding divergence; thus, it is necessary to investigate which traits are of importance in each situation.
Conclusions
For the set of biometric measures assessed, both the nearest neighbor and UPGMA (Unweighted Pair Group Method with Arithmetic Means) hierarchic clustering methods are satisfactory. The clusters formed through these methods are largely confirmed by the Tocher optimization method.
Acknowledgments
The authors are grateful to INRA Centre de Jouy-en-Josas for its support for data collection in Morocco and to EMBRAPA-CPAMN, which supported the data collection in the state of Piauí, Brazil.
References
AMERICAN DAIRY GOAT ASSOCIATION - ADGA. Breed standards for the six currently registered ADGA breeds. 2008. Available at: <http://www.adga.org>. Accessed on: Jul. 28, 2008. ALBUQUERQUE, M.S.M.; EGITO, A.A.; MARQUES, J.R.F. et al.
Variabilidade genética de búfalos estimada pela técnica de RAPD. Pesquisa Agropecuária Brasileira,v.41, n.4, p.623-628, 2006. ALMEIDA, A.M.; SCHWALBACH, L. Breves considerações sobre a
raça caprina Boer. Revista do Sindicato Nacional de Medicina Veterinária,v.2, p.10-15, 2000.
ARAÚJO, A.M.; GUIMARÃES, S.E.F.; MACHADO, T.M.M. et al. Genetic diversity between herds of Alpine and Saanen dairy goats and the naturalized Brazilian Moxotó breed. Genetic and Molecular Biology, v.29, n.1, p.67-74, 2006.
AUDIOT, A. La variant ‘oreilles raccourcies’ de la chèvre provençale. Recueil de Médecine Vétérinaire, v.161, p.683-684, 1985. BARBOSA, L.; REGAZZI, A.J.; LOPES, P.S. et al. Evaluation of
genetic divergence among lines of laying hens using cluster analysis. Revista Brasileira de Ciência Avícola, v.7, n.2, p.79-83, 2005. BARROS, A.C. Caprinos nativos: Privilégio do Nordeste. Aracaju:
SUDAP, 1987. 194p.
BOUCHEL, D.; LAUVERGNE, J.J.; GUIBERT, E. et al. Étude morpho-biométrique de la chèvre du rove. Hauteur au garrot (HT), profondeur du thorax (PT), vide sous-sternal (VSS) et índice de gracilité sous-sternale (IGs) chez femelles. Revue de Médecine Vétérinaire, v.148, n.1, p.37-46, 1997.
BOURZAT, D.; SOUVENIR-ZAFINDRAJAONA, P.; LAUVERGNE, J.J. et al. Comparaison morpho-biométrique dês chèves au Nord Cameroun et au Tchad. Revue d’Élevage et de Médecine Vétérinaire des Pays Tropicaux, v.46, n.4, p.667-674, 1993.
CASEY, N.H.; VAN NIEKERK, W.A. The Boer goat. I. Origin, adaptability, performance testing, reproduction and milk production. Small Ruminant Research,v.1, n.3, p.291-302, 1988.
CRUZ, C.D.; CARNEIRO, P.C.S. Modelos biométricos aplicados ao melhoramento genético. 2. ed. rev., v.2. Viçosa, MG: UFV, 2006. 585p.
DOSSA, L.H.; WOLLNY, C.; GAULY, M. Spatial variation in goat populations from Benin as revealed by multivariate analysis of morphological traits. Small Ruminant Research, v.73, n.1, p.150-159, 2007.
EPSTEIN, H. The origin of the domestic animal in Africa. New York: Africana Publishing Corporation, 1953. v.2, 719p.
ERAMUS, J.A. Adaptation to various environments and resistance to disease of the improved Boer goat. Small Ruminant Research, v.36, n.2, p.179-187, 2000.
FERREIRA, R.L.C.; SOUZA, A.L. Técnicas de análise multivariada aplicadas ao manejo florestal. Viçosa, MG, 1997. 21p. (Boletim Técnico SIF, 14).
FRANCI, O.; PULGLIESE, C.; BOZZI, R. et al. The use of multivariate analysis for evaluating relationships among fat depots in heavy pigs of different genotypes. Meat Science, v.58, p.259-266, 2001.
FREITAS, H. O caprino no Nordeste. Bol. Minist. Agricult. Rio de Janeiro, 1941. 19p.
HERRERA, M.; RODERO, E.; GUTIERREZ, M.J. et al. Application of multifactorial discriminant analysis in the morphostructural differentiation of Andalusian caprine breeds. Small Ruminant Research, v.22, n.1, p.39-47, 1996.
HOSSAINI-HILARI, J.; MOUSLISH, Y. La chevre Drâa. Potentiel de production et caracteristiques d’adaptation aux contraintes de l’environnement aride. Animal Genetic Resources Information, v.32, p.49-56, 2002.
IGARASHI, M.L.S.P.; MACHADO, T.M.M.; FERRO, J.A. et al. Structure and genetic relationship among naturalized and imported goat breeds. Biochemical Genetics, v.38, p.353-365, 2000. JAMES, F.C.; MCCULLOCH, C.E. Multivariate analysis in ecology
and systematics: Panacea or pandora’s box? Annual Review of Ecology and Systematics, v.21, p.129-166, 1990.
JEFFERY, H.E. A history of the Anglo-Nubian breed. Dairy Goat Journal,p.40-49, 1977.
JOHNSON, R.A.; WICHERN, D.W. Applied multivariate statistical analysis. 4.ed. New Jersey: Prentice Hall, 1988. 642p.
MACHADO, T.M.M. Le peuplement des animaux de ferme et l’élevage de la chèvre au Brésil avec une étude du polymorphisme visible de la chèvre du Ceará. 1995. 383p. Tese (Doutorado em Genética Quantitativa e de Populações) - University of Paris XI, Paris.
MACHADO, T.M.M.; CHAKIR, M.; LAUVERGNE, J.J. Genetic distances and taxonomic trees between goats of Ceará state (Brazil) and goats of the Mediterranean region (Europe and Africa). Genetic and Molecular Biology, v.23, p.121-125, 2000.
MACHADO, T.M.M. Raças raras de pequenos ruminantes. Revista Ação Ambiental, v.3, n.15, p.19-23, 2001.
MALAN, S.W. The improved Boer goat. Small Ruminant Research, v.36, n.3, p.165-170, 2000.
MARTRES, J.P.; BENADJAOUD, A. Profils génétiques visibles de la chèvre de Haute Roya. In: LAUVERGNE, J.J. (Éd.) Populations traditionnelles et premières races standardisées d’Ovicaprinae dans le Bassin Méditerranéen. Paris: INRA, 1986. p.153-158. (Colloques de l’INRA, 47).
MASON, I.L. A world dictionary of livestock breeds, types and varietes. Wallingford: CABI, 1988. 348p.
MELLO, F.A.; SCHMIDT, V. Caracterização biométrica de caprinos Anglo-Nubianos nascidos no Brasil, no período de 1993 a 2001. Archivos de Zootecnia, v.57, n.220, p.525-535, 2008.
MONTGOMERY, D.C.; PECK, E.A. Introduction to linear regression analysis. New York: John Wiley & Sons, 1981. 504p. OLIVEIRA, J.D.; IGARASHI, M.L.S.P.; MACHADO, T.M.M.
naturalized and exotic purebred goat (Capra hircus) breeds based in microsatellites. Genetic and Molecular Biology, v.30, n.2, p.356-363, 2007.
OUALI, A.T.; BABILLIOT, J.M.; LEROUX, C. et al. Genetic diversity of the two main Moroccan goat breeds: phylogenetic relationships with four breeds reared in France. Small Ruminant Research, v.45, n.3, p.225-233, 2002.
PAIVA, S.R.; SILVÉRIO, V.C.; EGITO, A.A. et al. Genetic variability of the Brazilian hair sheep breeds. Pesquisa Agropecuária Brasileira, v.40, n.9, p.887-893, 2005.
PAREDES, R.J. Tipos de oreja y su herencia en la cabra. Archivos de Zootecnia, v.1, n.1, p.24-39, 1952.
PINHEIRO JÚNIOR, G.C. Caprinos no Brasil. Belo Horizonte: Itatiaia, 1985. 177p.
QUITTET, E. La cabra: Guia practica para el ganadero. Madrid: Mundi-Prensa, 1978. 321p.
RAO, C.R. Advanced statistical methods in biometric research. New York: John Wiley & Sons, 1952. 400p.
ROCHA, L.L.; BENÍCIO, R.C.; OLIVEIRA, J.C.V. et al. Avaliação morfoestrutural de caprinos da raça Moxotó. Archivos de Zootecnia, v.56, n.1, p.483-488, 2007.
ROHLF, F.J. Adaptative hierarquical clustering schemes. Systematic Zoology, v.19, n.1, p.58-82, 1970.
SAKAGUTI, E.S.; SILVA, M.A.; REGAZZI, A.J. et al. Análise de divergência genética entre nove grupos genéticos de coelhos. Revista da Sociedade Brasileira de Zootecnia, v.25, n.4, p.647-660, 1996.
SANTIAGO, A.A. A criação de caprinos. São Paulo: Sec. Agric. Indust. Comérc. Est. São Paulo, 1944. 121p.
SANTOS, R. Os caprinos do Nordeste. Recife: O Berro, 1987. 90p.
SERRANO, G.M.; EGITO, A.A.; MCMANUS, C. et al. Genetic diversity and population structure of Brazilian native bovine breeds. Pesquisa Agropecuária Brasileira, v.39, n.6, p.543-549, 2004.
SILVEIRA NETO, S. Análise fenética. In: ALVES, S.B. (Ed.) Controle microbiano de insetos. São Paulo: Manole, 1986. p.384-407. SINGH, D. The relative importance of characters affecting genetic
divergence. Indian Journal of Genetics, v.41, n.2, p.237-245, 1981.
SOKAL, R.A.; ROHLF, F.J. The comparison of dendrograms by objective methods. Taxonomy, v.11, n.2, p.33-40, 1962.