Biometric variability of goat populations revealed by means of principal
component analysis
Luanna Chácara Pires
1, Théa M. Medeiros Machado
2, Adriana Mello Araújo
3, Timothy A. Olson
4,
João Batista Lopes da Silva
5, Robledo Almeida Torres
2and Márcio da Silva Costa
61
Departamento de Agronomia, Universidade Federal de Piauí, Bom Jesus, PI, Brazil.
2Departamento de Zootecnia, Universidade Federal de Viçosa, Viçosa, MG, Brazil.
3
Empresa Brasileira de Pesquisa Agropecuária, Embrapa Meio Norte, Teresina, PI, Brazil.
4Department of Animal Science, University of Florida, Gainesville, FL, USA.
5
Departamento de Engenharia de Agricultura, Universidade Federal de Viçosa, Viçosa, MG, Brazil.
6
Departamento de Ciência Animal, Universidade Federal de Piauí, Teresina, PI, Brazil.
Abstract
The aim was to analyze variation in 12 Brazilian and Moroccan goat populations, and, through principal component analysis (PCA), check the importance of body measures and their indices as a means of distinguishing among indi-viduals and populations. The biometric measurements were wither height (WH), brisket height (BH) and ear length (EL). Thorax depth (WH-BH) and the three indices, TD/WH, EL/TD and EL/WH, were also calculated. Of the seven components extracted, the first three principal components were sufficient to explain 99.5% of the total variance of the data. Graphical dispersion by genetic groups revealed that European dairy breeds clustered together. The Mo-roccan breeds were separated into two groups, one comprising the Drâa and the other the Zagora and Rhâali breeds. Whereas, on the one side, the Anglo-Nubian and undefined breeds were the closest to one another the goats of the Azul were observed to have the highest variation of all the breeds. The Anglo-Nubian and Boer breeds were similar to each other. The Nambi-type goats remained distinct from all the other populations. In general, the use of graphical representation of PCA values allowed to distinguish genetic groups.
Keywords: biometrics, genetic resources, goat breeds, morphometrics, population characterization. Received: March 14, 2012; Accepted: May 29, 2012.
Introduction
Geographic isolation over time, along with small population size and the consequences of natural and artifi-cial selection in domesticated animals, have contributed to the appearance of a large variety of genetic types within species, sometimes called breeds. These same factors have also contributed to variation within the breeds themselves (Hall and Bradley, 1995; Brufordet al., 2003).
The standard procedure used in Brazil for defining a goat breed is first there cognition of a standard population phenotype by the Ministry of Agriculture, followed by its registration with the Goat Genealogical Registration Ser-vice (Brasil, 1977). This definition of breed, a group of ani-mals with standardized qualitative characteristics, was developed in England during the eighteenth century (Au-diot, 1985; Sierra Alfranca, 2001).
Farm animals of colonial Brazil originally came from Portugal and the Cape Verde islands, and later from Spain.
Sahelian goats from the Western Sahara and their crosses entered Brazil by way of the Cape Verde Islands, where they had been previously introduced by the Portuguese. The Portuguese had acquired Arabian, Persian (Iran) and Maghrebian (Morocco, Algeria and Tunisia) horses, before Brazil was discovered and later were thought to have intro-duced their descendants into Brazil. An ancient North Afri-can influence is also generally assumed regarding the ori-gin of asinine, equine and ovine animals of the Iberian Peninsula (Machado TMM, 1995, PhD thesis, University of Paris XI, Paris). Andrade (1982) stated that the introduc-tion of goats and other livestock species to Brazil coincided with the arrival of the first African slaves.
At the beginning of the nineteenth century, goat breeds selected for improving production began to arrive in Brazil. The European breeds, Alpine, Saanen and Toggenburg, were selected for increasing milk production and the Anglo-Nubian for both milk and meat. The An-glo-Nubian breed was formed in England by crossing Afri-can long-drooping-eared goats from the Nile and common English goats (Mason, 1988). The Boer breed, developed by South African farmers of the eastern Cape, came about
www.sbg.org.br
by crossing indigenous Hottentot and Bantu animals with imported Nubian and Indian goats (Skinner, 1972; Eras-mus, 2000; Malan, 2000).
Most Brazilian goats do not have a standardized phe-notype, and thus, are classified as of an undefined breed (UDB). Not with standing, some goats that were introduced into northwestern Brazil in the distant past have acquired peculiar phenotypic characteristics,e.g.the Marota goat is
a white-coated ecotype. The Azul ecotype designates roan-coated goats with a fawn pigment pattern, thereby as-suming a gray or “Azul” appearance (Machado TMM, 1995, PhD thesis, University of Paris XI, Paris). The Nambi goat’s distinguishing characteristic is its tiny ears.
Among the Moroccan goat populations, only the Drâa have well-defined phenotypic characteristics and produc-tion (milk and meat) informaproduc-tion (Hossaini-Hilari and Ben-lamlih, 1995; Hossaini-Hilari and Mouslish, 2002). On comparing French and Moroccan goats using INRA micro-satellite markers anda-casein polymorphism, it was noted
that the Drâa-Zagora sample clustered with the Rhâali, sep-arate from the French goats; among which, goats from the Pyrenees formed a separate stem from the Saanen, Alpine and Poitevine (Oualiet al., 2002).
The physical measurements were taken based in the knowledge that considerable variation exists among the various groups, from long-legged to midget goats and from goats with long, droopy ears to those with short, erect ears (Epstein, 1971; Mason, 1988).
Over the past two decades, improvements in pheno-type marker methodology have facilitated the simultaneous measurement of many characteristics (Lauvergne, 1988; Roderoet al., 1992; Jordanaet al., 1993; Herrera et al., 1996; Jordana and Parés, 1999; Bedottiet al., 2004; Dossa
et al., 2007; Rochaet al., 2007; Cháconet al., 2011), the es-tablishment of indices between two body measurements (Bourzatet al., 1993; Bouchelet al., 1997; Lauvergne et al., 2000), and the integration of genetics statistics and in-formatics solver the last two decades. Subsequently, phenotypic and molecular markers began to be analyzed jointly using multivariate analyses. Breeds have acquired a quantitative measure for uniformity among their individu-als (reduced intra-population variability) and become dif-ferent from individuals of other breeds (variability amongst populations). The biological importance of biometric mea-sures submitted to multivariate analyses is the observation of clustering of some individuals, and the distance between them and those of other populations. Those individuals clustered together (i.e. similar for phenotypic measures) could be recognized as an official breed.
Phenetic distances establish relations of similarity among populations with the purpose of classification, stud-ied on the genetic and evolutionary distances (Meyer, 1996).
Principal component analysis (PCA) consists of transforming a set of variables Z1, Z2, ... , Zpinto a new set
of uncorrelated variables Y1(CP1), Y2 (CP2), ... , Yp(CPP)
that are arranged in descending order of variance (Liberato
et al., 1999). Each principal component is a linear
combina-tion of all the original variables, independent of each other, and estimated, with the aim of retaining the maximum of information and total variation contained in the original data. The maini.e.of this procedure, however, is that a few
of the first principal components contain most of the vari-ability of the original data. PCA can also unveil relation-ships not previously identified, contributing for a better interpretation of the collected data (Bakeret al., 1988).
The aim of this study was to verify the ability of body measurements and their indices using PCA to discriminate among individuals and populations.
Material and Methods
Obtained data were of 796 Brazilian and Moroccan female goats, all over two-years-old. Additional data, col-lected between 1995 and 2008, included information on phenotype and ownership of each animal sampled.
Exotic breeds were sampled (34 Toggenburg, 86 Saa-nen, 28 Anglo-Nubian, 78 Alpine and 26 Boer) in Brazil (Minas Gerais State and in the Federal District). In addi-tion, in the State of Piauí, 29 heads of the Azul type, 32 of Marota type, 35 of Nambi type and 123 goats lacking de-fined breed characteristics (UDB) were measured. The ex-otic breed goats sampled in Brazil, the Alpine, Saanen, Toggenburg, Anglo-Nubian and Boer, are registered in their respective Brazilian herdbooks. The local Brazilian goats, Azul, Marota, Nambi and UDB lack herdbook infor-mation.
In Morocco, the sample comprised 102 local Drâa goats from the Center for Goat Research in the village of Sidi Flah, in Skoura. A further 34 Zagora, considered to be Drâa crossbreds were studied in Demnate and Ouarzazate in Tahnnaoutat the Center for Goat Research in the Mar-rakech area. Finally, 189 Rhâali goats from the Zagora re-gion were also included. There is no herdbook information for any goat breed in Morocco.
age through dental chronology according to the methodol-ogy described by Quittet (1978).
Due to the use of variables measured in different units (linear measures as well as ratios between them), standard-ization of the variables (Zij) was necessary. This
standard-ized measurement:Zij= (Xij-Xj)/Sj, whereXijis the value of
i-th observation of the variableXj;Xjis the mean of variable
Xj,andSjis the standard deviation of variableXj.
Before the collected physical measurements were subjected to analysis using multivariate methods, they were submitted to preliminary analyses to remove invalid data, particularly to discard information in compatible with stated age and to eliminate animals with missing informa-tion. Biometric data were first analyzed using simple de-scriptive statistics (mean, standard deviation and coefficient of variation). The coefficient of variation (CV) was calculated via the expression CV = (Sj/Xj)*100, where
Sjand were defined previously. Variables were then
sub-mitted to principal component analysis (PCA) to so reduce data dimensionality and enable discrimination of groups by individuals and populations.
The criterion for discarding variables from the PCA followed the recommendations of Jolliffe (1973), based on actual and simulated data from the correlation matrix. It was defined that the number of discarded variables should be the same as the components whose variance (eigen-value) is not greater than 0.7.
Multivariate analysis was with SAS version 8.0 soft-ware, under license to the Universidade Federal de Viçosa (SAS Institute Inc., Cary, NC, USA, 1999) and GENES version 6.0 software (Cruz, 2008).
Results and Discussion
The coefficients of variation of characteristics and in-dices showed these to be precisely estimated. The body morphometric measurements (WH, BH, EL and TD) pre-sented coefficients of variation no greater than 12.8% (Ta-ble 1). The highest variability was in EL. In one group of goats, the Nambi-type, ears were substantially shorter,
whereas other groups characteristic ally had average-sized to long ears. The coefficient of variation values of WH, EL and TD were similar to those found by Dossaet al.(2007).
Based on the PCA results, the respective eigenvalues, and the percentages of explained variance (Table 2) from the seven principal components, four of the components (57.14%) yielded variances no greater than 0.7 (eigen-values no greater than 0.7). The first three principal compo-nents were selected and explained 99.5% of the total variation.
As presented in Table 3, the four variables that pre-sented the highest coefficients, in absolute value, from the last principal component can be discarded. Hence, the most appropriate characteristics to discard, in order of the least important for explaining total variation were TD, EL/WH TD/WH and EL/TD. Based on our results, wither height, brisket height and ear length are recommended for use in future studies. The indices and TD accounted for only 0.5% of the total variability. In this study, they were of little im-portance in the evaluation of interbreed differences. Nota-bly, those characteristics recommended for exclusion were highly correlated with the selected variables. Based on the results, it is not recommended that thoracic depth be
calcu-Table 1- Means, standard deviation and coefficient of variation of body measures and indices in Brazilian and Moroccan goats.
Characters Mean Standard
deviation
Coefficient of variation (%)
WH 68.0 cm 7.5 cm 6.5
BH 36.6 cm 4.8 cm 9.1
EL 16.3 cm 3.9 cm 12.8
TD 31.4 cm 5.3 cm 10.3
TD/WH 0.5 0.1 8.2
EL/TD 0.5 0.2 18.2
EL/WH 0.2 0.1 13.0
WH - wither height, pH - brisket height, EL - ear length, PT - thoracic depth.
Table 2- Principal Components (PC), eigenvalues (li) and variance per-centage explained by components (simple variance and accumulated vari-ance) of measured characteristics in Brazilian and Moroccan goats.
Number li Simple variance (%) Accumulated variance (%)
PC1 3.479 49.69 49.69
PC2 1.971 28.15 77.84
PC3 1.517 21.67 99.51
PC4 0.025 0.36 99.87
PC5 0.005 0.07 99.94
PC6 0.003 0.05 99.99
PC7 0.001 0.01 100.00
Table 3- Coefficients of weight of the variables with the four less
impor-tant principal components to explain total variation.
Coefficients
Variable PC4 PC5 PC6 PC7
WH 0.1410 0.0299 -0.0929 -0.6264
PH -0.1504 0.4627 0.1377 0.4606
EL -0.5216 -0.3762 0.3704 0.0012
TD 0.3366 -0.3752 -0.2566 0.7101
TD/WH -0.0159 0.5930 0.3966 -0.0010
EL/TD 0.7538 0.0371 0.3693 0.0018
EL/WH -0.0598 0.3868 -0.6897 -0.0017
WH - wither height, BH - brisket height, EL - ear length, TD - thoracic depth.
lated in future studies, but, instead, be substituted by brisket height. A population data set with additional animals and populations, and possibly much more diverse than that ap-plied here, might have given rise to a different set of charac-teristics.
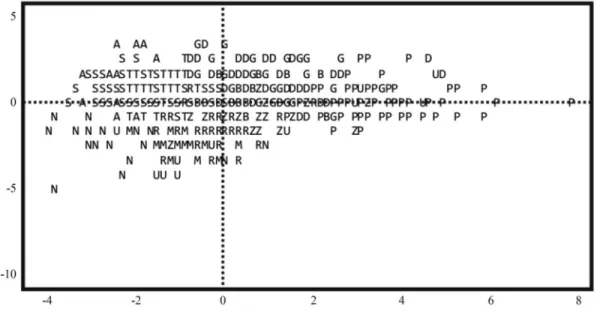
As can be seen in the graphical representation of the individual distribution according to principal components 1 and 2 (Figure 1), individuals from the European dairy breeds, Alpine, Saanen and Toggenburg, predominantly occupied the upper left quadrant. The relationships be-tween these three breeds were corroborated by the grouping of the Saanen and Alpine, and the further grouping of the latter with the Toggenburg, as observed by electrophoresis of serum and erythrocyte proteins, and by microsatellite markers (Igarashiet al., 2000; Oliveiraet al., 2007). The
fact that our principal components data, based on physical measurements of these purebred animals of known pedi-gree origin, grouped these breeds together in the same way as did the protein and microsatellite markers, corroborates the use of biometric data and PCA for discerning differ-ences among groups of individuals within a variety of pop-ulations.
The Moroccan goats were separated into two groups (Figure 1). Observations from the Drâa breed were located in the upper quadrants, mainly to the right, whereas those of the Zagora and Rhâali were located in the center of the lower quadrants. Some Drâa individuals were situated among the European dairy breeds. These results are par-tially in accordance with Machadoet al.(2000), who, by
comparing allelic frequencies of morphological characters, found that, where as the Zagora and Rhâali breeds were the closest grouped among the Moroccan types, the Drâa grouped together with Mediterranean-European goats. On
the other hand, Ouali et al. (2002) report that in their
phylogenic tree the Drâa-Zagora and Rhâali goats were very much separated from the Alpine and Saanen goats .Considering the data obtained from this experiment and those obtained by Machado et al. (2000), arbitrary
pre-grouping of Drâa and Zagora samples can be considered in-advisable.
Data from the Boer breed occupied the central area of the upper quadrants, especially that on the right, together with the Zagora, Drâa and Anglo-Nubian groups. The Afri-can component of the Boer and Anglo-Nubian breeds could possibly clarify this result. Thus, in this study, relationships among populations through PCA relate well with their re-spective breed descriptions and the geographical origins of these populations.
Although as a whole, the Anglo-Nubian and unde-fined breed goats from Piauí were predominantly in the up-per right quadrant, some Anglo-Nubian individuals were placed among the European dairy breeds. On the other hand, although some undefined individuals from Piauí were grouped in the right lower quadrant together with the Zagora and Rhâali, they occupied more extreme positions than was the case with other populations. In contrast, Nam-bi-type goats occupied positions in the far-left portion of the lower left quadrant.
The Brazilian goat types, Marota and Azul, were also positioned in the lower left quadrant, in an intermediate po-sition between the Nambi and Moroccan populations. However, in the case of the Azul goats, some individuals overlapped into the right-hand quadrant, thus denoting greater variability than the rest. In this case, the distribution of individuals through principal components 1 and 2, which
retain greater variance, was useful for providing a visual-ization of intra-population and inter-population variability.
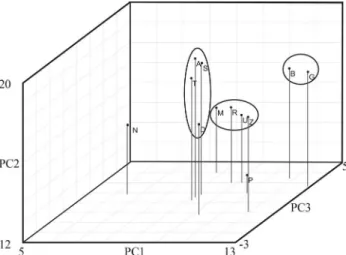
By relating principal components to known breed variability (Figures 2 and 3), the Brazilian Nambi-type ap-pears to be removed from all the other groups, due to its short ears. The undefined breed goats from Piauí were also isolated from the other groups and placed in apposition op-posite to the Nambi type goats. The closest groups to the undefined breed goats from Piauí were the Moroccan and the Brazilian Azul and Marota goats. The only difference between the groupings in Figures 2 and 3 is the positioning of the Drâa breed, which was included with the other Mo-roccan breeds and some Brazilian goats in the first analysis and then with the European breeds in the second analysis. This difference is easily explained by the variability among
Drâa individuals, as shown in Figure 1. In Figure 3, the group constituted by the Moroccan Rhâali plus Zagora and the Brazilian Azul and Marota goats occupied an interme-diate position between the European dairy breeds together with the Drâa, and the Anglo-Nubian together with the Boer. These results are in accordance with the literature (Igarashi et al., 2000; Ouali et al., 2000; Oliveira et al.,
2007), and occasionally also with the origins of the respec-tive populations.
The graphical representation of PCA observations permits distinguishing among genetic groupings/breeds of goats, from the most similar to the most dissimilar. It also facilitates preliminary visualization of the uniformity or lack of uniformity among individuals within each popula-tion. Based on results from the Brazilian and Moroccan goat populations, the biometric indices, wither height, bris-ket height and ear length are recommended to be continued to be collected in future evaluations of breed and popula-tion diversity. In contrast, including thoracic depth is not recommended in further studies of this kind. Due to its greater variability, the Azul goat, an unselected type, dem-onstrated the least standardization of all the breeds. Among the Brazilian populations, the Nambi-type goats demon-strated the highest degree of uniformity, whence the trend to becoming a designated breed.
Acknowledgments
The authors would like to thank Mohamed Chakir for his contribution to data collection in Morocco during his post doctorate at INRA, Jouy-in-Josas, France.
References
Andrade MC (1982) Área de Domínio da Pecuária Extensiva e Semi-Intensiva na Bahia e Norte de Minas. SUDENE, Recife, 468 pp.
Audiot A (1985) La variant `oreilles raccourcies’ de la chèvre provençale. Recl Méd Vét 161:683-684.
Baker JF, Stewart TS, Long CR and Cartwright TC (1988) Multi-ple regression and principal components analysis of puberty and growth in cattle. J Anim Sci 66:2147-2158.
Bedotti D, Gómez Castro AG, Sánchez Rodriguez M and Martos Peinado J (2004) Morphologic and phaneroptic character-ization of the pampean Red Goat. Arch Zootec 53:261-271. Brasil (1977) Leis, Decretos, etc. Portaria n° 11 de 1° Dezembro
de 1977. Padrões Raciais dos Caprinos. Diário Oficial, Bra-sília, pp 17187-17189.
Bouchel D, Lauvergne JJ, Guibert E and Minvielle F (1997) Étude morpho-biométrique de la chèvre du rove. Hauteur au garrot (HT), profondeur du thorax (PT), vide sous-sternal (VSS) et índice de gracilité sous-sternale (IGs) chez femelles. Rev Méd Vét 148:37-46.
Bourzat D, Souvenir-Zafindrajaona P, Lauvergne JJ and Zeuh V (1993) Comparaison morpho-biométrique dês chèves au Nord Cameroun et au Tchad. Rev d’Élevage et de Méd Vét des Pays Trop 46:667-674.
Figure 2- Distribution of the 12 genetic groups of goats in Brazil and
Mo-rocco, in relation to the principal components 1 and 2.Genetic groups: T = Toggenburg, S = Saanen, G = Anglo-Nubian, A = Alpine, B = Boer, D = Drâa, Z = Zagora, R = Rhâali, U = Azul, M = Marota, N = Nambi, P = Undefined goat breeds from Piauí.
Figure 3- Distribution of the 12 genetic groups of goats in Brazil and
Bruford MW, Bradeley DG and Luikart G (2003) DNA markers reveal the complexity of livestock domestication. Nat Rev Genet 4:900-910.
Chácon E, Macedo F, Velãzquez F, Paiva SR, Pineda E and McManus C (2011) Morphological measurements and body índices for Cuban Creole goats and their crossbreds. Rev Bras Zootec 40:1671-1679.
Cruz CD (2008) Programa Genes: Aplicativo Computacional em Genética ver. 6.0. Viçosa, Minas Gerais, 386 pp.
Dossa LH, Wollny C and Gauly M (2007) Spatial variation in goat populations from Benin as revealed by multivariate analysis of morphological traits. Small Rumin Res 73:150-159. Epstein H (1971) The Origin of the Domestic Animals of Africa.
2nd edition. Africana Publishing Corporation, New York, 719 pp.
Erasmus JA (2000) Adaptation to various environments and resis-tance to disease of the improved Boer goat. Small Rumin Res 36:179-187.
Hall SJG and Bradley DG (1995) Conserving livestock breed di-versity. Trends Ecol Evo l10:267-270.
Herrera M, Rodero E, Gutierrez MJ, Pefia F and Rodero JM (1996) Application of multifactorial discriminant analysis in the morphostructural differentiation of Andalusian caprine breeds. Small Rumin Res 22:39-47.
Hossaini-Hilari J and Benlamlih S (1995) La chèvre Maro-caine.Capacités d’adaptation aux conditions arides. Animal GenetResour Inf 15:51-56.
Hossaini-Hilari J and Mouslish Y (2002) La chevre Drâa. Po-tentiel de production et caracteristiques d’adaptation aux contraintes de l’environnement aride. Animal Genet Resour Inf 32:49-56.
Igarashi MLSP, Machado TMM, Ferro JA and Contel EPB (2000) Structure and genetic relationship among naturalized and imported goat breeds. Biochem Genet 38:353-365. Jolliffe IT (1973) Discarding variables in a principal component
analysis. II. Real data. Appl Statist 22:21-31.
Jordana J, Ribo O and Pelegrin M (1993) Analysis of genetic rela-tionships from morphological characters in Spanish goat breeds. Small Rumin Res 12:301-314.
Jordana J and Parés PM (1999) Relaciones genéticas entre razas ibéricas de caballos utilizando caracteres morfológicos (pro-tótipos raciales). Agri 26:75-94.
Lauvergne JJ (1988) Populations Traditionnelles et Premières Races Standardisées d’Ovicaprinæ dans le Bassin Médi-terranéen. INRA, Paris, pp 298.
Lauvergne JJ, Bourzat D and Minville F (2000) Using mor-phobiometric indices to map goat resources in Africa. In:
Blech RM and Macdonald KC (eds) The Origins and Devel-opment of African Livestock: Archaeology, Genetics, Lin-guistics and Ethnography. UCL Press, London and New York, pp 290-301.
Liberato JR, Vale FXR and Cruz CD (1999) Técnicas estatísticas de análise multivariada e a necessidade de o fitopatologista conhecê-las. Fitopatol Brasil 24:5-8.
Machado TMM, Chakir M and Lauvergne JJ (2000) Genetic dis-tances and taxonomic trees between goats of Ceará state (Brazil) and goats of the Mediterranean region (Europe and Africa). Genet Mol Biol 23:121-125.
Malan SW (2000) The improved Boer goat. Small Rumin Res 36:165-170.
Mason IL (1988) A World Dictionary of Livestock Breeds, Types and Varieties. 3rd edition. CABI, Wallingford, 348 pp. Meyer D (1996) Árvores Evolutivas Humanas: Uma Discussão
sobre Inferência Filogenética. Sociedade Brasileira de Ge-nética, Ribeirão Preto, 162 pp.
Oliveira JD, Igarashi MLSP, Machado TMM, Miretti MM, Ferro JA and Contel EPB (2007) Structure and genetic relation-ships between Brazilian naturalized and exotic purebred goat (Capra hircus) breeds based in microsatellites. Genet Mol Biol 30:356-363.
Ouali AT, Babilliot JM, Leroux C and Martin P (2002) Genetic di-versity of the two main Moroccan goat breeds: Phylogenetic relationships with four breeds reared in France. Small Ru-min Res 45:225-233.
Quittet E (1978) La cabra: Guia Practica para el Ganadero. Mun-di-Prensa, Madrid, 321 pp.
Rocha LL, Benício RC, Oliveira JCV, Ribeiro MN and Delgado JV (2007) Estimation of morphoestructural traits in Moxoto breed goats. Arch Zootec 56:483-488.
Rodero Serrano E, Herrera García M and Gutiérrez Cabezas MJ (1992) Morphostructural evolution of the Blanca Serrana caprine breed based of their crossing for milking aptitude. Arch Zootec 41:519-530.
SAS/STAT (1999) User’s Guide, ver. 8.0. SAS Institut Inc, Cary. Sierra Alfranca I (2001) The breed concept: Evolution and reality.
Arch Zootec 50:547-564.
Skinner JD (1972) Utilization of the Boer goat for intensive ani-mal production. Trop Anim Health Prod 4:120-128.
Associate Editor: Bertram Brenig