Yield by Annuals with the Extended Logistic Model
Richard V. Scholtz III*, Allen R. Overman
Agricultural & Biological Engineering Department, University of Florida, Gainesville, Florida, United States of America
Abstract
The Extended Logistic Model (ELM) has been previously shown to adequately describe seasonal biomass production and N removal with respect to applied N for several types of annuals and perennials. In this analysis, data from a corn (Zea maysL.) study with variable applied N were analyzed to test hypotheses that certain parameters in the ELM are invariant with respect to site specific attributes, like environmental conditions and soil type. Invariance to environmental conditions suggests such parameters may be functions of the crop characteristics and certain other management practices alone (like plant population, planting date, harvest date). The first parameter analyzed wasDb, the difference between the N uptake shifting parameter and the biomass shifting parameter. The second parameter tested was Ncm, the maximum N concentration. Both parameters were shown to be statistically invariant, despite soil and site differences. This was determined using analysis of variance with normalized nonlinear regression of the ELM on the data from the study. This analysis lends further evidence that there are common parameters involved in the ELM that do not rely on site-specific or situation-specific factors. More insight into the derivation of, definition of, and logic behind the various parameters involved in the model are also given in this paper.
Citation:Scholtz RV III, Overman AR (2014) Estimating Seasonal Nitrogen Removal and Biomass Yield by Annuals with the Extended Logistic Model. PLoS ONE 9(4): e95934. doi:10.1371/journal.pone.0095934
Editor:Manuel Reigosa, University of Vigo, Spain
ReceivedDecember 17, 2013;AcceptedApril 2, 2014;PublishedApril 22, 2014
Copyright:ß2014 Scholtz, Overman. This is an open-access article distributed under the terms of the Creative Commons Attribution License, which permits unrestricted use, distribution, and reproduction in any medium, provided the original author and source are credited.
Funding:The funding of this analysis was provided by the Florida Experiment Station. The funders had no role in study design, data collection and analysis, decision to publish, or preparation of the manuscript.
Competing Interests:The authors have declared that no competing interests exist.
* E-mail: rscholtz@ufl.edu
Introduction
Effective water and nutrient management plays an essential role in future attempts at sustainable agricultural production. As the world’s population continues to grow, the potable water supply is limited and must be guarded from unnecessary withdrawals and contamination from excessive nutrient loads. Strict monitoring and exercises in groundwater modeling of all agricultural operations is cost prohibitive. It therefore becomes necessary to investigate crop nutrient removal from their environment, and to adopt management procedures and rules that are based on a sound scientific foundation.
Overman et al. first proposed the logistic model as a nutrient management tool to describe seasonal biomass yield dependence of forage grasses on applied N [1]. The original application of the logistic model to plant biomass production was based on inductive reasoning, a process where inferences are made from ‘‘real world’’ observations [2]. While inductive reasoning is innately a more empirical method of model development, all models, no matter the complexity, have some element of empiricism [3]. It is because of the application to the ‘‘real world,’’ that engineering and the applied sciences are, for practical reasons, inherently more empirical. The logistic model was extended to include seasonal plant N uptake (removal from the environment) dependence on applied N by forage grasses [4] and then for annuals, like corn [5]. The ELM is a five parameter, non-linear, parametric model that is capable of describing the seasonal biomass yields, N uptake, and N concentration with respect to applied N. Work conducted over the years has indicated that the ELM can effectively describe both
annual [6–11] and perennial [8,12–20] crops, for a wide range of nutrient inputs.
The ELM, begins with the simple logistic expression that relates N uptake,Nu, to the N applied,N, which is given by the following
relationship:
Nu~
AN
1zexpðbN{cNÞ
ð1Þ
whereANis the relative maximum N uptake in kg ha21,bNis the
dimensionless N uptake shifting parameter, andcis the applied N response parameter given in ha kg21. The phase relationship between biomass production,Y, and N uptake,Nu, is given by
Y~ YmNu kNzNu
ð2Þ
whereYm is the maximum potential biomass production in Mg ha21, andk
N is the N uptake response parameter in kg ha21. The
transformation of Eq. (1) by using Eq. (2) yields the following logistic expression:
Y~ A
1zexpðb{cNÞ ð3Þ
response parameter that applies to the N uptake logistic equation. The parametersAN,A,bN,b, andc are currently key parameters
used with the ELM, and are the easiest to determine from regression analysis.
From the transformation of Eq. (1) into Eq. (3), the relative maximum biomass yield parameter can be written in terms of the maximum potential biomass yield parameter, the relative maxi-mum N uptake parameter, and the N uptake response parameter.
A~ YmAN kNzAN
ð4Þ
The biomass shifting parameter can be written in terms of the N uptake shifting parameter, the relative maximum N uptake parameter, and the N uptake response coefficient.
b~bNzln kN
kNzAN
ð5Þ
The difference between the shifting parameter for N uptake and the biomass yield can be written as the following:
Db~bN{b~{ln
kN
kNzAN
ð6Þ
N concentration is simply defined as the ratio of N uptake to biomass production. This leads to the following relationship:
Nc~
Nu
Y~Ncm
1zexpðb{cNÞ
1zexpðbN{cNÞ
ð7Þ
The N concentration model suggests that as N applied is increased to exorbitant levels, there is a maximum limit to the N concentration,Ncm. This maximum limit is simply the ratio of the
relative maximum N uptake with respect to applied N,AN, to the
relative maximum biomass production with respect to applied N, A.
lim
N?z?Nc
~AN
A ~Ncm ð8Þ
It seems logical to suggest that as the background amount of N present in the soil is decreased, the N concentration would be reduced to some prescribed lower limit, as there would be lower limit on the percent of proteins present in a given crop to sustain any growth. Mathematically, the model suggests that this lower limit of N concentration, Ncl, is a function of the maximum
concentration and the difference between the N uptake shifting parameter and the biomass shifting parameter.
lim
N?{?
Nc~Ncmexpð{DbÞ~Ncl ð9Þ
Also, this lower limit of N concentration,Ncl, can be found by
taking the ratio of the N uptake response coefficient to the maximum potential biomass production parameter.
Ncl~
kN
Ym
ð10Þ
From the phase relationship between biomass production and N uptake, Eq. (2), N concentration can be found from the following equation with respect to N uptake:
Nc~
kN
Ym
z 1
Ym
Nu ð11Þ
This predicts a linear relationship between N concentration,Nc,
and N uptake, Nu. The line should have a slope equal to the
inverse of the maximum potential biomass production and an intercept that equals the ratio of the N uptake response parameter to maximum potential biomass production. As this is a phase relationship, this is a functional segment that is bounded between N uptake values from 0 to the peak of AN, and between N
concentration values betweenNclandNcm.
From the earlier work of Overman et al. [5], it has been shown that for a given site the applied N response parameter,c, and the N uptake intercept parameter, bN, and the biomass intercept
parameter,b, are not unique to the ELM when applied to grain or the whole plant. Meaning that the harvest index is constant for a given site. Their analysis showed that the only differences between the grain and the whole plant appear in the relative maximum N uptake parameter,AN, and the relative maximum
biomass production parameter, A[5]. Because the bN, b, and c
parameters were shown to be constant for both grain fraction and total biomass production, all the differences in both grain N uptake and biomass production, and the differences in the total plant N uptake and biomass production can be estimated with seven model parameters and a value for the seasonal amount of N applied. This is a comparative reduction of three parameters whenbN,b, andc
are not held constant between grain and total plant biomass production.
The goal of this work is to continue to elevate the Extended Logistic Model (ELM) beyond the empiricism of it nascent beginnings and achieve a balance between what can be measured and what should be modeled, as called for by Montieth [21]. The intent is to shed new light on the significance of parameters used in the ELM and to contribute to the search for commonality among parameters. Normalized non-linear regression and analysis of variance (ANOVA) were used to show the invariance of two model parameters with respect to environmental differences, namely soil type and water availability.
Methods
Data Set
loam (fine-loamy over sandy or sandy-skeletal mixed, thermic Typic Umbraquults). The experiments at each station were set up as a RCB design, with four replications. Both total plant and grain fraction biomass were sampled, and every year the experiment was conducted at a new location within the same soil type at each station. This was to limit the impact on the experiment of any residual N in the soil from the previous year. The fertilizer treatments were applied in the form of NH4NO3at rates of 0, 56,
112, 168, and 224 kg ha21of N. Average values over the four year period were combined for each of the different treatments and the model parameters were evaluated based on those combined averages.
Normalization
ParametersANandAfor grain,ANandAfor total plant, andbN,
bandcfor each site are determined simultaneously, using Raphson non-linear regression. A detailed description of Newton-Raphson non-linear regression of logistic equation can be found in Overman and Scholtz [8]. The attempt of this methodology is to consistently distribute the standard error amongst all those parameters for further analysis. Because of the unit and an order of magnitude difference between biomass and N uptake parameter values, as well as a subsequent order of magnitude difference between grain and total plant parameter values, a normalization routine is also employed. The error sum of squares for each individual site is initially written as
ESSNORM~
X Yg
Ag
{ 1 1zexpðb{cNÞ
2
zX Nug ANg
{ 1
1zexpðbN{cNÞ
2
|fflfflfflfflfflfflfflfflfflfflfflfflfflfflfflfflfflfflfflfflfflfflfflfflfflfflfflfflfflfflfflfflfflfflfflfflfflfflfflfflfflfflfflfflfflfflfflfflfflfflfflfflfflfflfflfflfflfflfflfflfflffl{zfflfflfflfflfflfflfflfflfflfflfflfflfflfflfflfflfflfflfflfflfflfflfflfflfflfflfflfflfflfflfflfflfflfflfflfflfflfflfflfflfflfflfflfflfflfflfflfflfflfflfflfflfflfflfflfflfflfflfflfflfflffl}
grain fraction
zX Yt At
{ 1 1zexpðb{cNÞ
2
zX Nut ANt
{ 1
1zexpðbN{cNÞ
2
|fflfflfflfflfflfflfflfflfflfflfflfflfflfflfflfflfflfflfflfflfflfflfflfflfflfflfflfflfflfflfflfflfflfflfflfflfflfflfflfflfflfflfflfflfflfflfflfflfflfflfflfflfflfflfflfflfflfflfflfflffl{zfflfflfflfflfflfflfflfflfflfflfflfflfflfflfflfflfflfflfflfflfflfflfflfflfflfflfflfflfflfflfflfflfflfflfflfflfflfflfflfflfflfflfflfflfflfflfflfflfflfflfflfflfflfflfflfflfflfflfflfflffl}
total plant ð12Þ
where the total normalized error is resultant from the sum of the normalized error from the three sites. For this study the initial Hessian matrix is 21 by 21 elements and paired with a 21 element Jacobian vector. As a result of the normalization procedure, performing the Newton-Raphson procedure can diverge more readily than a non-normalized procedure. Because of this, it is important to establish a reasonable initial guess for each parameter. First, individual logistic response are evaluated for each data set from all sites, for grain biomass, grain N uptake, for total plant biomass, and total plant N uptake. This results in sixA values, sixANvalues, sixbvalues, sixbNvalues, and 12 values for
the c parameter. Using the fact that it can be shown for two
straight lines
y1~m1xzb1 ð13Þ
and
y2~m2xzb2, ð14Þ
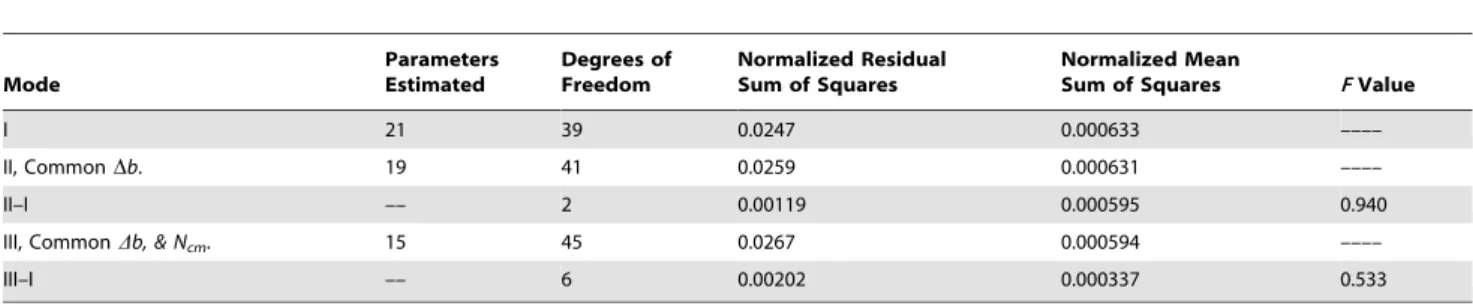
Table 1.Analysis of variance for model parameters for corn grain and total plant biomass production and for corn grain and total plant N uptake, grown on three different soils.
Mode
Parameters Estimated
Degrees of Freedom
Normalized Residual Sum of Squares
Normalized Mean
Sum of Squares FValue
I 21 39 0.0247 0.000633 ––––
II, CommonDb. 19 41 0.0259 0.000631 ––––
II–I –– 2 0.00119 0.000595 0.940
III, CommonDb, & Ncm. 15 45 0.0267 0.000594 ––––
III–I –– 6 0.00202 0.000337 0.533
doi:10.1371/journal.pone.0095934.t001
Figure 1. Dependence of grain and total plant N uptake on applied N for corn grown at the Plymouth (A), Kinston (B), and Clayton (C) experiment stations in North Carolina.Curves are constructed from Eq. 1 and from parameters listed in Table 2. doi:10.1371/journal.pone.0095934.g001
who share the same sampling of the independent variable, the best fit single slope shared between them is given by
^ m
m~m1zm2
2 ð15Þ
and the corresponding intercepts become
^ b b1~b1z
1
2ðm1{m2Þxx ð16Þ
and
^ b b2~b2z
1
2ðm2{m1Þxx, ð17Þ
the initial guess for thecparameter is the average of all 12 values, and the initial guess for each value of bN can be found from
^ b
bN~bNzðc{ccÞNN ð18Þ
and for each value ofbcan be found from
^ b
b~bzðc{ccÞNN: ð19Þ
The problem is bounded between the maximum and minimum values of thecparameter and each value ofbNis bounded between
^ b
bNmin~bNzðc{cmaxÞNN ð20Þ
and
^ b
bNmax~bNzðc{cminÞNN ð21Þ
and each value ofbis bounded between
^ b
bmin~bzðc{cmaxÞNN ð22Þ
and
^
b
bmax~bzðc{cminÞNN: ð23Þ
Analysis
The first hypothesis of this analysis is that the difference between N uptake intercept parameter and the biomass intercept param-eter,Db, is invariant with respect to the differences in soil type and water availability for a given variety of an annual crop. Note that there is no attempt in this work to identify the effects of water availability or site characteristics on the ELM parameters, but to determine which are invariant to those characteristics. For this analysis, the same genetic line of corn is propagated by seeding and harvested at the same relative age. The second hypothesis is that maximum N concentration,Ncm, is also invariant with respect
to the differences in soil type and water availability. A consequence of both hypotheses being affirmed is that the lower limit to the N concentration,Ncl, in the same annual crop is also invariant with
respect to soil type and water availability. Parameters were estimated by minimization of the normalized error sum of squares, and analysis of variance (ANOVA) was used to determine the validity of both hypotheses.
For the analysis of variance, three scenarios or modes were used, each with a targeted reduction in the number of parameters used in the ELM to describe the corn data in the Kamprath study. Mode I had 21 separate parameters that were estimated by minimization of the normalized error sum of squares. In Mode I, there are individual values forA, andAN, for both grain and for
total plant, and corresponding values forb,bN, andcat each of the
three sites. For Mode II, the number of parameters estimated dropped to 19, because theDbparameter was held constant across the three sites. For Mode III, theDband theNcmparameters were
both held constant across the three sites, reducing the number of estimated parameters to 15.
Nonlinear Coefficients of Determination [23] (Nash-Sutcliffe Model Efficiency Coefficient [24]) will be provided for grain and total plant N uptake and for grain and total plant biomass production just as a relative comparison of fit.
Results
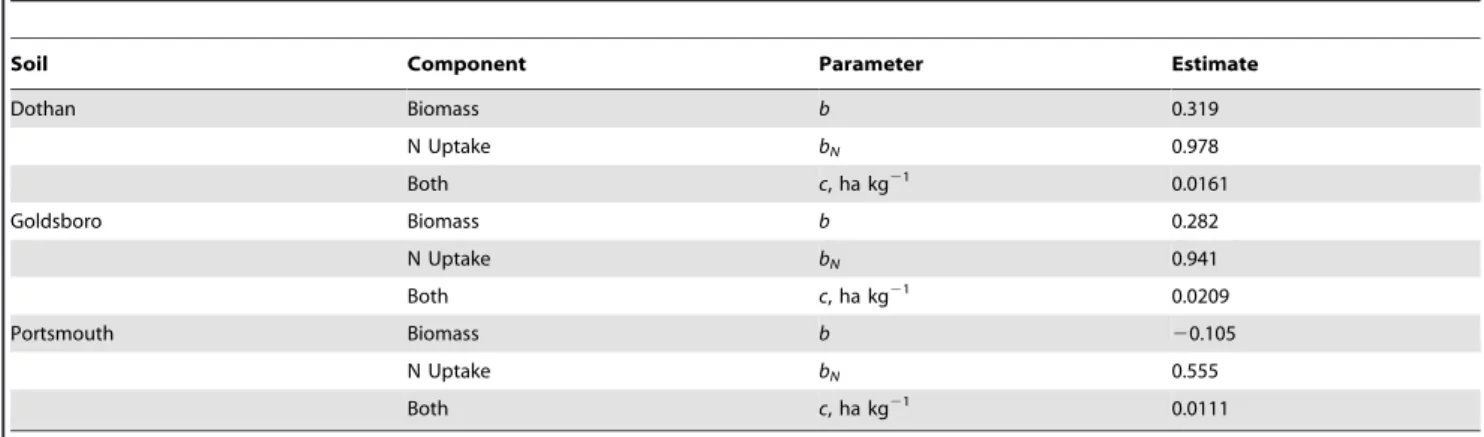
Table 1 contains the summary of the analysis of variance test. The comparison between Modes I and II leads to an increase the degrees of freedom to 41 and results in a variance ratio of 0.940. Because the critical F(2,39,95%) value is 3.24, it is concluded that there is no significant difference between the two modes. Thus in Table 2.Standard logistic model parameters invariant to corn grain and total plant biomass production and for corn grain and total plant N uptake, grown on three different soils.
Soil Component Parameter Estimate
Dothan Biomass b 0.319
N Uptake bN 0.978
Both c, ha kg21 0.0161
Goldsboro Biomass b 0.282
N Uptake bN 0.941
Both c, ha kg21 0.0209
Portsmouth Biomass b 20.105
N Uptake bN 0.555
Both c, ha kg21 0.0111
this study the Db parameter is invariant to all soil and site differences.
Also from Table 1, the comparison between Modes I and III results in an increase thedegrees of freedomto 45, and in a variance ratio of 0.533. With a critical F(6,39,95%) value of 2.34, not only is theDbparameter is invariant, but so are the total plant and grain Ncmparameters. Thus, the soil, the field conditions, the
environ-mental constraints, and even water availability play no role in either is the Db or the two Ncm parameters. This leads to an
invariance in the total plant and grainNclparameters, by virtue of
Eq. (9).
The dependence of grain and whole plant N uptake on applied N at harvest is represented by Figure 1 for the three soil types. In general there is good agreement between the model line and the data. The resulting N uptake model lines (depicted in Figure 1), are generated from Eq. (1), using parameter values forbNand c
from Table 2 and values for ANg and ANt found in Table 3.
Equation specific Non-linear Coefficient of Determination values and Error Sum of Squares are provided in Table 4.
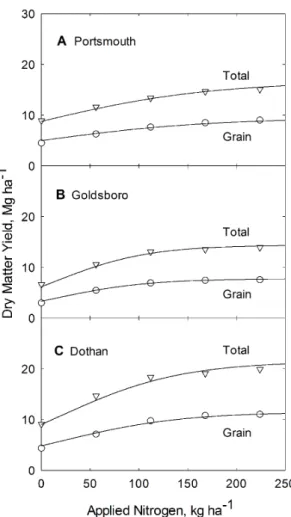
Grain and whole plant biomass production versus applied N is shown in Figure 2 for all three soil types. In general there is good agreement between the model line and the data. The resulting biomass model lines (depicted in Figure 2), are generated from Eq. (3), using parameter values forbandcfrom Table 2 and values for Ag and At found in both Table 3. Equation specific Non-linear
Coefficient of Determination values and Error Sum of Squares are provided in Table 4.
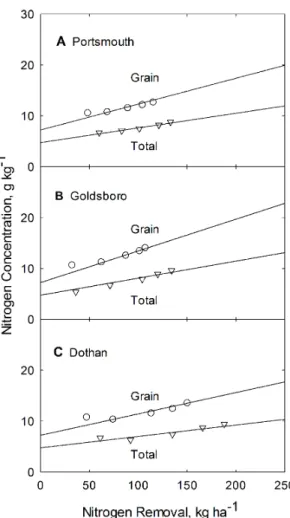
N concentration dependence on applied N is shown in Figure 3 for all three soil types. The resulting N concentration model lines (depicted in Figure 3), are generated from Eq. (7), using parameter values forb,bNandcfrom Table 2 and values forNcm gandNcm t
from Table 6.
The phase relationship between biomass production and N uptake for the corn grain and the whole plant is represented by Figure 4 for each of the three soils. The resulting biomass – N uptake phase model lines (depicted in Figure 4), are generated from Eq. (2), using parameter values forkNg,kNt,YmgandYmtfound
in Table 5.
The phase relationship between N Concentration and N uptake for the grain and the whole plant is represented by Figure 4 for each of the three soils. The resulting between N Concentration – Figure 2. Dependence of grain and total plant biomass
production on applied N for corn grown at the Plymouth (A), Kinston (B), and Clayton (C) experiment stations in North Carolina. Curves are constructed from Eq. 3 and from parameters listed in Table 2.
doi:10.1371/journal.pone.0095934.g002
Table 3.Standard logistic model parameters specific to corn grain and total plant biomass production and for corn grain and total plant N uptake, grown on three different soils.
Soil Component Parameter Plant Fraction Estimate
Dothan Biomass Ag, Mg ha21 Grain 11.5
At, Mg ha21 Total Plant 21.5
N Uptake ANg, kg ha21 Grain 161
ANt, kg ha21 Total Plant 198
Goldsboro Biomass Ag, Mg ha21 Grain 7.76
At, Mg ha21 Total Plant 14.4
N Uptake ANg, kg ha21 Grain 108
ANt, kg ha21 Total Plant 132
Portsmouth Biomass Ag, Mg ha21 Grain 9.50
At, Mg ha21 Total Plant 16.7
N Uptake ANg, kg ha21 Grain 133
ANt, kg ha21 Total Plant 154
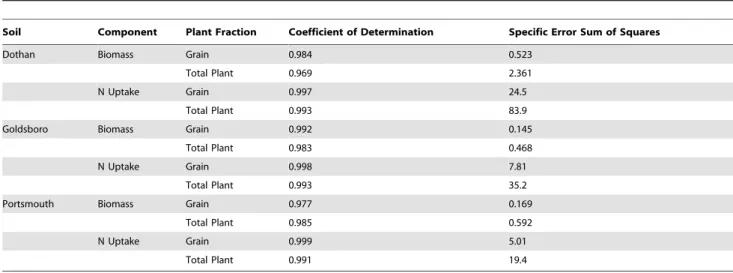
Table 4.Standard statistical measures of fit, based on specific component and plant fraction data.
Soil Component Plant Fraction Coefficient of Determination Specific Error Sum of Squares
Dothan Biomass Grain 0.984 0.523
Total Plant 0.969 2.361
N Uptake Grain 0.997 24.5
Total Plant 0.993 83.9
Goldsboro Biomass Grain 0.992 0.145
Total Plant 0.983 0.468
N Uptake Grain 0.998 7.81
Total Plant 0.993 35.2
Portsmouth Biomass Grain 0.977 0.169
Total Plant 0.985 0.592
N Uptake Grain 0.999 5.01
Total Plant 0.991 19.4
doi:10.1371/journal.pone.0095934.t004
Figure 3. Dependence of grain and total plant N concentration on applied N for corn grown at the Plymouth (A), Kinston (B), and Clayton (C) experiment stations in North Carolina.Curves are constructed from Eq. 7 and from parameters listed in Table 2. doi:10.1371/journal.pone.0095934.g003
Figure 4. Dependence of grain and total plant biomass production on N uptake for corn grown at the Plymouth (A), Kinston (B), and Clayton (C) experiment stations in North Carolina. Curves are constructed from Eq. 2 and from parameters listed in Table 3.
N uptake phase model lines (depicted in Figure 5), are generated from Eq. (11), using parameter values for kNg, kNt, Ymg and Ymt
found in Table 5.
Discussion
From this analysis it is concluded that there are aspects of the ELM that are invariant with respect to both soil type and water availability for a given variety of annual crop propagated by seeding and harvested at the same relative age. This analysis has shown, for the Kamprath N-rate study conducted on corn in North Carolina [22] that both the difference between N uptake intercept parameter and the biomass intercept parameter,Db, and the maximum N concentration, Ncm, are in fact invariant with
respect to the crop’s surrounding environmental conditions. From the model, these facts lead to the conclusion that both the upper limit N concentration,Ncm, and the lower limit N concentration,
Ncl, are both invariant with respect to soil type and water
availability in the study analyzed. This further suggests that theNcm
andNclparameters are of more importance to the model. While
other parameters, such as
A~AN Ncm
ð24Þ
Db~ln Ncm
Ncl
ð25Þ
b~bN{Db~bN{ln
Ncm
Ncl
ð26Þ
Ym~
AN
Ncm{Ncl
ð27Þ
and
kN~NclYm~
NclAN
Ncm{Ncl
ð28Þ
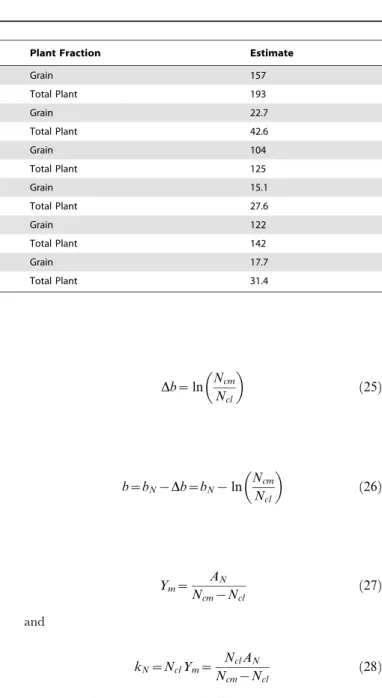
can be rewritten, to show the significance that upper and lower limit concentrations have in each parameter and ultimately seasonal plant response to nutrient application. Having upper Table 5.Standard phase model parameters for corn grain and total plant biomass production and for corn grain and total plant N uptake.
Soil Parameter Plant Fraction Estimate
Dothan kNg, kg ha21 Grain 157
kNt, kg ha21 Total Plant 193
Ymg, Mg ha21 Grain 22.7
Ymt, Mg ha21 Total Plant 42.6
Goldsboro kNg, kg ha21 Grain 104
kNt, kg ha21 Total Plant 125
Ymg, Mg ha21 Grain 15.1
Ymt, Mg ha21 Total Plant 27.6
Portsmouth kNg, kg ha21 Grain 122
kNt, kg ha21 Total Plant 142
Ymg, Mg ha21 Grain 17.7
Ymt, Mg ha21 Total Plant 31.4
doi:10.1371/journal.pone.0095934.t005
Table 6.Parametric factors invariant to site attributes, including soil type.
Plant Fraction Parameter Estimate
Both Db, kg ha21 0.660
Grain Ncm g, g kg21 14.0
Total Plant Ncm t, g kg21 9.18
Grain Ncl g, g kg21 7.23
Total Plant Ncl t, g kg21 4.75
Grain Ncm t2Ncl t= ANt/Ymt, g kg
21 6.75
Total Plant Ncm g2Ncl g= ANg/Ymg, g kg21 4.43
and lower limits to plant nutrient concentration corresponds with plant physiology. Without a minimum level of a given required nutrient, there can be no yield, seasonal or otherwise. There should also be a maximum concentration that can be approached, as there should be diminishing yield increases as higher agronomic rates are applied, or there would be unbounded growth.
If this invariance with respect to soil type and water availability holds for all crops propagated by seeding, the model could be written in terms of parameters that have measurable physiological significance and could give further insight into relationships that govern plant development and nutrient removal. Initial evidence appears promising that perennial crops, such as ryegrass (Lolium perenneL.), when held to comparably the same seasonal manage-ment practices also exhibit very nearly the same conclusions with regard to both constant values of theNcmandNclparameters [25].
Given that N uptake and biomass production can be described by five parameters, and if two are invariant to all but crop type
and season length, the model reduces to three parameters (AN,bN,
andc) when a crop and season length are chosen. From Overman & Scholtz [26] the logistic response originates within the soil’s buffering capacity for P and for K, and thecparameter remains the same from the plant extractable logistic response to nutrient uptake logistic response, and to biomass production. It is here assumed that thecparameter for applied N also originates as the rate response parameter for the soil’s buffering capacity of N. The cparameter can be modified by plant population [11]. A Future step should be to analyze various field studies to catalogue soil physical and chemical characteristics and the resulting impact on thecparameter. MathematicallybNrepresents shifting parameter
which in conjunction with thecparameter as
N0:5~ bN
c ð29Þ
N0.5represents the effective level of N necessary to achieve peak
N uptake efficiency [10,16,17]. Ultimately, for environmental considerations, setting applied rate of N to the peak uptake level will result in the most N removed per unit N applied. Plus, provided the difference betweenband bNis greater than 0, then
the yield will be on the upper portion of the logistic biomass curve to yield
Y~ AN
Ncm½1zexpð{DbÞ:
ð30Þ
The bNparameter is affected by changes in plant population
[11] and is also influenced by crop type [8,25]. The remaining parameter,AN, is a linear parameter that is affected by the various
environmental conditions, the crop type, the soil type, and various management practices [5–20]. Given Eq. (30), knowing the invariant Db value for a given crop, and having a reasonable estimate for the background level of N already present in the soil, represented by Eq. (29), exists the beginning of a framework for a more reasonable and more sustainable nutrient management guide. Further analyses are being conducted to verify these findings with other annual propagated by seeding and with perennial crops.
Acknowledgments
The authors would like to acknowledge the hard work of field researchers, like Dr. Kamprath, whose tireless efforts have helped bring about greater understanding of the complexities of agricultural production.
Author Contributions
Conceived and designed the experiments: RVS ARO. Performed the experiments: RVS. Analyzed the data: RVS. Contributed reagents/ materials/analysis tools: RVS. Wrote the paper: RVS. Mentorship and review: ARO.
References
1. Overman AR, Martin FG, Wilkinson SR (1990) A logistic equation for yield response of forage grass to nitrogen. Commun Soil Sci Plan 21: 595–609. 2. Ferris T (1989) Coming of age in the milky way. New York: Bantam Doubleday
Dell Publishing Group. 495 p.
3. France J, Thornley JHM (1984) Mathematical models in agriculture. London: Butterworth and Company. 352 p.
4. Overman AR, Wilkinson SR, Wilson DM (1994) An extended model of forage grass response to applied nitrogen. Agron J 86: 617–620.
5. Overman AR, Wilson DM, Kamprath EJ (1994) Estimation of yield and nitrogen removal by corn. Agron J 86: 1012–1016.
6. Reck WR, Overman AR (1996) Estimation of corn response to water and applied nitrogen. J Plant Nutr 19: 201-214.
7. Overman AR (1999) Model for accumulation of dry matter and plant nutrient elements by tobacco. J Plant Nutr 22: 1, 81–92.
8. Overman AR, Scholtz RV (2002) Mathematical models of crop growth and yield. New York: Marcel Decker. 342 p.
9. Overman AR, Scholtz RV (2002) Corn response to irrigation and applied nitrogen. Commun Soil Sci Plan 33: 3609–3619.
10. Overman AR, Brock KH (2003) Model analysis of corn response to applied nitrogen and tillage. Commun Soil Sci Plan 34: 2177–2191.
11. Overman AR, Scholtz RV, Brock KH (2006) Model analysis of corn response to applied nitrogen and plant population density. Commun Soil Sci Plan 37: 1157– 1172.
12. Overman AR, Howard JC (2012) Model analysis of response to applied nitrogen by cotton. J Plant Nutr 35: 2118–2123.
13. Overman AR, Wilkinson SR (1995) Extended logistic model of forage grass response to applied nitrogen, phosphorus, and potassium. T ASAE 38: 103–108. 14. Overman AR, Stanley RL (1998) Bahiagrass responses to applied nitrogen and
harvest interval. Commun Soil Sci Plan 29: 237–244.
15. Overman AR, Wilkinson SR (2003) Extended logistic model of forage grass response to applied nitrogen as affected by soil erosion. T ASAE 46: 1375–1380. 16. Overman AR, Brock KH (2003) Model comparison of coastal bermudagrass and pensacola bahiagrass response to applied nitrogen. Commun Soil Sci Plan 34: 2163–2176.
17. Overman AR, Scholtz RV, Taliaferro CM (2003) Model analysis of response of bermudagrass to applied nitrogen. Commun Soil Sci Plan 34: 1303–1310.
18. Overman AR, Rhoads FM, Brock KH (2005) Model analysis of response of pensacola bahiagrass to applied nitrogen, phosphorus, and potassium. I. Seasonal dry matter. J Plant Nutr 27: 1747–1756.
19. Overman AR, Rhoads FM, Brock KH (2005) Model analysis of response of pensacola bahiagrass to applied nitrogen, phosphorus, and potassium. II. Seasonal P and K uptake. J Plant Nutr 27: 1757–1777.
20. Overman AR, Scholtz RV (2005) Model analysis for response of dwarf elephantgrass to applied nitrogen and rainfall. Commun Soil Sci Plan 35: 2485– 2494.
21. Monteith JL (1996) The quest for balance in crop modeling. Agron J 88: 695-697.
22. Kamprath EJ (1986) Nitrogen studies with corn on coastal plain soils, Technical Bulletin 282. Raleigh: North Carolina Agricultural Research Service, North Carolina State University. 15 p.
23. Draper NR, Smith H (1998) Applied regression analysis.3rd
ed. New York: John Wiley and Sons. 736 p.
24. Nash JE, Sutcliffe JV (1970) River flow forecasting through conceptual models part I - A discussion of principles. J Hydrol 10: 282–290.
25. Scholtz RV (2002) Mathematical modeling of agronomic crops: analysis of nutrient removal and dry matter accumulation. Doctor of Philosophy Dissertation. Gainesville: University of Florida. 139 p.