ACPD
10, 13755–13796, 2010Sources of light-absorbing aerosol in arctic
snow
D. A. Hegg et al.
Title Page
Abstract Introduction
Conclusions References
Tables Figures
◭ ◮
◭ ◮
Back Close
Full Screen / Esc
Printer-friendly Version Interactive Discussion
Discussion
P
a
per
|
Dis
cussion
P
a
per
|
Discussion
P
a
per
|
Discussio
n
P
a
per
|
Atmos. Chem. Phys. Discuss., 10, 13755–13796, 2010 www.atmos-chem-phys-discuss.net/10/13755/2010/ doi:10.5194/acpd-10-13755-2010
© Author(s) 2010. CC Attribution 3.0 License.
Atmospheric Chemistry and Physics Discussions
This discussion paper is/has been under review for the journal Atmospheric Chemistry and Physics (ACP). Please refer to the corresponding final paper in ACP if available.
Sources of light-absorbing aerosol in
arctic snow and their seasonal variation
D. A. Hegg1, S. G. Warren1, T. C. Grenfell1, S. J. Doherty2, and A. D. Clarke3
1
Department of Atmospheric Sciences, University of Washington, Seattle, WA, USA
2
JISAO, University of Washington, Seattle, WA, USA
3
School of Ocean and Earth Sciences and Technology, University of Hawaii, Honolulu, HI, USA
Received: 25 May 2010 – Accepted: 26 May 2010 – Published: 4 June 2010
Correspondence to: D. A. Hegg (deanhegg@atmos.washington.edu)
ACPD
10, 13755–13796, 2010Sources of light-absorbing aerosol in arctic
snow
D. A. Hegg et al.
Title Page
Abstract Introduction
Conclusions References
Tables Figures
◭ ◮
◭ ◮
Back Close
Full Screen / Esc
Printer-friendly Version Interactive Discussion
Discussion
P
a
per
|
Dis
cussion
P
a
per
|
Discussion
P
a
per
|
Discussio
n
P
a
per
Abstract
Two data sets consisting of measurements of light absorbing aerosols (LAA) in arctic snow together with suites of other corresponding chemical constituents are presented; the first from Siberia, Greenland and near the North Pole obtained in 2008, and the second from the Canadian arctic obtained in 2009. A preliminary differentiation of the
5
LAA into black carbon (BC) and non-BC LAA is done. Source attribution of the light absorbing aerosols was done using a positive matrix factorization (PMF) model. Four sources were found for each data set (crop and grass burning, boreal biomass burning, pollution and marine). For both data sets, the crops and grass biomass burning was the main source of both LAA species, suggesting the non-BC LAA was brown carbon.
10
Depth profiles at most of the sites allowed assessment of the seasonal variation in the source strengths. The biomass burning sources dominated in the spring but pollution played a more significant (though rarely dominant) role in the fall, winter and, for Green-land, summer. The PMF analysis is consistent with trajectory analysis and satellite fire maps.
15
1 Introduction
A number of recent studies have suggested that light absorbing aerosols (LAA), broadly assumed to be largely black carbon (BC), deposited to the snow pack are an important contributor to the warming of the Arctic (Hansen and Nazarenko, 2004; Flanner et al., 2007; McConnell et al., 2007; Shindell and Faluvegi, 2009). An important facet
20
of this issue, particularly from the standpoint of possible remediation, is quantitatively understanding the sources of the LAA in the snow.
Until recently, direct measurements of black carbon in arctic snow have been geo-graphically sparse (e.g., Clarke and Noone, 1985; Chylek et al., 1992; Masclet et al., 2000; Grenfell et al., 2002; Hagler et al., 2007; Perovich et al., 2009). As a
conse-25
ACPD
10, 13755–13796, 2010Sources of light-absorbing aerosol in arctic
snow
D. A. Hegg et al.
Title Page
Abstract Introduction
Conclusions References
Tables Figures
◭ ◮
◭ ◮
Back Close
Full Screen / Esc
Printer-friendly Version Interactive Discussion
Discussion
P
a
per
|
Dis
cussion
P
a
per
|
Discussion
P
a
per
|
Discussio
n
P
a
per
|
modeling coupled with validation comparisons with these limited data (e.g., Generoso et al., 2007). However, in 2007 a study was initiated under the auspices of the NSF Arctic Program to rectify the lack of data on black carbon in arctic snow and, in par-ticular, the poor geographic coverage of large portions of the arctic (Doherty et al., 2010). During the first year of this program, snow samples were acquired at numerous
5
sites around the arctic basin, including a substantial number in Siberia, a region hith-erto completely devoid of data. That data set was then used in a receptor modeling analysis to determine the LAA sources (Hegg et al., 2009). The dominant source of LAA for three of the four arctic regions examined (Greenland, Russia and Canada) was biomass burning. The fourth region, the area near the North Pole, whose main source
10
of LAA was industrial pollution, was the only exception. This result was surprising. While the importance of biomass burning has been recognized, at least on an episodic basis (cf., Stohl et al., 2006; Warneke et al., 2009), most general analyses, largely based on numerical models, have suggested that the main source of LAA in the arc-tic is fossil fuel combustion (e.g., Flanner et al., 2007; Ramanathan and Carmichael,
15
2008). One noteworthy exception to this is the recent ice core analysis of McConnnell et al. (2007), which suggests that since∼1950 the main source of LAA (measured as
BC) in the Greenland snow has been biomass burning. This finding is in agreement with the analysis of Hegg et al. (2009), but the latter expands the coverage to the arctic as a whole, at least for the 2006–2007 snow season.
20
Given the importance of such a shift in our understanding of the source attribution of LAA in arctic snow, more receptor modeling for other time periods to corroborate the results to date is essential. Furthermore, other related issues need to be addressed. For example, biomass burning emissions in the Northern Hemisphere have a strong seasonality, the burning season generally being in late spring and summer (e.g.,
Gen-25
ACPD
10, 13755–13796, 2010Sources of light-absorbing aerosol in arctic
snow
D. A. Hegg et al.
Title Page
Abstract Introduction
Conclusions References
Tables Figures
◭ ◮
◭ ◮
Back Close
Full Screen / Esc
Printer-friendly Version Interactive Discussion
Discussion
P
a
per
|
Dis
cussion
P
a
per
|
Discussion
P
a
per
|
Discussio
n
P
a
per
earlier onset of snow melt (cf. Stohl et al., 2006), but the season for burning would expand by at most a month and thus still be in spring. Industrial emissions of aerosols, on the other hand, tend to be more invariant seasonally. As a consequence of this, biomass-burning aerosols tend to show concentration maxima during the spring and summer at arctic receptor sites (e.g., Quinn et al., 2007). Hence, one might expect the
5
impact of biomass burning sources of LAA to be most important in the topmost portion of the snow pack in the spring, just before melting commences. In fact, this is where the concentration of LAA is often (but not always) highest and also where the impact of LAA on the snow albedo is greatest (Clarke and Noone, 1985; Flanner et al., 2007; Grenfell et al., 2002). Assessment of seasonal variability in the source strengths of
10
the LAA in more than one year would add much to the credibility of this model of the seasonal evolution of LAA in arctic snow.
Another issue of great recent interest is the precise nature of the light-absorbing aerosol (LAA) in the snow, which includes not only black carbon but also “brown car-bon” (i.e., light-absorbing organics) and soil dust. Spectrophotometric analysis of LAA
15
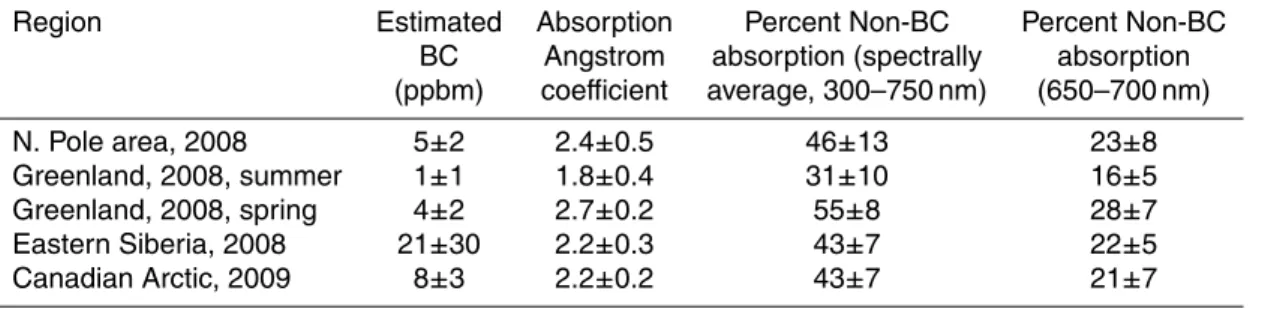
in snow not only provides information on snow BC concentrations but also gives the spectral absorption of all LAA captured on the snow filters (Grenfell et al., 2010). This information has been used in a preliminary assessment of the partitioning of the light absorption in the snow between BC and non-BC aerosol. A summary of the findings is presented in Table 1, taken from Doherty et al. (2010). Light absorption by
non-black-20
carbon aerosol varies substantially both temporally and spatially but is typically∼20%
of the total light absorption at 650–700 nm (last column of Table 1). If one weights the absorption by the solar spectrum over the range of interest for snow (300–750 nm; Doherty et al., 2010), then the non-BC absorption fraction is even larger due to the enhanced absorption at shorter wavelengths (column 4 of Table 1). For all arctic data
25
ACPD
10, 13755–13796, 2010Sources of light-absorbing aerosol in arctic
snow
D. A. Hegg et al.
Title Page
Abstract Introduction
Conclusions References
Tables Figures
◭ ◮
◭ ◮
Back Close
Full Screen / Esc
Printer-friendly Version Interactive Discussion
Discussion
P
a
per
|
Dis
cussion
P
a
per
|
Discussion
P
a
per
|
Discussio
n
P
a
per
|
Finally, in Hegg et al. (2009), two distinct biomass source profiles were identified, with one more prevalent in the Russian arctic and the other in the Canadian arctic. We speculated then that one might be a marker for agricultural burning and the other for boreal fires. We pursue this issue further here since, if biomass burning is in fact the main source of snow LAA, refinement of this source with respect to fuel type and
loca-5
tion would contribute substantially to the refinement of prognostic models and possible remediation strategies.
2 Methodology
2.1 Chemical speciation
The laboratory analysis of both the water and filter samples in general followed the
10
procedures described by Hegg et al. (2009). Briefly, the water samples, derived from filtering melted snow through Nuclepore filters in the field, are treated with biocide, and then refrozen. After arrival in the laboratory, they are melted and subjected to analysis by ion chromatography (IC), liquid chromatography, and inductively-coupled plasma-optical emission spectroscopy as per Hegg et al. (2009). In a few instances,
15
unfiltered snow samples corresponding to the filtered samples were also analyzed to assess the possible impact of filtering on the soluble analytes. No significant difference between filtered and unfiltered samples was observed. The filters themselves were analyzed optically for absorption as per Grenfell et al. (2010). However, after the op-tical measurements, the treatment of the filters deviated from our previous approach.
20
Rather than extraction in hexane for PAH analysis – which has proved to be of limited value in source attribution – the filters were extracted in 750 mM NaOH and then run through a macroporous vinylbenzyl chloride/divinyl benzene IC column, the substrate fully functionalized by alkyl quaternary ammonium groups (Dionex Inc., MA 1 Carbopac column), coupled to a pulsed amperometric detector (IC-PAD) for analysis of vanillin
25
ACPD
10, 13755–13796, 2010Sources of light-absorbing aerosol in arctic
snow
D. A. Hegg et al.
Title Page
Abstract Introduction
Conclusions References
Tables Figures
◭ ◮
◭ ◮
Back Close
Full Screen / Esc
Printer-friendly Version Interactive Discussion
Discussion
P
a
per
|
Dis
cussion
P
a
per
|
Discussion
P
a
per
|
Discussio
n
P
a
per
conjunction with concentration during filter extraction, yields a detection limit for vanillin in snow of∼50 ppt.
Vanillic acid is a well-known biomass-burning marker, recently used, for example, by McConnell et al. (2007) to identify biomass burning as the major source of black car-bon in Greenland snow. The closely related vanillin, and various associated methoxy
5
phenols, are equally if not more prevalent products of biomass combustion, specifi-cally lignin combustion (e.g., Simoneit, 2002; Hays et al., 2005; Oros and Simoneit, 2001a; Oros et al., 2006). Vanillin is thus typically preferentially found in burning emissions from boreal biomass as compared to another well-known biomass tracer, levoglucosan, a cellulose combustion product found in emissions from all plant
com-10
bustion (Simoneit, 2002). For example, the vanillin to levoglucosan ratio in emissions from agricultural biomass burning (typically low in lignins) has been found to be∼10−3
(e.g., Hays et al., 2005) whereas in boreal conifers it has been found to be 0.1–0.3 (e.g., Oros and Simoneit, 2001a). In this study we explore the feasibility of using this ratio to discriminate agricultural burning from boreal biomass burning.
15
In addition to the chemical species just discussed, the PMF analysis was run with the concentrations of black carbon (BC) and “non-BC LAA” as given by the photo-metric analysis. These are derived by using the measured spectrally-resolved optical depth of the aerosol on the filter to get a maximum possible BC concentration (CBCMAX in Grenfell et al., 2010), then using the measured light-absorption Angstrom exponent
20
along with an assumed absorption Angstrom for BC (1.0) and non-BC light-absorbing aerosol (5.0) to estimate the true BC concentration (CEST
BC in Grenfell et al., 2010, here
simply “BC”). Here, non-BC LAA is the difference between theCMAX
BC andC EST
BC values
of Grenfell et al. (2010). The non-BC LAA concentration (ng/g) will differ from the true mass concentration of the non-BC light absorbing aerosol to the extent that its mass
25
ACPD
10, 13755–13796, 2010Sources of light-absorbing aerosol in arctic
snow
D. A. Hegg et al.
Title Page
Abstract Introduction
Conclusions References
Tables Figures
◭ ◮
◭ ◮
Back Close
Full Screen / Esc
Printer-friendly Version Interactive Discussion
Discussion
P
a
per
|
Dis
cussion
P
a
per
|
Discussion
P
a
per
|
Discussio
n
P
a
per
|
analysis.
2.2 Data base
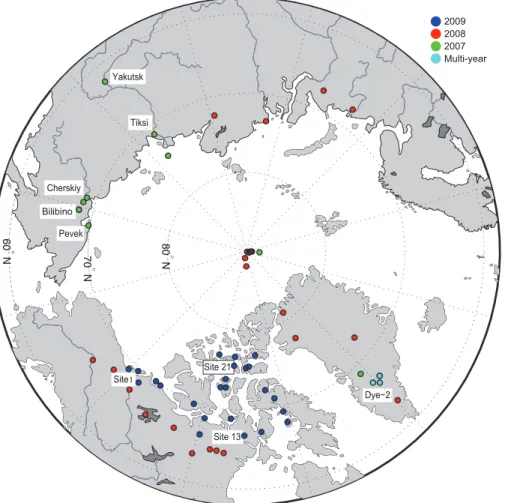
Two distinct data sets have been used for this analysis. The first of these was acquired in 2008, with samples obtained at or near four sites in eastern Siberia, at the Dye-2 site in southern Greenland and an area near the North Pole. The collection period in
5
Siberia and the Arctic Ocean was from 1 April to 8 May but was late July in Greenland. At the four main Siberian sites and Greenland, snow samples were obtained not just near the surface but also throughout the snow column, thus permitting assessment of source strengths over the entire snow deposition season.
The second data set used here was obtained in 2009 in the Canadian arctic. As
10
with the earlier data from Canada used in Hegg et al. (2009), the sampling period was the spring (26 April to 6 May) but the present set has much enhanced geographic coverage, including numerous samples from the High Arctic. Samples were obtained at 24 sites, and at all sites vertical profiles of water samples through the snow pack were obtained. The sample locations for both data sets are shown in Fig. 1.
15
2.3 Receptor modeling
Receptor modeling, a form of Analysis of Variance (ANOVA), is a generally accepted technique for source attribution of aerosols when source emission profiles are uncer-tain or even unknown. Perhaps the most widely used receptor approach is that of Positive Matrix Factorization (PMF) (Paatero and Tapper, 1994), which has been used
20
on several occasions on arctic data sets (e.g. Polissar et al., 1998; Xie et al., 1999). We in fact used a PMF model in our analysis of a 2007 data set on snow composition, deriving the sources of BC in the snow pack (Hegg et al., 2009), as per the above discussion. In that instance the specific model used was the US EPA PMF model 1.1, which had been widely used in regulatory assessments. For this study, we use the
25
ACPD
10, 13755–13796, 2010Sources of light-absorbing aerosol in arctic
snow
D. A. Hegg et al.
Title Page
Abstract Introduction
Conclusions References
Tables Figures
◭ ◮
◭ ◮
Back Close
Full Screen / Esc
Printer-friendly Version Interactive Discussion
Discussion
P
a
per
|
Dis
cussion
P
a
per
|
Discussion
P
a
per
|
Discussio
n
P
a
per
2.4 Back trajectory cluster analysis
Back trajectory analysis of various sorts has long been used as a tool for either iden-tifying or confirming sources of atmospheric pollution, and has been so used in the arctic (e.g., Treffeisen et al., 2004; Eleftheriadis et al., 2009). We utilize it here as a consistency check on the results of the PMF analysis. The particular model used is the
5
NOAA HYSPLIT IV model, in a cluster analysis mode (Toledano et al., 2009). The back trajectories were initialized at an altitude of 500 m a.g.l. This altitude was selected be-cause it is a typical altitude for the accretion zone of the mixed-phase low level clouds that are characteristic of the arctic spring and fall (e.g., Hobbs and Rangno, 1998; Mor-rison et al., 2005; Luo et al., 2008). Hence, it is the altitude from which most of the LAA
10
is incorporated into the snow on the ground.
3 Results and discussion
3.1 PMF source profiles and their interpretation
Exercising the PMF model on the 2008 data set with various factor numbers yielded an optimal solution (withQrobust∼2×Qtheoretical) for four factors or sources. The source
15
profiles for these four sources are shown in Fig. 2a. It is interesting that both forms of LAA have nearly identical source profiles (a finding echoed in the 2009 data set discussed below), suggesting that their source attribution is essentially the same. While it is conceivable that this congruence is due at least in part to failure of the technique employed to fully resolve the two species, it would also be consistent with the likely
20
nature of the non-BC LAA. The non-BC LAA is differentiated from BC by its increasing light absorption with decreasing wavelength in the visible to near-UV region of the spectrum (Grenfell et al., 2010). This characteristic is associated with “brown carbon (BrC)”, essentially light-absorbing organic carbon (Moosmuller et al., 2009), and with soil dust containing iron oxides. Recent studies have suggested that BrC is largely
ACPD
10, 13755–13796, 2010Sources of light-absorbing aerosol in arctic
snow
D. A. Hegg et al.
Title Page
Abstract Introduction
Conclusions References
Tables Figures
◭ ◮
◭ ◮
Back Close
Full Screen / Esc
Printer-friendly Version Interactive Discussion
Discussion
P
a
per
|
Dis
cussion
P
a
per
|
Discussion
P
a
per
|
Discussio
n
P
a
per
|
derived from various sorts of biomass burning (Lukacs et al., 2007; Favez et al., 2009a, b), which is also a major source of BC in the arctic (e.g., Hegg et al., 2009). Hence, similar sources for BC and BrC in this data set is quite plausible, presuming that the factors upon which the BrC and BC load are in fact biomass. This leads us to the identification of the sources indicated in the analysis.
5
A marine source, characterized by high loadings of Na, Cl and K is clearly evident. However, note that, as in Hegg et al. (2009), it is important to realize that this does not mean that the ocean should be considered a source of LAA. Rather, the LAA as-sociated with this factor had a non-marine source but experienced a trajectory over the ocean. The percentage of the LAA loaded onto this factor is the lowest of any of
10
the factors. Another factor with an almost equally low loading of LAA is distinguished by very high loadings of Zn and Se and modest but significant loadings of Ba and S. The metal species are characteristic of smelter emissions, such as those from the gi-gantic complex at Noril’sk and the somewhat smaller (but still very large) complex at Sudbury, Ontario (cf., Rahn et al., 1983). The relatively low S loading is a bit
unex-15
pected. However, as pointed out by Rahn et al. (1983), while these smelters are the largest point sources of sulfur on the planet, there are many other sources of S (and sulfate) that, while much lower in intensity, cover much larger areas and simply add up. In this regard, we note that one of the remaining two sources resolved, crop and grass biomass, (see discussion below), has by far the highest loading of Non-Sea-Salt
20
(NSS) sulfate, normally considered a predominantly industrial product (via oxidation of SO2). Biomass burning does in fact yield NSS sulfate emissions (Hegg et al., 2009)
but in large part we feel that this loading arises from the huge geographic extent of biomass burning in Siberia, affording the opportunity for the burning emissions to mix with various industrial sources to augment the sulfate actually emitted in the fires.
25
ACPD
10, 13755–13796, 2010Sources of light-absorbing aerosol in arctic
snow
D. A. Hegg et al.
Title Page
Abstract Introduction
Conclusions References
Tables Figures
◭ ◮
◭ ◮
Back Close
Full Screen / Esc
Printer-friendly Version Interactive Discussion
Discussion
P
a
per
|
Dis
cussion
P
a
per
|
Discussion
P
a
per
|
Discussio
n
P
a
per
of essentially any sort of plant combustion, one would expect it to be present in any biomass burning (Simoneit, 2002). Vanillin is also a well-known marker for biomass burning (Simoneit, 2002; Oros and Simoneit, 2001a; Hays et al., 2005). Additionally, both NSS potassium, loaded strongly onto one of the sources, and oxalate, loaded strongly onto the other, are well-known biomass burning emissions (Hegg et al., 2009).
5
Hence, we interpret both of these last two sources as biomass burning, though the different character of the loadings shown in Fig. 2a suggest that the biomass burning sources they represent are distinct. Most tellingly, while levoglucosan, an anhydrous sugar, is the product of cellulose combustion and thus found in virtually all plant burn-ing emissions, vanillin, a methoxy phenol, is the product of combustion of lignin and is
10
found preferentially in the combustion of trees, either conifers or (even more markedly) deciduous (Oros and Simoneit, 2001a, b). In contrast, vanillin emissions from crop or grass burning is slight (Hays et al., 2005; Oros et al., 2006). While observed ratios of vanillin to levoglucosan in fire emissions vary widely, they tend to be orders of mag-nitude higher in emissions from boreal biomass burning, which are mostly fueled by
15
conifers and deciduous trees, than from agricultural or grass burning (as per the above references). For the 2008 data set, the “vanillin” source has a ratio of vanillin to lev-oglucosan concentration loading of 80 whereas the “levlev-oglucosan” source has a ratio of 0.5. Consequently, we consider the “vanillin” source to be boreal biomass burning and will henceforth refer to it as such. Similarly, we will call the “levoglucosan” source
20
crop and grass burning. Consistent with this characterization, we further note that the ratio of LAA to potassium in the boreal burning source profile (ratio of 8) is much higher than the same ratio in the crop and grass burning source (ratio of 2.2), as per Hegg et al. (2009). Also, it is of interest to note that nitrate, commonly associated with biomass burning as well as pollution, is mostly loaded on the crop and grass burning source
25
ACPD
10, 13755–13796, 2010Sources of light-absorbing aerosol in arctic
snow
D. A. Hegg et al.
Title Page
Abstract Introduction
Conclusions References
Tables Figures
◭ ◮
◭ ◮
Back Close
Full Screen / Esc
Printer-friendly Version Interactive Discussion
Discussion
P
a
per
|
Dis
cussion
P
a
per
|
Discussion
P
a
per
|
Discussio
n
P
a
per
|
interpretation of the non-BC LAA as BrC. While the non-BC LAA might also be dust, this would require that the dust concentrations co-vary strongly with biomass burning aerosol, a less plausible explanation than the interpretation of non-BC LAA as BrC.
The PMF model also found four sources as the optimal solution for the Canadian (2009) data set (with Qrobust∼1.4×Qtheoretical). These source profiles are shown in
5
Fig. 2b. (Note that 15 of the analytes are the same as in Fig. 2a; the rightmost analytes listed in the figure are different.) As with the 2008 data set, a factor/source that is clearly marine, with high loadings of Na, Cl, K and Mg is present. Also present is a “pollution” factor, as was the case in the 2008 data set. However, its component loading is somewhat different, now characterized by high loadings of sulfur species
10
as is normally expected for industrial pollution. On the other hand, while both Zn and Se, the major loadings on the 2008 pollution source, were not included in the analysis presented in Fig. 2b, sensitivity tests for other analyte suites are revealing. In the case of Zn, exclusion was due to far too many of the samples having concentration below the detection limit and nothing more could be done. For Se, the exclusion was simply due
15
to the fact that the overall variance reduction of the PMF model was degraded when Se was included in the analysis. Hence, with a slight penalty in variance reduction (Qincreases by 4%), the model was re-run with Se included, and 70% of the Se was found to be loaded on the pollution factor, a result in accord with the composition of the 2008 pollution factor.
20
As was the case for the 2008 data set, the remaining two sources from the PMF analysis, loaded heavily by either levoglucosan or vanillin, are clearly biomass burning sources. And, again as was the case with the 2008 data, the vanillin to levoglucosan ratio is quite different in the two source profiles, the two species being even more orthogonal than was the case with the 2008 data. We shall label these sources as we
25
ACPD
10, 13755–13796, 2010Sources of light-absorbing aerosol in arctic
snow
D. A. Hegg et al.
Title Page
Abstract Introduction
Conclusions References
Tables Figures
◭ ◮
◭ ◮
Back Close
Full Screen / Esc
Printer-friendly Version Interactive Discussion
Discussion
P
a
per
|
Dis
cussion
P
a
per
|
Discussion
P
a
per
|
Discussio
n
P
a
per
However, there is a noteworthy difference: whereas in 2008 boreal biomass burning contributed appreciably to the LAA, in the 2009 Canadian data set over 80% of the LAA is associated with crop and grass burning alone, the residual roughly equally distributed among the other factors. Finally, it is important to note that again there is no difference between the source allocation of LAA in general and BC, re-enforcing the
5
interpretation of the non-BC LAA as BrC. However, one complicating factor should be considered, at least briefly. Fe is also strongly loaded onto the crop and grass burning source profile in both the 2008 and 2009 data sets. Conceivably this is associated with light- absorbing iron oxides in soil dust, and part of the non-BC absorption could be due to this since such oxides have a similar spectral absorption signature to that of
10
BrC. Two considerations render this implausible. First, it is unlikely that soil dust would be so highly correlated with biomass burning that it could not be resolved from this source if it were present in any strength. Second, the quantity of Fe present is much too small to account for the non-BC component of the absorption. Using the procedure of Alfaro et al. (2004), and making the very liberal assumption that all of the Fe is in the
15
form of hematite (the most strongly absorbing Fe form), the average absorption of the Fe would be less than 2% of that due to BC for the 2009 data set and∼0.1% for the
2008 data set. We conclude that the observed non-BC absorption cannot be attributed to Fe.
Though the non-BC absorption is most plausibly due to BrC, because the sources of
20
the two LAA species are essentially identical and their resolution not well-established, we shall henceforth discuss the PMF results only in terms of LAA. Hence, the most noteworthy aspect of the LAA loadings shown in Figs. 2 and 3 is that∼90% of the LAA
ACPD
10, 13755–13796, 2010Sources of light-absorbing aerosol in arctic
snow
D. A. Hegg et al.
Title Page
Abstract Introduction
Conclusions References
Tables Figures
◭ ◮
◭ ◮
Back Close
Full Screen / Esc
Printer-friendly Version Interactive Discussion
Discussion
P
a
per
|
Dis
cussion
P
a
per
|
Discussion
P
a
per
|
Discussio
n
P
a
per
|
3.2 Source contributions to the sampling sites
3.2.1 Source contributions in 2008
With the source profiles in hand, the contribution of each source at each individual sam-pling site (receptor sites) can be calculated (cf., Hegg et al., 2009). The results of this calculation for the 2008 data set are shown in Fig. 3a. For clarity, rather than displaying
5
individual samples, we have grouped the results for the major sampling regions, i.e., all locations in the general vicinity of the indicated sites are averaged together. It is also important to note that source attributions through the snow profile are averaged together. Thus, what are shown are averages over the entire snow deposition season, rather than for the most recent month or so of snow deposition as was done in Hegg
10
et al. (2009). Note, however, that when the predicted PMF LAA concentrations for indi-vidual samples (i.e., the sum of the concentrations from each source) are compared to the actual LAA measurements on a sample by sample basis via linear regression, the R2value for the regression fit is 0.79 for the 2008 data set.
The most prominent characteristic of the source attribution is the site to site
variabil-15
ity. For Yakutsk and Tiksi, the most westerly of the Siberian sites (see Fig. 1), the LAA is mostly derived from biomass burning, and more specifically crop and grass burning. At the Cherskiy and Bilibino sites significantly to the east, on the other hand, the main sources of LAA are boreal burning, though the crop and grass burning component is still prominent. At Pevek, where most of the samples were actually taken on sea ice,
20
the main “source” was marine, and at both Greenland and the North Pole, pollution was the predominant source. However, at all three of the latter sites there was still a strong component due to crop and grass burning. The relatively strong pollution signal at the North Pole is similar to that observed in the 2007 data set, suggesting that the previous results were not anomalous in terms of the impact of pollution even though the
25
ACPD
10, 13755–13796, 2010Sources of light-absorbing aerosol in arctic
snow
D. A. Hegg et al.
Title Page
Abstract Introduction
Conclusions References
Tables Figures
◭ ◮
◭ ◮
Back Close
Full Screen / Esc
Printer-friendly Version Interactive Discussion
Discussion
P
a
per
|
Dis
cussion
P
a
per
|
Discussion
P
a
per
|
Discussio
n
P
a
per
we defer further discussion until then. For later comparison with the 2009 data set, we note that, averaged over the entire 2008 data set, the source percentage for crops and grass burning is 41%, for boreal burning 25%, for pollution 24% and 10% is associated with marine air.
When interpreting the significance of the relative source strengths shown in Fig. 3a,
5
it is important to take into account the differences in the absolute concentrations of LAA at each location. These are shown in Fig. 3b for the 2008 data set. The very low concentrations of LAA in snow at Pevek, Greenland and the North Pole compared to the other sites attenuate the role of pollution as compared to biomass burning as a source of LAA. Conversely, the relatively high mean concentrations at Yakutsk and Tiksi
10
(where crop and grass burning source dominated) as well as at Cherskiy and Bilibino (where the boreal biomass source dominated) suggest similar, substantial impacts for both boreal and crop and grass biomass burning. The differences in the geographic im-pact of the two different biomass burning sources are explicable in terms of differential transport and the location of biomass fires during the 2008 fire season.
15
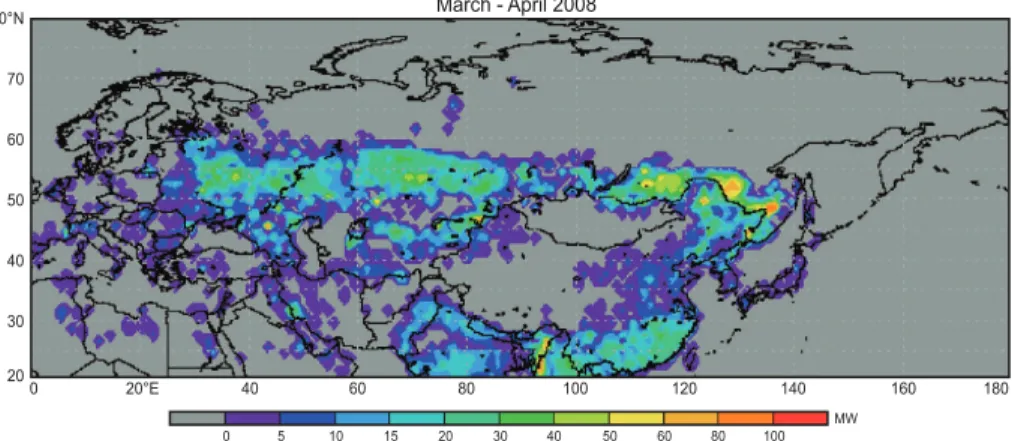
The location of biomass burning during the 2008 season is shown in Fig. 4. The image is from the NASA Giovanni web site (http://gdata1.sci.gsfc.nasa.gov/daac-bin/ G3/gui.cgi?instance id=neespi), which is based on Fire Imager data, and is for March– April, a fairly representative period for the east Siberian sampling sites and the peak of the spring fire season. We next utilize the HYSPLIT IV back-trajectory model to
quali-20
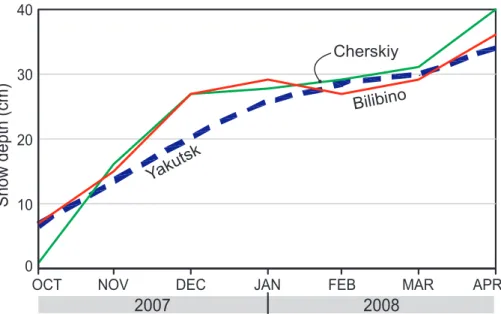
tatively assess the plausibility of transport of biomass burning products from these fire areas to our receptor sites. Such trajectories (isentropic, 10 day) were calculated ev-ery 6 h for a period from the snow sampling date back sufficiently far to encompass the bulk of the LAA in the snow pack. For this, snow-fall accumulation rates are necessary. Such rates are shown in Fig. 5 for the three east Siberian sites for which we could
ob-25
ACPD
10, 13755–13796, 2010Sources of light-absorbing aerosol in arctic
snow
D. A. Hegg et al.
Title Page
Abstract Introduction
Conclusions References
Tables Figures
◭ ◮
◭ ◮
Back Close
Full Screen / Esc
Printer-friendly Version Interactive Discussion
Discussion
P
a
per
|
Dis
cussion
P
a
per
|
Discussion
P
a
per
|
Discussio
n
P
a
per
|
snow accumulation rate is the same as those at Cherskiy and Bilibino. Trajectories for Yakutsk are shown in Fig. 6a, for Tiksi in Fig. 6b and for Cherskiy and Bilibino (they are sufficiently close that one analysis suffices) in Fig. 6c. The Yakutsk back trajecto-ries clearly intersect the fire area on numerous occasions to the south, the southeast and well to the west. Since these fires, particularly those to the west-southwest, are
5
largely agricultural, the PMF source contributions, dominated by crop and grass burn-ing, are readily explicable. Similarly, the Tiksi back trajectories (Fig. 6b) have a major component that extends well to the south, roughly following the Ob river valley, and penetrating deeply into the agricultural fire area. In contrast, the back trajectories for Cherskiy and Bilibino (Fig. 6c) are much more localized. There are indeed some that
10
also penetrate into the agricultural burning areas (as is reflected in an appreciable crop and grass burning source in the PMF profiles) but most are confined to the area north of this region. In early May, images from the Giovanni program do show some fires in this area, which must be largely boreal, but for the period encompassing the observed snow deposition we sampled, no such fires are evident. We suspect that the PMF
15
boreal burning source is due to local burning of fuel wood from boreal trees. Back trajectories for Pevek (not shown) are similarly localized and, to a greater degree than is the case for the other sites, are over the Arctic Ocean. Hence, overall, the back trajectory analysis is consistent with the PMF source attribution for the 2008 data set. 3.2.2 Source contributions in 2009
20
PMF analysis of the 2009 data set from the Canadian arctic yielded the source butions shown in Fig. 7a. All of the sampling sites are shown for which source contri-bution estimates could be made (21 of 24 sites). The excluded sites had concentration anomalies in key species sufficiently large to render PMF source attribution infeasible. For example, site 4 on the Parry Peninsula was a scant 100 km from the Smoking Hills,
25
a natural oil shale combustion site with very high sulfur emissions. The consequent very high reduced sulfur concentration at site 4 (∼70 000 ppbm) dominated that of all
ACPD
10, 13755–13796, 2010Sources of light-absorbing aerosol in arctic
snow
D. A. Hegg et al.
Title Page
Abstract Introduction
Conclusions References
Tables Figures
◭ ◮
◭ ◮
Back Close
Full Screen / Esc
Printer-friendly Version Interactive Discussion
Discussion
P
a
per
|
Dis
cussion
P
a
per
|
Discussion
P
a
per
|
Discussio
n
P
a
per
provided in Fig. 7 only for those sites that are further discussed on an individual basis. The source contributions are similar to those from the 2008 data set in the sense that biomass burning is the most important contributor to LAA in snow. Indeed, this is true to an even greater extent than for the 2008 data (Siberia, Greenland and the N. Pole), with only a few sites on or near to Little Cornwallis Island showing a significant impact
5
of pollution. However, a divergence is also evident in that crop and grass burning is now the overwhelming biomass source at nearly all stations. Indeed, averaged over all sampling sites, 75% of the LAA is attributable to crop and grass burning. Only at the sites near Inuvik (sites 1–3) does boreal burning have any significant impact.
These three are the only sites located within the boreal forest zone, all of the others
10
being north of the tree line and it is, as was the case with the Cherskiy and Bilibino sites in Siberia, conceivable that the appreciable but still secondarily important boreal biomass source at sites 1–3 is due to local wood burning for heat.
The mean LAA concentrations in the snow necessary to complement the source mass fractions in Fig. 7a are shown in Fig. 7b. There is substantial variation between
15
sites, but perhaps the most significant fact is revealed by comparison with the similar plot for the 2008 data set (Fig. 3b), which is dominated by the eastern Siberian sites. It is clear that the Siberian arctic snow has substantially higher LAA levels present than is the case for the Canadian arctic. Once again, we note that comparison of the PMF LAA predicted values for each sample to the corresponding direct measurement via
20
regression yields a high regressionR2value, in this case 0.83. 3.3 Seasonal variation in sources from depth profiles
To this point, the discussion has been in terms of depth-averaged profiles to assess the relative magnitudes of the sources over the entire deposition period. The results have supported our earlier finding as to the importance of biomass burning as a source of
25
ACPD
10, 13755–13796, 2010Sources of light-absorbing aerosol in arctic
snow
D. A. Hegg et al.
Title Page
Abstract Introduction
Conclusions References
Tables Figures
◭ ◮
◭ ◮
Back Close
Full Screen / Esc
Printer-friendly Version Interactive Discussion
Discussion
P
a
per
|
Dis
cussion
P
a
per
|
Discussion
P
a
per
|
Discussio
n
P
a
per
|
During the 2008 study, vertical profiles of LAA (from filters) were obtained at all Siberian sites but, for logistical reasons, melt water was saved from only a subset of the filter samples. Hence, for the 2008 data set, good depth profiles, though with variable depth resolution ranging from a few cm to ten’s of cm, were obtained only at Yakutsk, Cherskiy, Bilibino and Greenland. At the other locales, while some melt
5
water samples were taken at the surface and some at modest depths up to∼10 cm, no
systematic depth profiles were obtained. We therefore concentrate our discussion on profiles from these four locations.
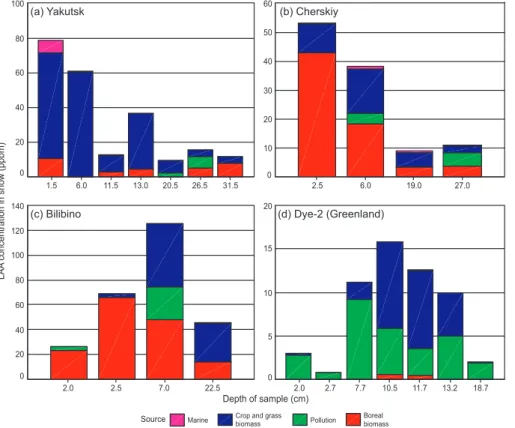
The source profile contributions as a function of sample depth for Yakutsk are shown in Fig. 8a. Note that the LAA concentrations are much higher near the surface,
cor-10
responding to roughly the last month of snow fall. This is characteristic of both this data set and the 2007 Siberian data set. This surface maximum is also noteworthy in that the dominant source of the LAA is crop and grass burning, as might be expected from the spring season maximum in such burning. Hence, the surface layer LAA, most important for albedo modulation (Flanner et al., 2007; Grenfell et al., 2002), is largely
15
biomass-burning derived. The other interesting feature of the depth profile is that pollu-tion starts to play a role at∼20–27 cm depth, corresponding to snow deposition during
the previous October–November period (see Fig. 5).
The Cherskiy depth profile, shown in Fig. 8b, also displays a surface maximum in the LAA concentration, once again corresponding to about one month of snow deposition.
20
This peak is also due to biomass burning though in this case it is boreal burning that is the major source. There is also a minor but significant pollution source present in early March and then a more substantial pollution component in November of the previous year, as was the case at Yakutsk. The Bilibino profile, shown in Fig. 8c, differs somewhat from the previous two in that it does not have a surface maximum in LAA.
25
ACPD
10, 13755–13796, 2010Sources of light-absorbing aerosol in arctic
snow
D. A. Hegg et al.
Title Page
Abstract Introduction
Conclusions References
Tables Figures
◭ ◮
◭ ◮
Back Close
Full Screen / Esc
Printer-friendly Version Interactive Discussion
Discussion
P
a
per
|
Dis
cussion
P
a
per
|
Discussion
P
a
per
|
Discussio
n
P
a
per
found in the Cherskiy profile is echoed here at 7 cm depth. Unfortunately, the depth profile does not go sufficiently deep to reveal whether the previous fall pollution source found in the other profiles is also present here.
The final depth profile available in the 2008 data is from Greenland (Fig. 8d). The peak in LAA occurs at a depth of 10.5 cm and is associated primarily with crop and
5
grass burning, in agreement with both our previous analysis of 2007 data (Hegg et al., 2009) and with the study of McConnell et al. (2007), who found that much of the BC in the Greenland ice cap was derived from biomass burning. Approximate timing of deposition was inferred from the snow depth time series of the Greenland Climate Network (Steffen et al., 1996). While the peak is somewhat deeper than expected given
10
the springtime maximum in biomass burning emissions, this may simply be due to the fact that, unlike the eastern Siberian sampling, sampling at this site was done in late July. Outside of the spring burning interval, the source of LAA in the snow is primarily pollution and, perhaps most tellingly, the surface LAA for this site is largely due to pollution, the snow containing it freshly fallen a few days prior to sampling. For typical
15
snow grain size and LAA loading, the e-folding depth for radiative flux in the visible is on the order of 10 cm. Hence, for this particular site, it is pollution that might be expected to most influence the snow albedo during the summer. However, the interpretation of this profile is more complex than is at first apparent.
Unlike the other sites in this study, the Dye-2 site, in part due to the time of year
20
during which sampling took place, was subject to snow melting (according to reports of the station managers there) and possibly sublimation (e.g., Liston and Sturm, 2004). These post-depositional processes could possibly have altered the depth profiles of the aerosol species in the snow. The most straightforward such alteration would be the accumulation of LAA, assumed to be largely hydrophobic, near the surface as the
25
ACPD
10, 13755–13796, 2010Sources of light-absorbing aerosol in arctic
snow
D. A. Hegg et al.
Title Page
Abstract Introduction
Conclusions References
Tables Figures
◭ ◮
◭ ◮
Back Close
Full Screen / Esc
Printer-friendly Version Interactive Discussion
Discussion
P
a
per
|
Dis
cussion
P
a
per
|
Discussion
P
a
per
|
Discussio
n
P
a
per
|
downward from the LAA maximum. Furthermore, there is a slight secondary nitrate maximum co-incident with the possibly displaced sulfate peak. On the other hand the absolute nitrate maximum is not displaced downward from the LAA peak, there is a strong secondary sulfate peak coincident with the LAA peak, and oxalate (not shown) is also not displaced downward from the LAA peak. In the case of nitrate, it is
5
conceivable that a number of post-depositional processes, including photochemistry, are taking place (e.g., Burkhart et al., 2009) but this is unlikely for oxalate or sulfate. Also, the Dye-2 site is a moderate snow accumulation site (∼350 kg m−2a−1) where
such post-depositional processes are not well established. Since both sulfate and nitrate are major components of the crop and grass biomass source, what the profiles
10
in Fig. 9 do show is that the association of much of the LAA at this site with crop and grass burning is quite plausible. Nevertheless, the uncertainty associated with this profile is substantially higher than is the case for the others examined in this study.
For the 2009 data set from the Canadian Arctic, the number of profiles available (source depth profiles could be calculated for 19 of the 24 sites) renders discussion of
15
individual profiles unwieldy. Discussion of a mean profile for all of the sites is also not meaningful, due largely to the diverse total depths of the profiles and the non-uniform sampling depths between profiles. Hence, we discuss the entire set of profiles essen-tially statistically, reserving detailed discussion of individual profiles to a few cases of special interest. First, as implied by the average source contributions for each of the
20
sites shown in Fig. 7a, crop and grass burning dominates the depth profiles, with this source contributing greater than 50% of the total LAA concentration in 86% of the sam-ples inclusive over all depths. Furthermore, in only four instances was the peak LAA concentration in the profile dominated by anything other than crop and grass burning (pollution twice and marine and boreal burning one each).
25
ACPD
10, 13755–13796, 2010Sources of light-absorbing aerosol in arctic
snow
D. A. Hegg et al.
Title Page
Abstract Introduction
Conclusions References
Tables Figures
◭ ◮
◭ ◮
Back Close
Full Screen / Esc
Printer-friendly Version Interactive Discussion
Discussion
P
a
per
|
Dis
cussion
P
a
per
|
Discussion
P
a
per
|
Discussio
n
P
a
per
means due to the large influence of a few outlying values at locations with unusually deep profiles). For pollution the median was 8, for marine it was 12 and for boreal burning 19 cm. Hence, not only was the crop and grass burning source the dominant source of LAA, the LAA from this source was relatively favorably located in the snow pack for radiative impact. As in the 2008 data set, the pollution source (though less
5
important than in the 2008 data) was of more importance earlier in the year than the dominant biomass-burning source.
A few of the sites in the 2009 data set had PMF source contributions that differed significantly from the broad average picture just presented and can profitably be exam-ined further. For example, sites 1–3 near Inuvik were the only locations to display a
10
prominent boreal biomass source signature. Similarly, the sites on or near Little Corn-wallis Is. had a strong pollution component to the LAA, and we have selected a profile from one of these sites (site 21) for discussion. For comparison, we also discuss a more typical profile from Walker Lake (site 13, 67◦N, 91◦W).
The depth profile for the Inuvik site is shown in Fig. 10a. A clear differentiation in
15
the source character is seen with depth, the LAA from the top 16 cm being almost solely due to crop and grass burning whereas at 23.5 cm and below, boreal burning is the most important source, but with pollution and marine sources also contributing significantly. Presumably this marked difference in sources is due to differences in either transport or relative source strengths, or both. To assess this, we must first
20
translate the depths shown in Fig. 10a to dates. For this, snow depths as a function of time are necessary and are shown in Fig. 11 for the three sampling locations that will be discussed. From the plots, it is clear that the transition in source impact at∼20 cm depth
at Inuvik corresponds to∼November 2008. MODIS Fire Imager data from the Giovanni
website show fires during October and November that are likely boreal in nature. This
25
ACPD
10, 13755–13796, 2010Sources of light-absorbing aerosol in arctic
snow
D. A. Hegg et al.
Title Page
Abstract Introduction
Conclusions References
Tables Figures
◭ ◮
◭ ◮
Back Close
Full Screen / Esc
Printer-friendly Version Interactive Discussion
Discussion
P
a
per
|
Dis
cussion
P
a
per
|
Discussion
P
a
per
|
Discussio
n
P
a
per
|
North America as well. The seasonal change can be seen by comparing Fig. 4, which gives the geographic distribution of Eurasian fires in the spring with Fig. 12, which gives the fires for the fall of 2008, the period during which the boreal source is strong in the Inuvik depth profile. Fires in the fall are present appreciably to the north of those in the spring period, and are situated in boreal forest rather than crop lands.
5
The issue of differential transport between the two periods is more difficult to address. Several studies have suggested that major sources of aerosols, and particularly BC, observed over the Canadian arctic and Alaska in the spring are in Eurasia (Sharma et al., 2006; Warneke et al., 2009). The long transport distance this implies necessitates quite long back trajectories, but in the Arctic such long trajectories can be somewhat
10
problematic (cf. Hegg et al., 2009). We have used 10-day back trajectories in this study, a compromise between uncertainty in precision and necessity of length. Such back trajectories from Inuvik for the autumn period of 2008 are shown in Fig. 13a. A small but significant number of the trajectories do in fact reach the boreal fire area shown in Fig. 12. For comparison, back trajectories from Inuvik in the spring of 2009 are shown
15
in Fig. 13b. While most of the trajectories shown are confined to the Canadian arctic itself, some do in fact reach the spring biomass burning areas of Eurasia, which are largely crop and grass burning. Quite possibly, with longer back trajectories more would have done so. Additionally, a number of the trajectories reach nearly to the Canadian-US border, particularly above the mid-west of the Canadian-US This region also had significant
20
crop biomass burning during the spring period (not shown). Hence, overall, the PMF source changes shown in the depth profile for Inuvik are consistent with differences in source strengths and differential transport over the deposition period.
In contrast to the Inuvik site, the depth profile for Walker Lake (site 13) is uniformly dominated by crop and grass burning (Fig. 10b). This is more typical of the 2009
25
ACPD
10, 13755–13796, 2010Sources of light-absorbing aerosol in arctic
snow
D. A. Hegg et al.
Title Page
Abstract Introduction
Conclusions References
Tables Figures
◭ ◮
◭ ◮
Back Close
Full Screen / Esc
Printer-friendly Version Interactive Discussion
Discussion
P
a
per
|
Dis
cussion
P
a
per
|
Discussion
P
a
per
|
Discussio
n
P
a
per
the autumn of the previous year. During this period, the MODIS/ Giovanni program shows a large cluster of fires in late October associated with fall crop burning in the mid-west of the US and Canada, analogous to that just discussed for the spring of 2009 (see Fig. 14). Also analogous to the spring season, back trajectories for this site (Fig. 13c) show significant transport from this area to the Walker Lake site, suggesting
5
that North American fire emissions can have, at least occasionally, some impact on LAA deposition in the Canadian Arctic.
The last profile to discuss is that from the site (21) on Little Cornwallis Island. This profile is shown in Fig. 10c and was one of the few sites to show pollution as the domi-nant source at any depth. This dominance occurs at a depth of 4.5 cm and corresponds
10
(see Fig. 11) to deposition during roughly early March. However, back trajectories for April as compared to March show very little difference, and in neither case do they encompass major known pollution sources, in accord with the relatively modest LAA levels at all depths. We speculate that the variations seen in the profile are due to local variations in sources, perhaps associated with the extensive tailings from the defunct
15
Polaris lead and zinc mine located ∼25 km to the southwest. For such a short
dis-tance, even dry deposition of aerosol resuspended to a few meters height is feasible as a source.
4 Conclusions
Based on the PMF analysis of sources of LAA for data sets from both 2008 and 2009,
20
the dominant source of LAA in the arctic snow pack appears to be biomass burning, in accord with our earlier analysis (Hegg et al., 2009). Several additional pieces of information are suggested by the current analysis. First, an additional biomass marker species included in the analysis (vanillin) has permitted a reasonably credible separa-tion of the biomass source into one attributable to crop and grass burning and one to
25
ACPD
10, 13755–13796, 2010Sources of light-absorbing aerosol in arctic
snow
D. A. Hegg et al.
Title Page
Abstract Introduction
Conclusions References
Tables Figures
◭ ◮
◭ ◮
Back Close
Full Screen / Esc
Printer-friendly Version Interactive Discussion
Discussion
P
a
per
|
Dis
cussion
P
a
per
|
Discussion
P
a
per
|
Discussio
n
P
a
per
|
this is less the case though the crop and grass burning source is still the more im-portant. Interpretation of the spectral absorption of the LAA has permitted a tentative resolution of the LAA into a BC and non-BC component. The two species have similar source profiles, associated almost exclusively with the biomass factors. This in itself suggests that the non-BC LAA is in fact “brown carbon”, a constituent widely assumed
5
to be most prevalent in biomass emissions, rather than soil dust. Source contribu-tions as a function of sampling location show considerable variance in the 2008 data set, the variance being interpretable in terms of different source locations and trans-port trajectories. Less geographic variance is shown in the 2009 data set from the Canadian Arctic, but the few anomalous sites are still plausibly explicable in terms of
10
varying source strengths and transport. Finally, in both the 2008 and 2009 data sets, the depth profiles acquired permit an assessment of the seasonality of the relative source strengths. Both data sets show the biomass burning to peak in importance in the spring, in accordance with expectations from previous work. Pollution appears to be of most importance during the late fall and winter, and in Greenland during the
15
summer, but rarely dominates the source contribution to snow LAA.
Acknowledgements. We thank Sergei Zimov, Galina Zimov, and Vladimir Radionov for
provid-ing snowfall and snow depth data at Siberian sites, and Konrad Steffen and coworkers for the snow accumulation time series at Dye-2 in Greenland. Richard Brandt provided analyses of the Dye-2 time series. James Morison, Michael Steele, and Konrad Steffen collected some
20
of the snow samples used in this study. We thank Tim Larson for many useful conversations and comments on the manuscript and Ron Sletten for running the ICP analysis. Back trajec-tories used in this study were calculated with HYSPLIT-IV (HYbrid Single-Particle Lagrangian Integrated Trajectory) Model, 1997. Web address: http://www.arl.noaa.gov/ready/hysplit4.html, NOAA Air Resources Laboratory, Silver Spring, MD. The research was supported by the Clean
25
ACPD
10, 13755–13796, 2010Sources of light-absorbing aerosol in arctic
snow
D. A. Hegg et al.
Title Page
Abstract Introduction
Conclusions References
Tables Figures
◭ ◮
◭ ◮
Back Close
Full Screen / Esc
Printer-friendly Version Interactive Discussion
Discussion
P
a
per
|
Dis
cussion
P
a
per
|
Discussion
P
a
per
|
Discussio
n
P
a
per
References
Alfaro, S. C., Lafon, S., Rajot, J. L., Formenti, P., Gaudichet, A., and Maille, M.: Iron oxides and light absorption by pure desert dust: an experimental study, J. Geophys. Res., 109, D08208, doi:1029/2003JD004374, 2004.
Burkhart, J. F., Bales, R. C., McConnell, J. R., Hutterli, M. A., and Frey, M.: Geographic
variabil-5
ity of nitrate deposition and preservation over the Greenland Ice Sheet, J. Geophys. Res., 114, D06301, doi:10.1029/2008JD010600, 2009.
Clarke, A. D. and Noone, K. J.: Soot in the Arctic snowpack: A cause for perturbations in radiative transfer, Atmos. Environ., 19, 2045–2053, 1985.
Chylek, P., Johnson, B., and Wu, H.: Black carbon concentration in a Greenland Dye-3 ice core,
10
Geophys. Res. Lett., 19, 1951–1953, 1992.
Doherty, S. J, Warren, S. G., Grenfell, T. C., Brandt, R. E., and Clarke, A. D.: Light-absorbing impurities in Arctic snow, Atmos. Chem. Phys. Discuss., in preparation, 2010.
Eleftheriadis, K., Vratolis, S., and Nyeki, S.: Aerosol black carbon in the European Arctic: Measurements at Zeppelin station, Ny-Alesund, Svalbard from 1998–2007, Geophys. Res.
15
Lett., 36, L02809, doi:10.1029/2008GL035741, 2009.
Favez, O., Alfaro, S. C., Sciare, J., Cachier, H., and Abdelwahab, M. M.: Ambient measure-ments of light-absorption by agricultural waste burning organic aerosols, Aerosol Sci., 40, 613–620, 2009a.
Favez, O., Cachier, H., Sciare, J., Sarda-Esteve, R., and Martinon, L.: Evidence for a significant
20
contribution of wood burning aerosols to PM2.5 during winter season in Paris, France, Atmos. Environ., 43, 3640–3644, 2009b.
Flanner, M. G., Zender, C. S., Randerson, J. T., and Rasch, P. J.: Present-day cli-mate forcing and response from black carbon in snow, J. Geophys. Res., 112, D11202, doi:1029/2006JD008003, 2007.
25
Generoso, S., Bey, I., Attie, J.-L., and Breon, F.-M.: A satellite- and model-based assessment of the 2003 Russian fires: impact on the Arctic region, J. Geophys. Res., 112, D15302, doi:10.1029/2006JD008344, 2007.
Grenfell, T. C., Doherty, S. J., Clarke, A. D., and Warren, S. G.: Light absorption from particulate impurities in snow and ice determined by spectrophotometric analysis of filters, Appl. Optics,
30
submitted, 2010.
ACPD
10, 13755–13796, 2010Sources of light-absorbing aerosol in arctic
snow
D. A. Hegg et al.
Title Page
Abstract Introduction
Conclusions References
Tables Figures
◭ ◮
◭ ◮
Back Close
Full Screen / Esc
Printer-friendly Version Interactive Discussion
Discussion
P
a
per
|
Dis
cussion
P
a
per
|
Discussion
P
a
per
|
Discussio
n
P
a
per
|
soot in the snow and sea ice during the SHEBA experiment, J. Geophys. Res., 107, doi:10.1029/2000JC000414, 2002.
Hagler, G. S. W., Bergin, M. H., Smith, E. A., and Dibb, J. E.: A summer time series of par-ticulate carbon in the air and snow at Summit, Greenland, J. Geophys. Res., 112, D21309, doi:10.1029/2007JD008993, 2007.
5
Hansen, J. and Nazarenko, L.: Soot climate forcing via snow and ice albedos, Proc. Nat. Acad. Sci. (USA), 101, 423–428, 2004.
Hays, M. D., Fine, P. M., Geron, C. D, Kleeman, M. J., and Gullet, B. K.: Open burning of agricultural biomass: physical and chemical properties of particle-phase emissions, Atmos. Environ., 39, 6747–6764, 2005.
10
Hegg, D. A., Warren, S. G., Grenfell, T. C., Doherty, S. J., Larson, T. V., and Clarke, A. D.: Source attribution of black carbon in arctic snow, Environ. Sci. Technol., 43, 4016–4021, 2009.
Hobbs, P. V. and Rangno, A. L.: Microstructures of low and middle-level clouds over the Beafort Sea, Q. J. Roy. Meteorol. Soc., 124, 2035–2071, 1998.
15
Liston, G. E. and Sturm, M.: The role of winter sublimation in the Arctic moisture budget, Nordic Hydrology, 35, 325–334, 2004.
Luk ´acs, H., Gelencs ´er, A., Hammer, S., Puxbaum, H., Pio, C., Legrand, M., Kasper-Giebl, A., Handler, M., Limbeck, A., Simpson, D., and Preunkert, S.: Seasonal trends and possible sources of brown carbon based on 2-year aerosol measurements at six sites in Europe, J.
20
Geophys. Res., 112, D23S18, doi:10.1029/2006JD008151, 2007.
Luo, Y., Xu, K.-M., Morrison, H., McFarquhar, G., Wang, Z., and Zhang, G.: Multi-layer arctic mixed-phase clouds simulated by a cloud-resolving model: Comparison with ARM observations and sensitivity experiments, J. Geophys. Res., 113, D12208, doi:10.1029/2007JD009563, 2008.
25
Masclet, P., Hoyau, V., Jaffrezo, J., and Cachier, H.: Polycyclic aromatic hydrocarbon deposition on the ice sheet of Greenland. Part 1: superficial snow, Atmos. Environ., 34, 3195–3207, 2000.
McConnell, J. R., Edwards, R., Kok, G. L., Flanner, M. G., Zender, C. S., Saltzman, E. S., Banta, J. R., Pasteris, D. R., Carter, M. M., and Kahl, J. D. W.: 20th-Century industrial black
30
carbon emissions altered arctic climate forcing, Science, 317, 1381–1384, 2007.
ACPD
10, 13755–13796, 2010Sources of light-absorbing aerosol in arctic
snow
D. A. Hegg et al.
Title Page
Abstract Introduction
Conclusions References
Tables Figures
◭ ◮
◭ ◮
Back Close
Full Screen / Esc
Printer-friendly Version Interactive Discussion
Discussion
P
a
per
|
Dis
cussion
P
a
per
|
Discussion
P
a
per
|
Discussio
n
P
a
per
Morrison, H., Curry, J. A., Shupe, M. D., and Zuidema, P.: A new double-moment microphysics parameterization for application in cloud and climate models. Part II: Single-column modeling of Arctic clouds, J. Atmos. Sci., 62, 1678–1693, 2005.
Oros, D. R., Radzi bin Abas, M., Omar, N. Y. M. J., Rahman, N. A., and Simoneit, B. R. T.: Identification and emission factors of molecular tracers in organic aerosols from biomass
5
burning. Part 3. Grasses, Appl. Geochem., 21, 919–940, 2006.
Oros, D. R. and Simoneit, B. R. T.: Identification and emission factors of molecular tracers in organic aerosols from biomass burning. Part 1. Temperate climate conifers, Appl. Geochem., 16, 1513–1544, 2001a.
Oros, D. R. and Simoneit, B. R. T.: Identification and emission factors of molecular tracers
10
in organic aerosols from biomass burning. Part 2. Deciduous trees, Appl. Geochem., 16, 1545–1565, 2001b.
Paatero, P. and Tapper, U.: Positive matrix factorization: a non-negative factor model with optimal utilization of error estimates of data values, Environmetrics, 5, 111–126, 1994. Perovich, D. K., Grenfell, T. C., Light B., Elder, B. C., Harbeck, J., Polashenski, C., Tucker III, W.
15
B., and Stelmach, C.: Transpolar observations of morphological properties of Arctic sea ice, J. Geophys. Res., 114, C00A04, doi:10.1029/2008JC004892, 2009.
Polissar, A., Hopke, P., Malm, W., and Sisler, J.: Atmospheric aerosol over Alaska 1. Elemental composition and sources, J. Geophys. Res., 103, 19045–19057,1998.
Quinn, P. K., Shaw, G., Andrews, E., Dutton, E. G., Ruoho-Airola, T., and Gong, S. L.: Arctic
20
haze: current trends and knowledge gaps, Tellus, 59B, 99–114, 2007.
Rahn, K. A., Lewis, N. F., Lowenthal, D. H., and Smith, D. L.: Noril’sk only a minor contributor to Arctic haze, Nature, 306, 459–461, 1983.
Ramanathan, V. and Carmichael, G.: Global and regional climate change due to black carbon, Nature Geosci., 1, 221–227, 2008.
25
Sharma, S., Andrews, E., Barrie, L., Ogren, J., and Lavoue, D.: Variations and sources of equivalent black carbon in the high Arctic revealed by long-term observations at Alert and Barrow: 1989–2003, J. Geophys. Res., 111, D14208, doi:10.1029/2005JD006581, 2006. Shindell, D. and Faluvegi, G.: Climate response to regional radiative forcing during the twentieth
century, Nature Geosci., 2, 294–300, doi:10.1038/NGEO473, 2009.
30
Simoneit, B. R. T.: Biomass burning a review of organic tracers for smoke from incomplete combustion, Appl. Geochem., 17, 129–162, 2002.
ACPD
10, 13755–13796, 2010Sources of light-absorbing aerosol in arctic
snow
D. A. Hegg et al.
Title Page
Abstract Introduction
Conclusions References
Tables Figures
◭ ◮
◭ ◮
Back Close
Full Screen / Esc
Printer-friendly Version Interactive Discussion
Discussion
P
a
per
|
Dis
cussion
P
a
per
|
Discussion
P
a
per
|
Discussio
n
P
a
per
|
Sheets and Volcanoes, CRREL Special Report 96-27, pp. 98-103, edited by: Colbeck, S. C., US Army Cold Regions Research and Engineering laboratory, Hanover, NH, USA, 1996. Stohl, A.: Characteristics of atmospheric transport into the arctic troposphere, J. Geophys.
Res., 111, D11306, doi:10.1029/2005JD006888, 2006.
Stohl, A., Andrews, E., Burkhart, J. F., et al.: Pan-arctic enhancements of light absorbing
5
aerosol concentrations due to North American boreal forest fires during summer 2004, J. Geophys. Res., 111, D22214, doi:10.1029/2006JD007216, 2006.
Toledano, C., Cachorro, V. E., de Frutos, A. M., Torres, B., Berjon, A., Sorribas, M., and Stone, R. S.: Airmass classification and analysis of aerosol types at El Arenosillo (Spain), J. Appl. Meteor. Climat., 48, 962–981, 2009.
10
Treffeisen, R., Herber, A., Strom, J., Shiobara, M., Yamanouchi, T., Yamagata, S., Holmen, K., Kriews, M., and Schrems, O.: Interpretation of Arctic aerosol properties using cluster analysis applied to observations from the Svalbard area, Tellus, 56B, 457–476, 2004. Warneke, C., Bahreini, R., Brioude, J., et al.: Biomass burning in Siberia and Kazakhstan as
an important source for haze over the Alaskan Arctic in April, 2008, Geophys. Res. Lett., 36,
15
L02813, doi:10.1029/2008GL036194, 2009.