Universidade de Lisboa
Faculdade de Ciências
Departamento de Biologia Animal
Development of an Ethologically-Relevant Chronic
Stress Model of Depression: Behavioral Effects in
C57BL/6 Mice
Ana Margarida Araújo Correia
Mestrado em Biologia Humana e Ambiente
2010
Universidade de Lisboa
Faculdade de Ciências
Departamento de Biologia Animal
Maastricht University
Faculty of Health, Medicine and Life Sciences
Department of /eurosciences
Development of an Ethologically-Relevant Chronic
Stress Model of Depression: Behavioral Effects in
C57BL/6 Mice
Ana Margarida Araújo Correia
Orientador interno: Dr. Tatyana Strekalova (Centro de Biologia Ambiental, Faculdade de Ciências, Universidade de Lisboa)
Orientador externo: Dr. Jodi Pawluski (Department of /euroscience, Maastricht University)
Mestrado em Biologia Humana e Ambiente 2010
i
ACK/OWLEDGME/TS
I would like to thank everyone that contributed to make this thesis possible:
Dr. Tatyana Strekalova, for giving me the opportunity to do my master thesis in Maastricht University, and for all the help, support and advice throughout the writing of this work. Also, for the FELASA B practical course, which allowed my in vivo work.
Dr. Jodi Pawluski, for accepting the co-orientation of this thesis, and for always being available to help, either with writing or statistics, advise or only to talk. Thank you for your guidance and friendship along the way.
Professor Harry Steinbusch, for welcoming me in his Department of Neurosciences, and for all the support and advise.
The organizations and people without whom my work wouldn’t be possible: International Stichting Alzheimer Onderzoek (ISAO), The Netherlands, grant N 09501 to Dr Tatyana Strekalova; Buddha Biopharm, Finland; FCT and CBA; Dr. Martti Vallila, Professor Deodália Dias, Dr. Cláudia Oliveira, Professor Margarida Reis and Professor Ana Isabel Santos, Luís Marques and Raquel Vaz.
Andie… without whom I would have spent 6 months eating sandwiches and cereal! My roommate, my friend… my psychologist! From snowy Kerkrade to warm and sunny Sicily, together we conquered all! Through tough and great times, Maastricht wouldn’t have been the same without you. Thank you for helping me be a stronger and more optimistic person (even if it sometimes required yelling!). Together we faced every obstacle and grew stronger and wiser from that. Let this be just one of many adventures to come! And to Dona Cristina, for being another shoulder to cry on, even when Andreia yelled me to filter information!
Julie and Xangue, whom besides all the help in my work, made Maastricht worthwhile! Julie, my favorite Belgian girl! Our first friend in foreign lands with whom we spent great and fun times. Thank you for always having a kind work! Xangue, for never letting me forget
ii
great moments with ‘kaleidoscopic bubbles’ and for always being supportive and fun to be around!Rodrigo, who had the unique talent for making me laugh even when I was insanely mad at him! “She comes in colors everywhere, she combs her hair. She’s like a rainbow”!
Marisela, for always being available to help, whether when a lab problem appeared or even with my exam. For all her friendship, support and awesome cooking skills. Thanks for the great Mexican dinner!
Bianca, Marta and Edgar, the three bonuses Andie brought into my life! You helped on making Maastricht memorable! Waffles, crazy bike rides, more waffles, giant pliers… you’re the best!
Josie, honey! For your endless patience to answer my sicko e-mails! Thank you for all the love and support. You’re another bonus from BHA!
Bruno, for all the love and patience, and for all the times you’ve been there for me, to help me get back on my feet whenever I fell and wanted to give up. You make me a stronger and better person. You are my better half and my own personal sun. Amo-te… more than all the words in this “book”.
Mom and Dad, with all my love, thank you for everything. Thank you for all your love, all your support and for always standing by my side, helping me to achieve my dreams. You give me strength and courage to face every setback and are always there when it’s time to laugh and in all great moments. Love you, you’re the best parents in the world!
iii
ABSTRACT
It is known that the application of a 4-week chronic stress in C57BL/6 mice leads to the development of anhedonia, a core symptom of depression, assessed by the decrease in sucrose intake and preference. The chronic stress paradigm also leads to locomotor changes, anxiety-like behavior and impairment in memory and learning.
The aim of this project was to study the effects of the application of a shorter chronic stress (2 weeks), consisting only of ethological stressors on hedonic status, anxiety-like behavior, locomotion and hippocampus-dependent performance, in C57BL/6 mice.
In study 1, animals’ daily water drinking patterns were evaluated in order to optimize a sucrose test. In study 2, mice were divided into control and stress groups, based on baseline body weight, sucrose test data and social status. Mice from stress group were then submitted to chronic stress, consisting of rat exposure over-night and social defeat using CD1 male mice. After the chronic stress procedure, body weight, hedonic status in the sucrose test, anxiety-like behavior in the elevated O-maze test, open-field activity at different times of the day cycle, and hippocampus-dependent performance in the food-displacement tube test and in the contextual fear-conditioning paradigm, were assessed.
Mice showed, in study 1, a large variability in patterns of water consumption, suggesting the application of a sucrose test of longer duration. In study 2, stressed mice showed no significant decrease in sucrose preference, but they presented an increased water intake, which is regarded as a sign of stress. They also showed significant reduction in weight, compared to control mice, and significant anxiolytic-like changes both in O-maze and open-field tests. In addition, stressed mice spent less time freezing in the fear conditioning paradigm than control mice, showing impairment in hippocampus-dependent performance. We did not see significant differences between groups in the food-displacement tube test, however a positive correlation was found between freezing behavior and number of pellets taken from the tube.
Together, our data suggests that applied here 2-week ethological stress induced a depressive-like phenotype and had signs of physiological impact in C57BL/6. However, more studies are required to validate this model.
Keywords: depression, stress, mice, chronic stress procedure, anhedonia,
iv
RESUMO
A depressão é uma doença grave, que provoca risco de vida. De acordo com a Associação Psiquiátrica Americana (Manual Estatístico e de Diagnóstico de Doenças Mentais, DSM-IV, 1994), uma pessoa diagnosticada com depressão deve apresentar, juntamente com humor disfórico e perda de interesse ou prazer em quase todas as actividades, ou seja anedonia, pelo menos 4 sintomas adicionais, entre os quais agitação ou retardo psicomotor, perda marcada de peso, perturbações de sono, diminuição de apetite, sentimentos de culpa ou ideação suicida, durante um período de pelo menos 2 semanas.
Vários modelos animais são usados, usando roedores, para mimetizar esta doença, os quais se baseiam na aplicação de stressores aos animais, de modo a induzir características típicas de depressão e, assim, possibilitar o estudo em laboratório desta síndrome.
Estudos prévios mostram que a aplicação de stress crónico durante longos períodos de tempo induz, em murganhos C57BL/6, uma síndrome típica de depressão e anedonia, um sintoma chave da depressão, avaliado pela diminuição no consumo e preferência por uma solução de sucrose. Este paradigma conduz, ainda, a alterações na locomoção, no comportamento típico de ansiedade e a danos na memória e aprendizagem.
No entanto, por motivos éticos, esforços têm sido efectuados no sentido de diminuir a carga de stress e desconforto em animais de laboratório. O objectivo deste projecto foi, então, estudar os efeitos da aplicação de um stress crónico de menor duração (2 semanas), limitando-nos à utilização de stressores etológicos (naturais), no estado hedónico, comportamento típico de ansiedade, locomoção e desempenho dependente do hipocampo, em murganhos C57BL/6. O estudo 1 consistiu na avaliação dos padrões diários de consumo de água de 23 animais durante 3 dias consecutivos, de modo a optimizar o teste de sucrose. Foram analisados tanto os seus valores totais de consumo de água, como os picos diários no consumo. No estudo 2, 32 murganhos C57BL/6 foram divididos em 2 grupos, controlo (n = 10) e stress (n = 22), usando como parâmetros o seu peso corporal base, os dados de um teste de sucrose (preferência pela solução de sucrose, consumo de água e de sucrose, e consumo total de líquidos) e o seu status social (agressivo, submisso ou neutro). Os animais do grupo stress foram, posteriormente, submetidos ao procedimento de stress crónico, durante 2 semanas, que consistiu na exposição a ratos durante a fase nocturna do seu ciclo diário, e derrota social, com exposição a murganhos machos CD1, duas vezes por dia.
v
Relativamente ao estudo 1, verificou-se que a quantidade de líquido consumida variou significativamente ao longo dos 3 dias de teste. O volume de água consumido decresceu do dia 1 para o dia 2, e deste para o dia 3. Este decréscimo pode ser explicado por dois motivos: flutuações na temperatura, visto que ocorre uma diminuição no consumo de água quando a temperatura diminui, ou preferência dos animais por água fresca. Verificou-se, ainda, a existência de 4 picos de consumo em murganhos C57BL/6: +2,5h, +5h, +7,5h e +10h, após o inicio do teste. Os animais, em geral, não mantêm o mesmo pico no consumo de dia para dia. Estes dados evidenciam uma grande variabilidade na dinâmica diária de consumo de líquidos nestes animais, ressalvando a importância da utilização de testes de maior duração, quando se pretendam avaliar consumo de líquidos. Assim, escolhemos aplicar os testes de sucrose durante 24h, de modo a evitar o uso de protocolos de duração menor que podem ser erróneos. Quanto ao estudo 2, após exposição a stress crónico, os seguintes parâmetros foram avaliados nos murganhos: peso corporal, estado hedónico no teste de sucrose, comportamento típico de ansiedade no teste 0-maze elevado, actividade em open-field a diferentes alturas do ciclo diário, e desempenho dependente do hipocampo no teste de deslocamento de comida de um tubo e no paradigma de condicionamento de medo contextual.Após a aplicação de stress crónico, embora tenhamos visto sinais de stress pelo aumento no consumo de água nos animais submetidos ao mesmo, ambos os grupos de animais não demonstraram uma preferência por sucrose em vez de água. Estes resultados demonstram a presença de resultados anormais neste parâmetro no grupo controlo. Este comportamento anormal pode dever-se a falhas no teste de sucrose e não no procedimento de stress em si. Por razões técnicas, não nos foi possível repetir este teste, o que nos deixa na incógnita quanto ao desenvolvimento ou não de anedonia. Contudo, tudo isto sugere que o nosso procedimento de curta duração e intensidade não conduziu a mudanças detectáveis no estado anedónico dos murganhos. A indução de anedonia pode, assim, necessitar de uma determinada carga de stress, que não foi alcançada com este modelo.
Observou-se, ainda, um efeito do stress no peso corporal, sendo que os murganhos submetidos a stress sofreram uma redução significativa no peso corporal, quando comparados com os murganhos controlo.
Relativamente ao teste de 0-maze, os murganhos stressados demoraram menos tempo a sair das áreas fechadas do aparelho para as áreas associadas a ansiedade, ou seja, abertas ao exterior. Despenderam, ainda, mais tempo nessas áreas e saíram mais vezes para as mesmas, que os animais controlo. Estes comportamentos são comportamentos típicos ansiolíticos, ou
vi
seja, os animais não demonstraram sinais de ansiedade. Tais resultados podem ser devidos ao desenvolvimento de hiperactividade, uma característica de murganhos C57BL/6 submetidos a stress. Esta hiperactividade pode ser causada tanto pela intensidade e duração do stress crónico como pela utilização de luz forte (25-Lux). Os resultados obtidos no teste de open-field corroboram os resultados obtidos no teste 0-maze. Neste teste observámos, também, sinais de hiperactividade quando realizado sob luz forte, sendo que os animais passaram menos tempo imóveis no total, e tanto na zona periférica como na zona central do aparelho, outro sinal de comportamento típico ansiolítico. No teste realizado sob luz vermelha, os animais não mostraram alterações na locomoção.Neste estudo, observámos que os animais stressados despenderam significativamente menos tempo estáticos no teste de condicionamento de medo contextual e mostraram uma tendência para um aumento do tempo de latência no comportamento de deslocamento e um número reduzido de pellets retirados do tubo, 1h após o inicio do teste de deslocamento de comida de um tubo, quando comparados com o grupo controlo. Assim, esta parte do nosso estudo sugere a existência de danos na função do hipocampo, após 2 semanas de stress. Este estudo revelou ainda, pela primeira vez, uma correlação positiva entre estes dois testes, mostrando que o teste de deslocamento de comida de um tubo pode ser um teste válido para a detecção de défices na função do hipocampo.
Em conjunto, os nossos dados deixam em aberto a possibilidade de que o nosso modelo de stress crónico pode ter induzido anedonia, apenas não o conseguimos detectar com o nosso teste de sucrose. Os resultados obtidos acerca da plasticidade do hipocampo e as alterações observadas no teste do 0-maze e no peso corporal corroboram esta conclusão. Sugerimos que o nosso protocolo de stress induziu um fenótipo típico de depressão em murganhos C57BL/6. No entanto, mais estudos serão necessários para validar este modelo.
Palavras-chave: depressão, stress, murganhos, procedimento de stress crónico, anedonia,
vii
Table of Contents
Acknowledgements i
Abstract iii
Resumo iv
Table of contents vii
List of abbreviations x
List of figures xii
List of tables xv
CHAPTER I. INTRODUCTION 1
1.1 Depression: clinical classification, neurobiology and treatment 1
1.1.1 Definition, epidemiology and social impact 1
1.1.2 Types of depressive disorders 2
1.1.3 Etiology of depression 3
1.1.4 Pathogenesis of depression 4
1.1.5 Role of stress in pathogenesis of depression 7
1.1.6 Treatment of depression 8
1.2 Depression versus other stress-related disorders and features 9
1.3 Animal models of depression: importance of pre-clinical studies 10
1.3.1 Behavioral despair tests 11
1.3.1.1 Forced swim test 11
1.3.1.2 Tail suspension test 12
1.3.2 Learned helplessness test 13
1.3.3 Brain lesion models 14
1.3.4 Genetic models of depression 15
1.3.5 Stress models 15
1.3.5.1 Chronic stress model 16
1.3.5.2 Chronic mild stress paradigm 16
viii
1.4 Methods of assessment of hedonic status in animal models 19
1.4.1 Intracranial self-stimulation 19
1.4.2 Evaluation of consumption of palatable foods or solutions 19
1.5 Objectives 20
CHAPTER II. MATERIALS AND METHODS 21
2.1 General conditions of the experiment 21
2.1.1 Animals and housing 21
2.2 Definition of optimal conditions for sucrose test: study of individual drinking patterns in
C57BL/6 mice 22
2.2.1 Evaluation of water drinking patterns 22
2.3 Study of the effects of ethological chronic stress in C57BL/6 mice 23 2.3.1 Group formation and evaluation of baseline behaviors in C57BL/6 mice 23
2.3.1.1 Sucrose test 24
2.3.1.2 Resident-intruder test 25
2.3.2 Chronic stress procedure 26
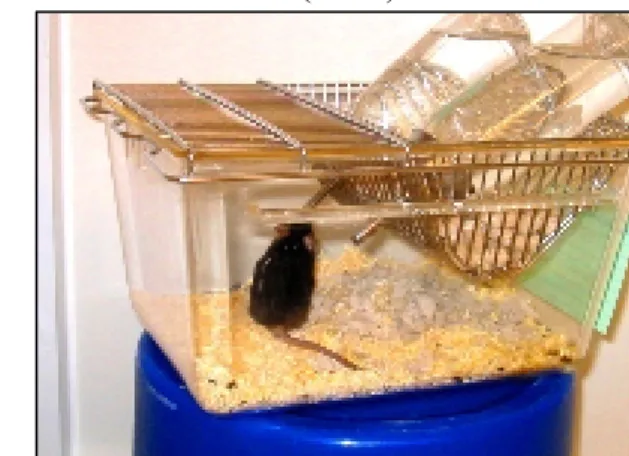
2.3.2.1 Rat exposure 26
2.3.2.2 Social defeat and exposure to CD1 mice 27
2.3.2.3 Control over the optimal stress load 27
2.4 Behavioral study of chronically stressed mice 27
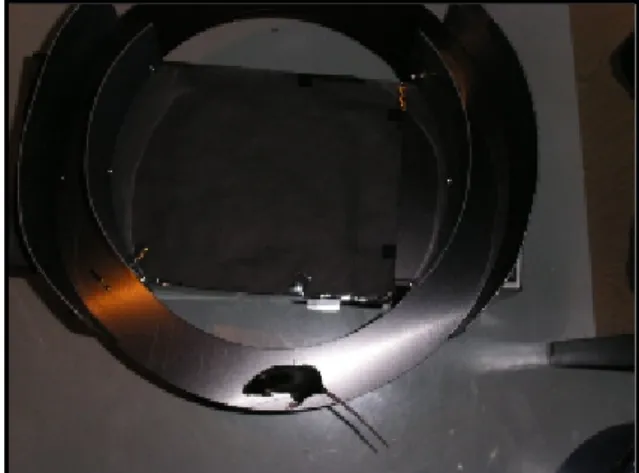
2.4.1 Assessment of anxiety-like behavior in the elevated 0-maze test 28
2.4.2 Study of hippocampus-dependent performance in: 29
2.4.2.1 Food-displacement tube test 29
2.4.2.2 Contextual fear-conditioning paradigm 29
2.4.3 Evaluation of the open-field activity at different times of the light cycle 30
2.4.4 Assessment of hedonic status in the sucrose test 31
ix
2.6 Statistical analysis 31
CHAPTER III. RESULTS 33
3.1 Inter-individual variability in water drinking patterns 33
3.2 Study of the effects of ethological chronic stress in C57BL/6 mice 36 3.2.1 Group formation based on baseline weight, sucrose test data and social status 36 3.2.2 Chronic ethological stress enhanced liquid intake but did not affect sucrose
consumption 37
3.2.3 Stress caused a reduction of body weight 38
3.2.4 Stressed mice showed reduced scores of anxiety 39
3.2.5 Hippocampus-dependent performance was impaired by stress exposure 40 3.2.6 Correlation of changes in contextual fear-conditioning and food-displacement
behavior in stressed mice 42
3.2.7 Effects of stress on the open-field behavior 45
CHAPTER IV. DISCUSSION 46
4.1 Inter-individual variability in water drinking patterns 46
4.2 Study of the effects of ethological chronic stress in C57BL/6 mice 48 4.2.1 Chronic ethological stress enhanced liquid intake but does not affect sucrose
consumption 48
4.2.2 Stress caused a reduction of body weight 49
4.2.3 Stressed mice showed reduced scores of anxiety 50
4.2.4 Hippocampus-dependent performance was impaired by stress exposure 51 4.2.5 Correlation of changes in contextual fear-conditioning and food-displacement
behavior in stressed mice 52
4.2.6 Effects of stress on the open-field behavior 52
CHAPTER V. CONCLUSIONS AND FUTURE DIRECTIONS 54
x
List of Abbreviations
5-HT 5-hydroxytryptamin, serotonin
ACTH Adrenocorticotropin
ANOVA Analysis of Variance
BDNF Brain-derived Neurotrophic Factor
BRS Brain Reward System
BSR Brain Stimulation Reward
CBA Centro de Biologia Ambiental
CMS Chronic Mild Stress
CRF Corticotrophin-releasing Factor
CRH Corticotrophin-releasing Hormone
DSM-IV Diagnostic and Statistical Manual of Mental Disorders, fourth volume
ECS Electroconvulsive Shock
EEG Electroencephalography
FCM Faculdade de Ciências Médicas
FCT Fundação para a Ciência e Tecnologia
FELASA Federation of Laboratory Animal Science Associations
FSLR Flinders Sensitive Line Rats
FST Forced Swim Test
fMRI Functional Magnetic Resonance Imaging
GAD Generalized Anxiety Disorder
HPA axis Hypothalamic-pituitary-adrenal axis
ICSS Intracranial Self-stimulation
i.e. Id est
ISAO International Stichting Alzheimer Onderzoek
LH Learned Helplessness
MAOIs Monoamine Oxidase Inhibitors
MDD Major Depressive Disorder
m.o. Months Old
OB Olfactory Bulbectomy
PET Positron-emission Tomography
xi
REM sleep Rapid Eye Movement sleepSAD Seasonal Affective Disorder
SHR Spontaneously Hypertensive Rat
SSRIs Serotonin-selective Reuptake Inhibitors
T Total
TCAs Tricyclic Antidepressants
TST Tail Suspension Test
UM Maastricht University
Vs Volume of Sucrose
vs. Versus
Vw Volume of Water
xii
List of Figures
Page
Figure 1. Brain structures believed to be impaired during depression [3]. 5
Figure 2. Forced swim test [4]. 12
Figure 3. Tail suspension test [5]. 13
Figure 4. Rodent strains used in our study. (A) C57BL/6 mice [6]. (B) CD1 mice [7]. (C)
Wistar rat [8]. 22
Figure 5. Application of a sucrose test in C57BL/6 mice. 24
Figure 6. Resident-intruder test, to define social status in C57BL/6 mice. 26
Figure 7. Rat exposure stress. 26
Figure 8. The 0-maze test apparatus. 28
Figure 9. Contextual fear-conditioning apparatus. 30
Figure 10. (A) C57BL/6 mouse inside one of the four arenas in the open-field apparatus. (B)
Image of the Any-maze program [9]. 31
Figure 11. Day to day changes of water intake in C57BL/6 mice. The total water intake
significantly varies from day 1 to day 2 and day 3 of consecutive measurements (0,01 ≤ p < 0,03; Wilcoxon test). Data on graphs are expressed as mean ± standard error of measurement
(SEM). * denotes significantly different from day 1. 33
Figures 12, 13 and 14. Study with individual water drinking behavior during 3 consecutive
days revealed four patterns of drinking behavior in mice (2,5h, 5h, 7,5h and 10h after the onset of the test). Graphs A to D from Figure 12 represent drinking patterns assessed on day 1, E to H from Figure 13 the patterns assessed on day 2, and I to K from Figure 14 on day 3.
xiii
Water intake was found to vary largely from one day to the other, evidencing pronounced variability of daily dynamics in water intake in C57BL/6 mice. Each line represents an animaland each dot the absolute water intake at that time point. 34, 35, 36
Figure 15. Effects of a 2-week stress on parameters of the sucrose test. (A) Sucrose
preference showed no significant differences between both groups, as well as sucrose intake (B) (p > 0,05 vs. control group; Mann-Whitney). Stressed mice showed a tendency to have increased water intake (C) and total liquid consumption (D) (p < 0,1 vs. control group; Mann-Whitney). Data on the graphs are expressed as mean ± standard error of measurement (SEM). 38
Figure 16. Weight changes after the application of a chronic stress procedure to stress group.
Stressed animals showed a significant reduction of their body weight (p < 0,0001 vs. control). Data on the graphs are expressed as mean ± standard error of measurement (SEM). * denotes
significantly different from control. 39
Figure 17. Exposure to a 2-week ethological stress resulted in decreased anxiety in the
0-maze test. (A) Latency of exit to the open arms was significantly decreased in stressed mice, in comparison to the control group (p < 0,05 vs. control group; Mann-Whitney). (B) Number of exits to the open arms in 0-maze was significantly higher in stressed mice compared to control group (p < 0,05 vs. control group; Mann-Whitney). (C) Stressed mice spent significantly more time in the open arms of the 0-maze in comparison to control group (p < 0,05 vs. control; Mann-Whitney). Data on the graphs are expressed as mean ± standard error of measurement (SEM). * denotes significantly different from control. 39, 40
Figure 18. Stressed mice spent significantly less time freezing as compared to control mice,
during the fear-conditioning paradigm (p < 0,005 vs. control group; Mann-Whitney). Data on the graphs are expressed as mean ± standard error of measurement (SEM). * denotes
significantly different from control. 40
Figure 19. Stressed mice showed a tendency to a decreased burrowing behavior in the tube
test. (A) Stressed mice showed a tendency to increased latency of displacement behavior, but no significant difference in the latency to empty the tube (D), when compared with control
xiv
group (p = 0,1 vs. control; Mann-Whitney). (B) In the number of pellets displaced in 1h from the beginning of the test, stressed animals showed a tendency to show reduced number of pellets displaced; however, both groups showed no significant differences between them in the number of pellets displaced 1h30 after the onset of the test (p > 0,05 vs. control; Mann-Whitney). Data on the graphs are expressed as mean ± standard error of measurement (SEM).41
Figure 20. Stress appears to reduce immobility time in the open-field test. (A) Total time
immobile was significantly decreased in stressed mice compared to control group, as well as time spent immobile in the periphery (B) and in the centre of the open-field (C) (p < 0,05 vs. control; Mann-Whitney). Data on the graphs are expressed as mean ± standard error of
xv
List of Tables
Page
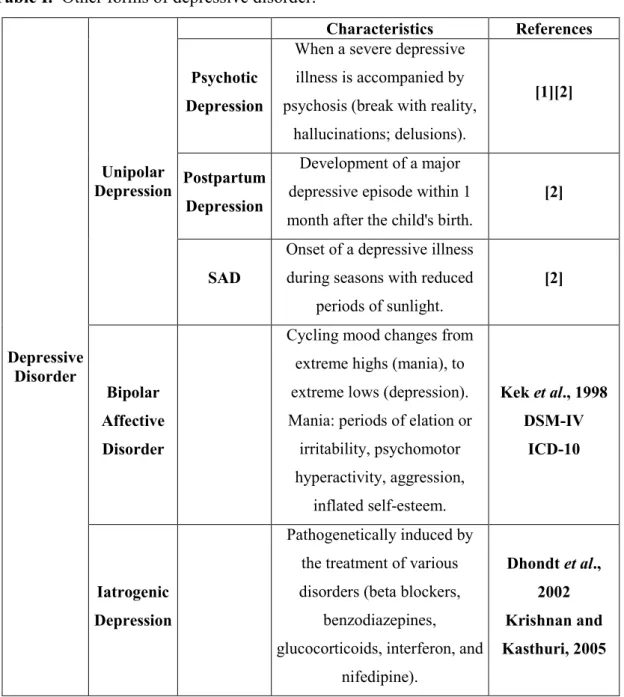
Table I. Other forms of depressive disorder. 3
Table II. Models of stress-induced anhedonia. 18
Table III. Chronogram of the study with 2-week ethological stress. 23
Table IV. Post-stress behavioral tests. *Number of hours after the end of the chronic stress
procedure. 28
Table V. Baseline behavior of mice from control and stress groups. 37
Table VI. Stress-induced disruption in contextual fear-conditioning correlates with changes in
burrowing behavior. Correlations between the percentage of contextual freezing in the fear-conditioning paradigm and the latency of displacement behavior, number of pellets displaced by the first hour and by the first 1h30 and the latency to empty the tube, in the food-displacement tube test. There were significant positive correlations between contextual freezing and number of pellets displaced in 1h and in 1h30 (p < 0,05). * denotes positive
correlation. 42
Table VII. Descriptive statistics (mean ± SEM) and probabilities (p-values) associated with
Mann-Whitney U test on the parameters assessed in the open-field locomotion, tested under red lighting. Stress group showed no significant differences when compared to control group
concerning all parameters assessed (p > 0,05 vs. control). 43
Table VII. Descriptive statistics (mean ± SEM) and probabilities (p-values) associated with
Mann-Whitney U test on the total distance traveled and the mean speed assessed in the open-field locomotion tested under 25-Lux illumination. Total time immobile and time spent immobile both in the periphery and in the centre of the field were significantly decreased in stressed group compared to controls (p < 0,05 vs. control; Mann-Whitney). All the other parameters assessed showed non-significant differences between groups (p > 0,05 vs.
1
Chapter I – Introduction
1.1 Depression: clinical classification, neurobiology and treatment
1.1.1 Definition, epidemiology and social impact
Depressive disorder is a serious disabling and life-threatening illness (Sullivan et al., 2000; Williams et al., 2000), which result from a complex set of etiologies: developmental, social-environmental and genetic. These factors solely or combined induce a state of vulnerability in an individual (Auriacombe, 1997; Sullivan et al., 2000; Hamet and Tremblay, 2005). According to the American Psychiatric Association (Diagnostic and Statistical Manual of Mental Disorders, DSM-IV, 1994), a person diagnosed with depression must present, along with dysphoric mood and loss of interest or pleasure in nearly all activities, also known as anhedonia (core symptoms), at least four additional symptoms for a two-week period (Williams et al., 2000; Kessler et al., 2005; Gotlib and Joormann, 2010). The symptoms must cause clinically significant distress or impairment in social, occupational, and other areas of functioning (Williams et al., 1995).
Depression is among the most prevalent of all psychiatric disorders (Kessler and Wang, 2009). The World Health Organization Global Burden of Disease Study ranked depression as the single most burdensome disease in the world in terms of total disability-adjusted years among people in the middle years of life (Murray and Lopez, 1996a) and estimates that by the year 2020 depression will become the second major cause of disability in the world (Sullivan et al., 2000; Murray and Lopez, 1996a, 1996b). Nowadays, more than 15% of world population experience depression, at least on time during life. This situation leads to major economic and medical costs and to an enormous social and personal burden (Murray and Lopez, 1996a, 1996b; Kessler et al., 2006).
Depression affects people of all ages, ethnicities, and socioeconomic circumstances (Regier et al., 1988; Blazer et al., 1994). It has adverse effects on the quality of interpersonal relationships and can be comorbid with other psychiatric and physical conditions, such as alcohol and substance abuse, Parkinson disease, and various somatic disorders, which limit normal activities (Gotlib and Joormann, 2010).
2
1.1.2 Types of depressive disorderThere are several forms of depression, each one with its own constellation of symptoms. Depression can be classified into two opposite poles: melancholic or somatic syndrome and atypical syndrome. The atypical syndrome can be characterized by reverse neurovegetative symptoms such as increased appetite, weight gain, hypersomnia, extreme fatigue (Hale, 1997; Matza et al., 2003), and interpersonal rejection sensitivity (Fountoulakis et al., 2004; Stewart et al., 2004). Melancholic depression includes major depressive disorder, dysthymia and subsyndromal depression. Major depressive disorder is characterized by a heterogeneous group of behavioural, psychological and physiological symptoms, which include: psychomotor agitation or retardation, marked weight loss, disturbances of sleep, decreased appetite, fatigue, extreme feelings of guilt or worthlessness, difficulty in concentrating and suicidal ideation (Nutt et al., 1997; Gotlib and Joormann, 2010).
Dysthymia is also associated with significant functional impairment, and it occurs in approximately 3% of people. Chronically depressed mood must be present during a period of two years or more, and during those periods, at least two of the following symptoms are present: appetite and sleep disturbances, decreased energy or fatigue, feelings of low self-esteem or hopelessness, and decreased concentration (Williams et al., 2000). Subsyndromal depression is an acute mood disorder, although less severe that major depression. It has an increased risk for the development of major depression and decreased functioning. This form of depression is diagnosed when depressed mood and/or loss of interest or pleasure in nearly all activities, and one to three of the symptoms used to diagnose MDD last at least 2 weeks (Williams et al., 2000).
There are other forms of unipolar depressive disorder, which exhibit slightly different characteristics than those described above, and may only develop under certain medical conditions. Some examples of these situations are psychotic depression, postpartum depression and seasonal affective disorder (SAD), and their characteristics are summarized in Table I.
Besides the various forms of unipolar depression listed above, bipolar depression also exists, however not being as epidemiologically spread as major depression or dysthymia. Finally, another form of depression is iatrogenic depression, which is pathogenetically induced by the treatment of various disorders, including pharmacotherapy and surgical treatment, being more common in the elderly (Dhondt et al., 2002; Krishnan and Kasthuri, 2005) (Table I).
3
Table I. Other forms of depressive disorder.Depressive Disorder Unipolar Depression Characteristics References Psychotic Depression
When a severe depressive illness is accompanied by psychosis (break with reality,
hallucinations; delusions).
[1][2]
Postpartum Depression
Development of a major depressive episode within 1 month after the child's birth.
[2]
SAD
Onset of a depressive illness during seasons with reduced
periods of sunlight.
[2]
Bipolar Affective Disorder
Cycling mood changes from extreme highs (mania), to extreme lows (depression). Mania: periods of elation or irritability, psychomotor hyperactivity, aggression, inflated self-esteem. Kek et al., 1998 DSM-IV ICD-10 Iatrogenic Depression Pathogenetically induced by the treatment of various disorders (beta blockers,
benzodiazepines, glucocorticoids, interferon, and
nifedipine). Dhondt et al., 2002 Krishnan and Kasthuri, 2005 1.1.3 Etiology of depression
Depression is not a single cause disease; hence, it results from a combination of genetic, biochemical, environmental and psychological factors. Some types of depression tend to run in families, thus suggesting the genetic link (Levinson, 2006). However, depression can occur in people with no family history of depression as well (Tsuang and Faraone, 1990). As suggested by genetic studies, the risk for depression results from the influence of multiple genes, which interfere with environment and several other factors (Tsuang et al., 1994). Also, a depressive episode might be triggered by some kind of trauma, (e.g. by the loss of a loved one) or by any situation perceived as stressful (Bogdan and Pizzagalli, 2006). Several
4
psychosocial factors, such as age, gender, marital status, education and income have also been identified as important factors explaining the variability in the prevalence of depression (Stewart et al., 2004; Akhtar-Danesh and Landeen, 2007).Women are also more likely to suffer from depression and anxiety than man (lifetime risk for MDD ranges from 10% to 25% in women, and from 5% to 10% in men). This may be the result of their unique hormonal and psychosocial features, which may explain the higher depression rates. Also, hormones, such as estrogen, were shown to affect limbic structures which control emotions and mood. The effects of stress, violence, lack of social support, relational problems, low self-esteem and ruminative cognitive styles are believed to contribute to the vulnerability to depression in women (Stewart et al., 2004; Akhtar-Danesh and Landeen, 2007; Posmontier, 2008). Men often experience depression differently than women and may have different ways of coping with the symptoms. In this case, depression can be perceived by low social status, sometimes accompanied by alcohol- or drug-dependency, abusive behavior and anger. For male patients with depression, it is more typical to hide symptoms of depression and compensate functional deficits with overwork or risk-taking behavior (Stewart et al., 2004; Akhtar-Danesh and Landeen, 2007).
The increased risk for depressive disorder is also associated with the presence of such medical conditions as heart disease or cancer. Also, the medication used in this cases may have side effects that contribute to depression (see above 1.1.2 Types of Depressive Disorders) (Akhtar-Danesh and Landeen, 2007).
1.1.4 Pathogenesis of depression
Despite the strong impact and prevalence of depression, there is still little knowledge about its pathogenesis. This might be due to several aspects, such as the difficulty in documenting the pathological changes in the brain rather than other organs. The available techniques for assessing the brain functions consist on post-mortem studies and neuroimaging (Phelps and LeDoux, 2005), which provided important insights about brain regions involved in depression, although simple changes in brain activity cannot be considered sufficient to explain this complex syndrome in full (Krishnan and Nestler, 2008).
The regulation of emotions, reward and executive function implicates several brain regions and circuits, which are highly interconnected. Among these structures, the prefrontal cortex, ventral striatum (including nucleus accumbens), amygdala and the hippocampus play an important role (Figure 1). It is believed that impairment of these areas is related to depression;
5
for this reason, these brain structures are considered to be targets of antidepressant treatment (Nestler et al., 2002; Maletic et al., 2007). Thus, brain regions listed above are thought to contribute to different mechanisms of depression (Maletic et al., 2007). For example, neocortex and hippocampus are believed to mediate cognitive symptoms of depression, such as memory impairments and feelings of worthlessness, hopelessness and guilt. Several studies of depressed patients demonstrated changes in blood flow, reductions in grey-matter volume and glia density in the prefrontal cortex and the hippocampus (Manji et al., 2001; Krishnan and Nestler, 2008). The striatum and the amygdala are most likely responsible for emotional memory. Deficits in these structures may underlie anhedonia, anxiety and reduced motivation. Also, the hypothalamus may play a role in depression with neurovegetative symptoms such as sleep and appetite disturbances. Other subcortical structures (nucleus accumbens, amygdala) implicated in fear, reward and motivation, are also involved in this pathways (Nestler et al., 2002).Figure 1. Brain structures believed to be impaired during depression [3].
Using functional magnetic resonance imaging (fMRI) and positron-emission tomography (PET), it has been shown that depressive symptoms associated with increased activity of the amygdala and subgenual cingulated cortex are related to dysphoric emotions (Krishnan and Nestler, 2008).
The role of the serotonergic system and the hypothalamic-pituitary-adrenal (HPA) axis in mechanisms of depression is well documented, among other neuroregulatory systems of the brain. During depression, the HPA axis is characterized by its overactivity. Depressed patients were found to have elevated levels of corticotrophin-releasing hormone (CRH) and cortisol in
6
40% of cases (Bremner et al., 2000), an abnormality reversed by antidepressants and physical exercise (Anisman and Zacharko, 2001; Dickerson and Kemeny, 2004). Low responses with the pituitary adrenocorticotropin (ACTH) secretion are another feature of depressed patients, which reflects altered functions of the HPA axis (Hayley et al., 2005). The elevated CRH levels are believed to gradually desensitize the CRH receptors that attenuate pituitary response. According to another hypothesis, the attenuated pituitary ACTH response may be due to the reduced sensitivity of serotonin receptors and reduced serotonergic neurotransmission. The release of ACTH is regulated by the serotonin-1A receptors, both at the pituitary and hypothalamus levels (Keeney et al., 2006). Several studies indicate that serotonergic neurotransmission is impaired in depression (Doherty and Gratton, 1996; Briones-Aranda et al., 2005). Pharmacological challenges and PET studies showed a decrease in serotonin-1A receptor-mediated signaling in depressed patients (Anisman, 2009).The monoamine hypothesis (Schildkraut, 1965; Maletic et al., 2007) states that depression is caused by impairment in monoamine function in the brain, characterized by a deficiency in neurotransmission mediated by serotonin (5-HT), norepinephrine and dopamine. This hypothesis has been refined through the past years and more experimental and clinical evidence has come to light (Krishnan and Nestler, 2008; Anisman, 2009). The concentration of monoamines may be altered due to disruption in synthesis, storage or release, or it may remain normal, but the receptors and/or sub-cellular messenger’s activity may be altered. Monoamines are known to affect several aspects which are altered during depression, including sleep, vigilance, appetite, motivation, motor activity and reward. Another hypothesis is based on one of the core symptoms of depression, anhedonia. The brain reward system (BRS) is a neural pathway involved in eliciting rewarding experiences in animals, including humans, and it is thought that an altered function of this system may underlie brain mechanisms behind depression (Naranjo et al., 2001).
Finally, the role of neurotrophic factors on the etiology of depression has also been discussed (Duman et al., 1997; Altar, 1999). Neurotrophic factors are known for being potent regulators of the plasticity and survival of adult neurons and glia. Hence, the neurotrophic hypothesis states that a deficiency in neurotrophic support may contribute to hippocampal pathology during the development of depressive syndrome, being that this condition is reversed by antidepressant treatment and electroconvulsive shock (ECS) (Nibuya et al., 1995; Russo-Neustadt et al., 1999). This hypothesis has focused on brain-derived neurotrophic
7
factor (BDNF), one of the most prevalent neurotrophic factors in the brain (Nestler et al., 2002) which concentration is decreased in major depression (Karege et al., 2002).1.1.5 Role of stress in pathogenesis of depression
The term stress was originally defined by Hans Selye, in the 1940s (Selye and Fortier, 1949), as the nonspecific reaction of the organism after an action of harmful factors, named stressors (Czabak-Gorbacz, 2008). Nowadays, stress is characterized as an adaptive response (physical, mental or emotional) towards events capable of causing shifts on the homeostasis in the organism, allowing it to maximize its chances of survival when facing a stressor. The organisms’ response to stress starts in the central nervous system, which processes sensory information related to the external stressor. If the situation is appraised as potentially harmful, a cascade of neural, hormonal and behavioral responses is initiated in order to deal with the situation (Grønli, 2006).
Although it is true that stress can have a direct or indirect causal association in the pathogenesis of depression (Anisman and Zacharko, 1992; Brown, 1993; Cui and Vaillant, 1996; Hammen et al., 1992; Monroe and Depue, 1991; Paykel, 2001), its impact on the organism depends on its own characteristics (type of stressor – acute or chronic, controllable or uncontrollable) and on the traits and conditions of the individual affected, such as coping ability and history of previous stressful events (Roy, 1985; Kendler et al., 1992, 2000; Anisman and Merali, 2000; Paykel, 2001).
The alterations that occur during a stress response are often found in depression. The HPA axis is activated by stress, which leads to the release of glucocorticoids, raising heart rate, blood pressure and metabolism. In depressed patients, glucocorticoids concentration is often elevated, which characterizes a dysfunction in the HPA axis (Nestler et al., 2002; Krishnan and Nestler, 2008; Anisman, 2009). It leads to hyperactivity of central neural sympathetic and to adrenomedullary-cortical gland hypoactivity. These impairments cause a typical profile characterized by decreased levels of catecholamines, such as noradrenaline, adrenaline and dopamine, in the blood, and raised plasma cortisol. The raise in cortisol levels is due to the release of the corticotrophin-releasing factor (CRF) by the hypothalamus, which stimulates the synthesis and release of ACTH from the pituitary gland. This hormone stimulates the production of glucocorticoids, cortisol in humans and corticosterone in rodents, from the adrenal cortex, causing a condition called hypercorticolaemia. Glucocorticoids exert a profound effect on metabolism and also dramatically affect behavior, acting directly in several
8
brain areas, for example, damaging the hippocampus (Krishnan and Nestler, 2008). Acute and chronic stress can also reduce BDNF expression, which can be seen in the post-mortem hippocampus in depressed humans (Nestler et al., 2002; Krishnan and Nestler, 2008).1.1.6 Treatment of depression
In order to treat depressive syndrome, there are a number of therapies, which have proven efficacy, such as: pharmacotherapy (antidepressants), psychotherapy and electroconvulsive therapy (Williams et al., 2000; Bschor and Adli, 2008; Zafar et al., 2009). Among 80% of depressed patients show improvement when submitted to any of these treatments (Nestler et al., 2002), however, at the start of treatment, only one of this therapies should be applied. In case of severe, recurrent, or chronified depression, treatments also can be combined (Bschor and Adli, 2008).
Pharmacotherapy consists on the use of antidepressant drugs to treat depression. The three main classes of antidepressants used are tricyclic antidepressants (TCAs), monoamine oxidase inhibitors (MAOIs) and atypical antidepressants. TCAs act primarily as serotonin-norepinephrine reuptake inhibitors by blocking the serotonin and serotonin-norepinephrine transporters. MAOIs inhibit the activity of monoamine oxidases, increasing the availability of monoamine neurotransmitters (Frazer, 1997). Among second generation medications, serotonin-selective reuptake inhibitors (SSRIs) and norepinephrine-selective reuptake inhibitors are widely used (Nestler et al., 2002).
Psychotherapy is defined as an intentional interpersonal relationship used by trained psychotherapists to aid a patient in problems of living. It aims to increase the individual’s sense of their own well-being and, to achieve success in psychotherapy treatment, the therapy should be tailored to ones needs, resources, and preferences (Zafar et al., 2009). This kind of treatment can be effective in mild to moderate cases of depression, and combined with the use of antidepressants can have a synergistic effect (Nestler et al., 2002). It consists of three stages (Pöldinger, 1971; Kupfer, 1993): 1) Acute therapy, which aims for the complete or near complete remission of depressive symptoms; 2) Maintenance therapy, to avoid relapsing, aiming for complete functional recovery of the patient; and 3) Prophylactic therapy, indicated in patients whose illness has taken a recurrent path (Bauer et al., 2007).
Nonetheless, depression is a highly recurrent disorder, prone to become chronic, substantially interfering with an individual’s ability to cope with daily life (Levinson, 2006). More than 75% of patients suffering from this condition have more than one depressive
9
episode, often relapsing within 2 years of recovery (Boland and Keller, 2009). Approximately 25% of patients relapse within 2 months in case of discontinued treatment (Williams et al., 2000). This high relapse rate, suggest that there are specific factors which increase people’s risk for developing repeated episodes of depression (Gotlib and Joormann, 2010). Therefore, treatment is recommended to be continued beyond initial recovery (Williams et al., 2000). According to the National Institute of Mental Health’s Sequenced Treatment Alternatives to Relieve Depression, there are even 30% to 45% of patients that do not fully respond to pharmacotherapy, being that 10% to 12% of them develop resistance to standard antidepressant treatments (Williams et al., 2000), making improved and new therapies urgently needed (Nestler et al., 2002).1.2 Depression versus other stress-related disorders and features
Stressful events are known to favor the development of depression in humans (Kendler et al., 1999). However, after a traumatic event, the majority of people do not become depressed. The ones who do, do so after stressors that for most people are considered mild. Severe stressors such as war, rape or death of a loved one, do not typically induce depression, but instead lead to syndromes such as post-traumatic stress disorder (PSTD), panic disorder and generalized anxiety disorder (GAD). Depression shares cardinal features with this stress-related disorders, but they are distinct from it based on subsidiary symptoms, treatment and course of illness (Nestler et al., 2002); however, the overlapping symptoms are sufficient to mislead diagnosis. Among the overlapping symptoms there can be found sleep disturbances, irritability, agitation, difficulty in concentrating, loss of control, fatigue, and distress. Further work is needed to understand the overlapping nature of these two brain disorders.
The same thing happens with animal models used to mimic depression. In order to induce depressive-like features, some models consist in exposure of the animals to stressful situations (Schweizer et al., 2009). The application of stress often results in a variety of behavioral, neurochemical and neuroendocrine alterations, resembling some dysfunctions found in human depression (Willner, 1997; Sapolsky, 2003; Kloet et al., 2005). However, several studies also demonstrated the presence of anomalous behaviors induced by stress, like anxiolysis and hyperlocomotion, contrary to what happens during depressive-like state – increased anxiety and decreased in locomotion (Strekalova et al., 2005; Willner, 2005). Stress can also increase
10
aggressiveness in C57BL/6, for example, which is not typical during depression (Mineur et al., 2003).As according to DSM-IV, a diagnosis for major depression corresponds to the presence of at least one core symptom, such as anhedonia, plus four subsidiary symptoms, the same should be applied to animal models. Hence, in order to really mimic the condition, the stress model should induce several and not only one behavioral or physiological alteration, being one of these alterations the core symptom anhedonia.
1.3 Animal models of depression: importance of pre-clinical studies
Depression is characterized by such a wide spectra of disruptions, that it is difficult for researchers to mimic this disorder in animal models (Cryan and Holmes, 2005). The majority of the core symptoms of depression, such as depressed mood, feelings of worthlessness or suicidal thoughts, cannot be easily measured in laboratory animals since they lack consciousness of self, self-reflection and consideration of others (Nestler et al., 2002; Deussing, 2006). There are, nonetheless, several endophenotypes in depression (Hasler et al., 2004), which can be reproduced independently and evaluated in animals. Among this endophenotypes, one can find: anhedonia; anxiety, a symptom with high prevalence in depression; neuroendocrine disturbances, mainly of the HPA axis; behavioural despair; weight disturbances; sleep disturbances, namely disturbances in the circadian rhythms and EEG parameters of sleep; and changes in neuroanatomy of the brain (Hasler et al., 2004; Deussing, 2006; Cryan and Slattery, 2007). However, since some of these endophenotypes are also present in other diseases, care must be taken with the interpretation of these findings (Cryan and Slattery, 2007).
Therefore, animal models of depression must represent several known aspects of depression in selected animal species, such as rodents (rats and mice). They are available as a tool for addressing the aspects of neurobiology of depression, as experimental models for studying the mechanism of action of antidepressants, and as a screening model to elucidate their activity (Willner, 1997; Deussing, 2006; Grønli, 2006).
Although rodents and humans possess major differences in brain anatomy, several evolutionary pathways are still conserved between the two species, underlying certain physiological and behavioural responses (Cryan and Holmes, 2005). Through inference based on findings from animal models, we can elucidate behaviours, neural circuits and genetic
11
factors behind depressive illness and further understand human behaviour and disease. The number of validated animals for affective disorders is large, and several are still being created, but in depression a major problem is the lack of validated models (Grønli, 2006).Animal models for psychiatric conditions, which are in part defined by subjective experience, pose as a problem when it comes to define clear criteria that allow asserting the validity of the model. In order to use an animal to model major depressive disorder, several questions have to be answered. First, it has to be clear what do we want the model to represent (the neurobiology of the disorder, the entire syndrome, specific symptoms, prediction of treatment efficacy) and to what end. Second, it must be considered valid. McKinney and Bunney proposed in 1969 the minimum requirements for an animal model of human disease. The model must present a reasonable analogy with the human disorder in its sympthomatology (face validity), behavioural changes that can be monitored objectively (Willner, 2005) and that can be reversed by the same treatments that are effective in humans (predictive validity), it must be reproducible between laboratories (McKinney and Bunney, 1969), and have similar etiology between the model and the human pathology (Geyer and Markou, 2000; Frazer and Morilak, 2005). There are a number of tests that have been used to validate animal models. These include tests of behavioural despair and anxiety.
1.3.1 Behavioural despair tests
The behavioural despair tests are based on the theoretical assumption that the test animal becomes desperate during the ongoing of the test (Borsini et al., 2002).
1.3.1.1 Forced swim test
This test was first described by Porsolt et al. in 1977 (Porsolt et al., 1977), and it can be used in both mice and rats (Jesberger and Richardson, 1985). In this paradigm, the animal is placed inside a container with water, from which there is no escape, and its behaviour is assessed for several minutes (Figure 2). At first, rodents display escape-oriented behaviours but then, it changes into movements that are just enough to keep the rodents head above water, a behaviour called floating (Deussing, 2006). If the animals are replaced in the testing apparatus 24h later, they adopt the floating posture quickly. This immobility was originally interpreted by Porsolt as ‘behavioural despair’, meaning that the animal had lost the motivation to perform escape-orientated behaviours (Porsolt et al., 1977). This change between activity and immobility in the FST can also reflect changes between active and
12
passive behavioural reactivity to stress (Lucki, 1997; El Yacoubi and Vaugeois, 2007). There are also other active behaviour parameters that can be studied such as climbing (upward-directed movements of the forepaws along the side of the apparatus) and swimming (Cryan et al., 2002).Figure 2. Forced swim test [4].
The FST is easy to use and has proven reliability across several laboratories (Borsini and Meli, 1988; Deussing, 2006). It is the most widely used test for screening antidepressant activity preclinically, and antidepressant medications of all major classes usually reduce immobility and increase active behaviour (Jesberger and Richardson, 1985; Borsini and Meli, 1988; O’Neil and Moore, 2003; El Yacoubi and Vaugeois, 2007). Among its drawbacks, this test is mostly sensitive to acute treatment, not reflecting the slow onset of antidepressant action as it is observed in depressed patients, and its effects may be confounded with thermoregulatory disturbances (Deussing, 2006).
1.3.1.2 Tail suspension test
The tail suspension test (TST) relies on similar assumptions and interpretations as the FST (Deussing, 2006). In this test, mice are suspended by the tail for a defined period of time (Figure 3). Typically the animal engages in escape-orientated behaviours followed progressively by increasing periods of immobility. A broad spectrum of antidepressants can restore the animals’ activity, thus reducing immobility (O’Neil and Moore, 2003; Deussing, 2006; El Yacoubi and Vaugeois, 2007). Although the underlying principle measuring the lack of active behaviour is identical in both tests (FST and TST), they vary in response to certain antidepressants, which indicates potentially different substrates underlying the observed behavioural differences (Deussing, 2006).
13
Figure 3. Tail suspension test [5].Also, different mouse strains differ markedly in their basal response in this test (Porsolt et al., 1978). The major drawbacks in this test is that its application is restricted to mice and limited to strains that do not tend to climb their tail, what otherwise may confuse interpretation. Also, as it happens with FST, TST cannot reflect the slow onset of antidepressant action as it is observed in depressed patients. Among the advantages, this is a simple and inexpensive test, which allows for automation and has high reproducibility (Deussing, 2006).
1.3.2 Learned helplessness test
The learned helplessness (LH) animal model incorporates more closely disease etiology and predisposition (Deussing, 2006), and attempts to simulate a human depressive state in animals (Maier and Seligman, 1976). It was first described in dogs (Overmier and Seligman, 1967), but currently it is used in rodents, both mice and rats. It is based on the observation that the animal develops deficits in escape, cognitive and reward behaviours (sucrose preference) when subjected to repeated unavoidable and uncontrollable foot shocks (Deussing, 2006), achieving the state of leaned helplessness. This state is defined as a failure to exhibit escape behaviour during subsequent exposure to the same stressful stimulus, only this time escape is possible (El Yacoubi and Vaugeois, 2007). This acceptance of the uncontrollable situation was accepted as being analogous to the apathetic despair seen in human depression (Jesberger and Richardson, 1985). For yet unknown reasons, only a part of the animals subjected to this stress develop signs of helplessness, reflecting a potential gene-environment interaction. Other symptoms present after exposure to this test are: loss of appetite and weight, decreased locomotor activity and poor performance in appetitively and aversively motivated tasks, equivalent to depressed human symptoms (Geyer and Markou, 2000). Although LH can be
14
prevented or reversed by acute antidepressant use, thus proving the models’ validity, and can also help in finding potential targets for antidepressants, this paradigm is not fully selective for antidepressant medication because anxiolytics have also been demonstrated to reverse helpless behaviour (Deussing, 2006).1.3.3 Brain lesion models
These paradigms are based on the assumption that depression might be caused by regulatory deficits in neuronal circuits (Deussing, 2006), which causes a constellation of behavioural and neurochemical alterations.
Bilateral olfactory bulbectomy is a widely used procedure which induces changes in behaviour, and in the endocrine, immune and neurotransmitter functions, which simulate many of the changes, observed in depressed patients. Since the olfactory system in rodents is part of the limbic region, along with the hippocampus and the amygdala, which contribute to memory and emotion, the removal of the bulbs result in a disruption of the limbic-hypothalamic axis causing all the alterations mentioned before (Song and Leonard, 2005).
In this model, the observed behavioural alterations are not just a consequence of loss of smell, since peripheral anosmia does not produce such a syndrome. Therefore, the behavioural syndrome connected to olfactory bulb must be the result of a major dysfunction of the cortical-hippocampal-amygdala circuit. These areas are also impaired in depressed patients (Song and Leonard, 2005; Deussing, 2006).
This procedure has been predominantly applied in rats, but mice can also be used. After performing and olfactory bulbectomy in rats, marked changes in all major neurotransmitter systems occur. Hyperactive response in the open field paradigm is the most consistent behavioural change observed, and it can be reversed by antidepressant medications (Cryan et
al., 1999). As chronic, but not acute, administration of antidepressants corrects the majority of
the alterations caused by OB, this model is considered not only a model for detecting antidepressant activity (Cryan et al., 2002; Song and Leonard, 2005) but also one for exploring the connection between these systems (Song and Leonard, 2005)
As this model mimics the slow onset of antidepressant action (chronic action), it shows high face validity, thus having one of the best preclinical profiles for assessing the effects of novel antidepressants (Cryan et al., 2002). The bulbectomized rat represents an agitated, hyposerotonergic depression-related phenotype instead of representing a retarded depression as stress-related models (Deussing, 2006).
15
1.3.4 Genetic models of depressionThere are a few genetic models of depression and many knock-out mice models which also show depressive-like behaviours. However two of the main genetic models of depression in rats are the Flinders Sensitive Line and the Wistar-Kyoto Rat.
The Flinders Sensitive Line Rats (FSLR) was a model developed by Overstreet et al. (Overstreet et al., 1995), through selective breeding of outbred Sprague Dawley rats for differences in the effects of the cholinesterase inhibitor diisopropylfluorophosphate in body temperature, body weight and water intake. These rats are more sensitive to the inhibitor than other breeds, and display exaggerated immobility when submitted to the FST. This immobility can be reduced by chronic treatment with antidepressants, such as desipramine, imipramine or sertraline (Overstreet et al., 1995; El Yacoubi and Vaugeois, 2007). Also, when subjected to chronic mild stress, FSL rats show enhanced vulnerability to stress-induced anhedonia (El Yacoubi and Vaugeois, 2007). This model was originally proposed as a genetic model of depression (Overstreet, 1986) because depressed patients also show more sensitiveness to cholinergic agonists (Janowsky and Risch, 1987). Another characteristic FSL rats share with depressed patients are: elevated REM sleep, appetite and weight changes and reduced activity (Overstreet et al., 1995).
The Wistar-Kyoto rat (WKR) was initially bred from the Wistar rat as the control strain for the spontaneously hypertensive (SHR) rat (Okamoto and Aoki, 1963). This strain demonstrates exaggerated behavioral and physiological responses to stress across a variety of situations. This is one of the most susceptible strains of rats towards the development of learned helplessness (Paré, 1994). During the forced swim test, WKR also demonstrated higher levels of immobility at baseline, when compared to other strains (Paré, 1994; Armario et al., 1995; Lopez-Rubalcava and Lucki, 2000).
1.3.5 Stress models
Depression is strongly influenced from stressful events or traumatic life events, suggesting that depressed patients must have an impairment of proper stress coping strategies (de Kloet et al., 2005). Because of that, the majority of models are based on the exposure to various types of stressors, acute or chronic, being capable of consistently generating behavioural changes similar to symptoms of depression, which can be reversed by antidepressants (Deussing, 2006).
16
1.3.5.1 Chronic stress modelKatz developed, in 1981 (Katz, 1981) the first model of chronic stress. This model used several stress procedures which involved relatively severe stressors such as electrical shock, food deprivation, cold swim, water deprivation, and heat stress. For 21 days, animals were exposed to unpredictable stress and some of them did not survive this procedure. The animals which survived exhibited signs of anhedonia, seen by the decrease of the intake of sucrose and saccharine solutions, reduced locomotor activity and higher corticosterone levels. Normal behaviour was then restored by antidepressants (Katz, 1981).
Nowadays, stress models are based on severe stressors, mild stressors or a combination of both, and in all of them animals are supposed to develop anhedonia (GrØnli, 2006).
The chronic stress models appear to be more appropriate for modelling depression compared to other models, as chronic stress and chronic frustration are more likely to induce the neurobiological changes which will lead to depression (Willner, 1997). However, these models have the disadvantage of being poorly reproducible in behavioural abnormalities and their response to antidepressant drugs between laboratories (Willner, 1997).
1.3.5.2 Chronic mild stress paradigm
Willner and co-workers developed in 1987 the chronic mild stress paradigm, which includes a variety of mild and more realistic stressors, administered over a longer period of time (Willner et al., 1987). Presenting different types of stressors is essential for the model, as repeated presentation of a single stressor often results in rapid behavioural habituation (Muscat and Willner, 1992). Some of the used mild stressors are: soiled cage, tilting of the cage, alterations of the light-dark cycle, periods of food or water deprivation, and grouping (Willner et al., 1987). The duration of the exposition to each stress goes from a few hours to a day, over 2 to 5 weeks. This is a model more similar to the human condition, characterized more by daily stresses than traumatic occurrences. Some of the behavioural abnormalities seen in the CMS parallel those symptoms observed in humans, and can be reversed by chronic antidepressant treatment (GrØnli, 2006). .
Like most humans, when given a choice, rodents usually prefer to drink sweet solutions (Willner et al., 1987). Willner and collaborators found that CMS can induce a significant reduction in sucrose consumption, anhedonia, one of the core syndromes of depression; hence reactivity reward was adopted as the major endpoint of this paradigm (Willner, 2005). This decrease lasts for up to 8 weeks, and can be reversed by TCAs (Willner et al., 1987).
17
This model also decreases aggressive and male sexual behaviour in rats (D'Aquila et al., 1994), locomotor activity during the active phase (Gorka et al., 1996), alters circadian and diurnal rhythm (Gorka et al., 1996; D'Aquila et al., 1997), and causes sleep disturbances, such as an abnormal REM sleep pattern (Moreau et al., 1995; Cheeta et al., 1997). It also induces loss of bodyweight (Willner and Jones, 1996), alterations in sympathetic cardiac regulations (Grippo et al., 2003) and an altered level of cytokines (Grippo et al., 2005). Finally, it affects the activity of the HPA axis (Muscat and Willner, 1992).1.3.6 Models of stress-induced anhedonia: characteristics of stressors used
Anhedonia is defined by ‘the diminished capacity to experience pleasure of any sort’. It may be a symptom in various psychiatric disorders (DSM-IV, ICD-10) and it is one of the most prominent symptoms of a major depressive episode (GrØnli, 2006).
Several chronic stress models are known for the induction of anhedonia in rodents, but each one varies on type and strength of stressors used and duration of the chronic stress application. Table II describes some stress models used by authors such as Katz (1982), Willner et al. (1987), Strekalova et al. (2004) and Baker et al. (2006).
![Figure 1. Brain structures believed to be impaired during depression [3].](https://thumb-eu.123doks.com/thumbv2/123dok_br/19186901.947990/22.892.233.659.517.800/figure-brain-structures-believed-impaired-depression.webp)
![Figure 2. Forced swim test [4].](https://thumb-eu.123doks.com/thumbv2/123dok_br/19186901.947990/29.892.358.535.216.433/figure-forced-swim-test.webp)
![Figure 3. Tail suspension test [5].](https://thumb-eu.123doks.com/thumbv2/123dok_br/19186901.947990/30.892.294.602.100.320/figure-tail-suspension-test.webp)

![Figure 4. Rodent strains used in our study. (A) C57BL/6 mice [6]. (B) CD1 mice [7]. (C) Wistar rat [8]](https://thumb-eu.123doks.com/thumbv2/123dok_br/19186901.947990/39.892.224.664.88.517/figure-rodent-strains-used-study-mice-mice-wistar.webp)