MASTER IN
FINANCE
MASTER’S FINAL WORK
PROJECT
E
QUITY
R
ESEARCH
-
M
ELIÁ
H
OTELS
I
NTERNATIONAL
A
NA
B
EATRIZ
J
ORGE
C
ARNEIRO
F
MASTER’S FINAL WORK
PROJECT
E
QUITY
R
ESEARCH
-
M
ELIÁ
H
OTELS
I
NTERNATIONAL
A
NA
B
EATRIZ
J
ORGE
C
ARNEIRO
SUPERVISOR:
PROF.
DOUTOR
CARLOS
MANUEL
COSTA
BASTARDO
i
Abstract
The purporse of this project is to estimate the intrinsic value of the Meliá’s shares using the most adequated valuation approaches to the features of the studied firm and trough a detailed analysis of the firm, the Group and its external environment. This valuation was based on the Free Cash Flow to the Firm method, which according to the Literature Review is the best methodology to evaluate the company.
In this research, Melia Hotels International is valued at €2 878M, which leads to a target share price of €12,53. Therefore, the theoretical price is above the quoted share price. Thus, a buy recommendation is given for this company shares.
Keywords: Meliá Hotels International; Lodging Industry; Discounted Cash Flow; Free
ii
Acknowledgments
To Professor Carlos Bastardo, I’m deeply grateful for helping me construct this analysis and by the dedication and competence in research orientation. Thanks for his support and suggestions trouhghout the development of this project.
To my parents, thanks for their effort that allowed me to finish my studies, guidance troughout my life, encouragement and patience through this process.
To my sister, Carolina, thanks for her incentive and understanding during these months.
iii
TABLE OF CONTENTS
LIST OF FIGURES ... IV LIST OF TABLES ... V LIST OF GRAPHS ... V ACRONYMS AND ABBREVIATIONS LIST ... VI
1. INTRODUCTION ... 1
2. LITERATURE REVIEW ... 2
2.1FRAMEWORK ... 2
2.2VALUATION METHODS ... 3
2.2.1 Discounted Cash-Flow Methods ... 3
2.2.1.1 Firm Valuation Models ... 4
2.2.1.2. Equity Valuation Models ... 5
2.2.1.3 Adjusted Present Value... 7
2.2.2RELATIVE VALUATION ... 7
2.2.3SPECIFIC VALUATION METHODS FOR HOTELS ... 9
3. MELIÁ HOTELS INTERNATIONAL - COMPANY OVERVIEW ... 9
3.1COMPANY PRESENTATION ... 9
3.2BUSINESS MODEL ... 10
3.3MELFUTURE’S STRATEGY ... 13
3.4OPERATIONAL AND FINANCIAL PERFORMANCE ... 14
3.5STOCK PERFORMANCE,DIVIDEND POLICY AND SHAREHOLDER’S STRUCTURE ... 18
4. MACROECONOMIC ENVIRONMENT AND LODGING INDUSTRY OVERVIEW ... 19
4.1SPAIN ... 20
4.2EUROPEAN UNION ... 20
4.3MIDDLE EAST AND NORTH AFRICA ... 21
4.4LATIN AMERICA &CARIBBEAN ... 22
4.5EMERGING AND DEVELOPING ASIA ... 22
4.6GLOBAL LODGING INDUSTRY OVERVIEW ... 23
5. STRATEGIC ANALYSIS ... 23
5.1SWOTANALYSIS ... 23
5.2PORTER’S FIVE FORCES ... 24
6. COMPANY VALUATION ... 24
6.1METHODOLOGY ... 24
6.2ASSUMPTIONS ... 25
iv
6.2.2 EBITDAR ... 25
6.2.3 Capital Expenditures, Amortizations and Depreciations ... 25
6.2.4 Minority Interests ... 26
6.2.5 Operating Expenses ... 26
6.2.6 Net Working Capital ... 27
6.2.7 Debt ... 27 6.2.8 Cost of Capital ... 27 6.3VALUATION RESULTS ... 30 7. RELATIVE VALUATION ... 32 7.4.1METHODOLOGY ... 32 7.4.2SELECTION OF PEERS ... 32 7.4.3RESULTS ... 32 8. SENSITIVITY ANALYSIS ... 33 9. CONCLUSIONS ... 33 10. REFERENCES ... 35
10.1ACADEMIC LITERATURE –PAPERS AND BOOKS: ... 35
10.2INTERNET BASED SOURCES ... 36
10.3INVESTOR RELATIONS –COMPANY CONSOLIDATED REPORTS ... 36
10.4DATABASES... 36
11. APPENDIX ... 37
APPENDIX A–MELSTOCK PRICE EVOLUTION ... 37
APPENDIX B–GROWTH OF BUSINESS AND LEISURE TRAVEL SPENDING ... 37
APPENDIX C–STRATEGIC ANALYSIS ... 38
APPENDIX D–ASSUMPTIONS &FORECAST:REVENUES ... 41
APPENDIX E–ASSUMPTIONS &FORECAST:CAPITAL EXPENDITURE,DEPRECIATION AND AMORTIZATION ... 43
APPENDIX F-ASSUMPTIONS &FORECAST:WORKING CAPITAL ... 44
APPENDIX G–ASSUMPTIONS &FORECAST:DEBT ... 44
APPENDIX H–FORECAST:STATEMENT OF FINANCIAL POSITION ... 45
APPENDIX I–SENSITIVITY ANALYSIS ... 46
LIST OF FIGURES Figure 1 - MEL vs Benchmark ... 16
Figure 2 Swot Analysis ... 38
v LIST OF TABLES
Table I - Valuation Methods ... 3
Table II - Relative Valuation Multiples ... 8
Table III - Spain Economic Figures (2014-2021; % change) ... 20
Table IV - European Union Economic Figures (2014-2021; % change) ... 20
Table V - Middle East and North Africa Economic Figures (2014-2021; % change) ... 21
Table VI - Latin America and Caribbean Economic Figures (2014-2021; % change) ... 22
Table VII - Emerging and Developing Asia Economic Figures (2014-2021; % change) ... 23
Table VIII - Operating Expenses Assumptions ... 26
Table IX - Net Working Capital Assumptions ... 27
Table X - MEL's WACC ... 30
Table XI - Projected Cash Flow Statement ... 30
Table XII – Enterprise, Equity Value & Share Price ... 31
Table XIII - Valuation with Multiples ... 33
Table XIV - Estimated Growth Rates ... 42
Table XV - Consolidated Revenues (2015-2021) ... 42
Table XVI - Revenues and CapEx (2012 – 2021F) ... 43
Table XVII - Net Fixed Assets and D&A (2012-2021F) ... 43
Table XVIII - NWC Forecast ... 44
Table XIX - Net Debt Forecast ... 44
Table XX - Statement of Financial Position (Consolidated) ... 45
Table XXI - Valuation Individual Sensitivity Analysis ... 46
Table XXII - Valuation Colective Sensitivty Analysis ... 46
Table XXIII - MHI upside potential sensitivity analysis ... 46
LIST OF GRAPHS Graph 1 – MEL’s Business Model ... 10
Graph 2 - MEL Results (2013-2015; millions of euros) ... 15
Graph 3 - MEL Revenues per Segment; (2013-2015; millions of euros) ... 15
Graph 4 - Operating Margin & EBIT (2011-2015; millions of euros) ... 16
Graph 5 - Net Income (2011-2015; millions of euros)... 17
Graph 6 - MEL Capital Expenditure (2011-2015; millions of euros) ... 17
Graph 7 - Evolution of Net Debt (2011 -2015; millions of euros) ... 18
Graph 8 - Shareholder's Structure ... 19
Graph 9 Stock Price Evolution ... 37
Graph 10 Growth Rates per Segment 2016 ... 37
Graph 11 Historical Revenue per Region ... 41
vi LIST OF EQUATIONS
Equation 1 – Discounted Cash Flow Model .……….………4
Equation 2 – FCFF ………. ....……….…….………5
Equation 3 – Firm’s Value ……….……….. ……….………5
Equation 4 – WACC …………...………....………..……….………5
Equation 5 – DDM: Value of Stock ……….………...………..……7
Equation 6 – FCFE ………...………7
Equation 7 – Equity’s Value ………..………..……….……….………7 ACRONYMS AND ABBREVIATIONS LIST
APV – Adjusted Present Value ARR – Average Room Rate BV – Book Value
CapEx – Capital Expenditure COGS – Cost of Goods Sold CPI – Consumer Price Index CRP – Country Risk Premium
D&A – Depreciation and Amortization DCF – Discounted Cash Flow
DDM – Dividend Discount Model
DecxxA – Actual figures as at 31 December 20xx DecxxF – Forecasted figures as at 31 December 20xx EBIT – Earnings Before Interest and Taxes
EBITDA – Earnings Before Interest, Taxes, Depreciation and Amortization
EBITDAR – Earnings Before Interest, Taxes, Depreciation and Amortization, Rental and Leases EMEA – Europe, Middle East and Africa Region
EVA – Economic Value Added FCF – Free Cash Flow
FCFE – Free Cash Flow to Equity FCFF – Free Cash Flow to Firm IMF – International Monetary Fund LAC – Latin America & Caribbean
vii
M&A – Mergers and Acquisitions MEL – Meliá Hotels International NWC – Net Working Capital P – Price per Share
PER – Price Earnings Ratio PwC – Pricewaterhouse Coopers RevPAR – Revenue per Available Room WACC – Weighted Average Cost of Capital WTTC - World Tourism and Travel Council
1
1. Introduction
The purpose of this Master’s Project is to estimate the price target of Meliá Hotels International (hereinafter the “Group”, the “Company” or MEL). The International Valuation Standards Council define market value as: “The estimated amount for which an asset or liability should exchange on the valuation date between a willing buyer and a willing seller in an arm’s length transaction, after proper marketing and where the parties had each acted knowledgably, prudently and without compulsion.” In actual fact, this type of value is established on the average market conditions in a certain date and therefore, it is no concerned with the specific drives of the single investor. These motivations are defined by another type of value – The Investment Value.
If we accepted the market capitalization as the market value, once the Group is a public traded firm, the aim of this work would already have been attained. However, economic agents do not always act based on rational expectations and occasionally there is asymmetric information that must be taken into account. Besides, the valuation made by these economic agents, which is embedded in market capitalization, can be above or below the intrinsic value of the company (the estimated value in function of the firm’s capacity to generate future wealth). In summary, this Master´s Final Work will estimate the intrinsic value of the public traded company Meliá Hotels International.
Regarding the project structure, it will be presented in six different chapters:
i. The first chapter contains a literature review, in order to gather pertinent information concerning the valuation methodologies available and applicable to the Group, based on textbooks, relevant scientific papers, and academic publications;
ii. Next, in the second chapter of this project, a full description of the company will be done. This process aims to collect information related to the company’s
2
profile, business model, economic and financial evaluation regarding the firm’s operational and stock’s market performance;
iii. The third chapter will cover a brief analysis of the macroeconomic environment and hospitality industry in the main markets where Meliá Group operates;
iv. With the conclusions of the analysis made on the second and third chapters, on the forth chapter it will be done a strategic analysis of the company, through a SWOT and a Porter’s Five Forces analysis.
v. Subsequently, the fifth chapter will rely on the company’s valuation. It will be established some assumptions and then value the company based on the methodology more suitable, agreeing with the literature review;
vi. Finally, the last chapter it will present the results and conclusions from the valuation and provide a recommendation for the investors.
2. Literature Review 2.1 Framework
Value is the defining dimension of measurement in a market economy. People invest expecting that when they sell, the value of the investment will have grown by an amount large enough to compensate them for the risk they took. Hence a company valuation is the process of determining the current worth / price of an asset or a company. According to (Damodaran, 2006) the value of any asset is a function of the cash flows generated by that asset, the life of the asset, the expected growth in the cash flow, and the riskiness associated with them.
Firm valuation comprises a process of major importance in the fields of finance, considered by many as the core of finance. During the past few years, firm valuation has
3
gained even more weight, playing a major role in M&A, IPO’s, financial restructuring, strategic decision making process and portfolio management.
Despite the careful and detailed valuation in various areas of finance, at the end, there will be uncertainty about the final numbers and conclusions. That numbers are supported by assumptions that are made about the future of the company and the economy (Damodaran, 2012).
2.2 Valuation Methods
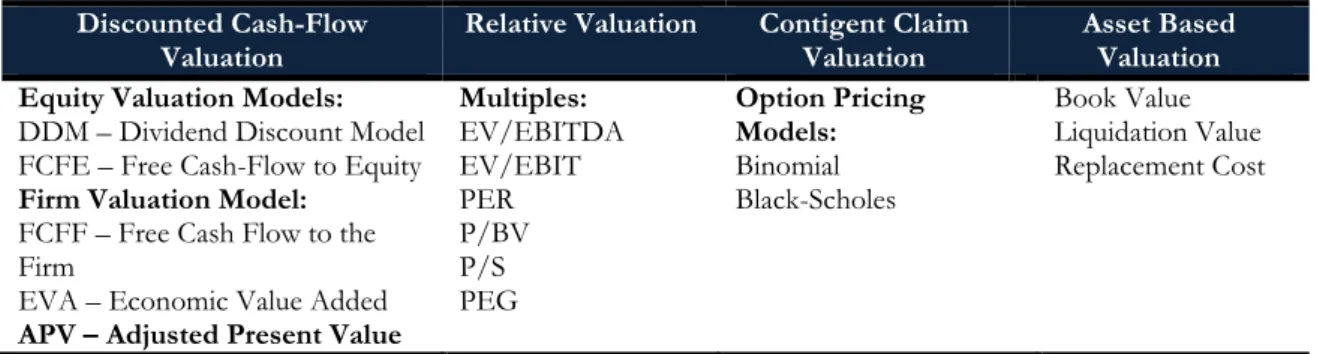
Depending on the company, the final goal and available time for the valuation (different models involve different variables and calculations that may consume too much time), there are a wide range of usable valuation methods. Although there is no general consensus, valuation methods are classified into three main approaches: i) Discounted Cash Flows Valuation method, ii) Relative Valuation method and iii) Contingent Claim Valuation (Real Options) (Berk, J., Demarzo, P., 2013).
Table I - Valuation Methods
Discounted Cash-Flow
Valuation Relative Valuation Contigent Claim Valuation Asset Based Valuation Equity Valuation Models:
DDM – Dividend Discount Model FCFE – Free Cash-Flow to Equity Firm Valuation Model:
FCFF – Free Cash Flow to the Firm
EVA – Economic Value Added APV – Adjusted Present Value
Multiples: EV/EBITDA EV/EBIT PER P/BV P/S PEG Option Pricing Models: Binomial Black-Scholes Book Value Liquidation Value Replacement Cost
Source: Damodaran, A. (2006), Valuation Approaches and Metrics: A Survey of the Theory and Evidence, Stern School of Business, New York University
2.2.1 Discounted Cash-Flow Methods
The purpose of this methodology is to provide an estimate of the intrinsic value of a firm at a certain period in time. This model defines that the value of an asset is equal to the present value of the expected future cash-flow on that asset, discounted at the rate that best describes its riskiness (Fernandez, 2007).
4 𝑉𝑎𝑙𝑢𝑒 𝑜𝑓 𝑎𝑛 𝑎𝑠𝑠𝑒𝑡 = ∑ 𝐶𝐹𝑛 (1 + 𝑟)𝑛 𝑛=∞ 𝑛=1 (1)
According to Damodaran (2006), there are three distinct approaches of DCF valuation models: Firm Valuation, Equity Valuation and Adjusted Present Value.
2.2.1.1 Firm Valuation Models
These models developed an approach to valuation where the entire firm is valued, by discounting the cumulated cash flows to all claim holders (stockholders or creditors) in the firm by the weighted average cost of capital (cost of capital approach) (Damodaran, 2006) or by adding the marginal impact of debt on value to the unlevered firm value (adjusted present value approach) (Kaplan, S., Ruback, R., 1995). Within this category of evaluation, the main models are the Free Cash Flow to Firm – FCFF and the Economic Value Added – EVA. In this project is only referenced the first on it will be used to evaluate Meliá Hotels International (MEL).
Free Cash Flow to Firm (FCFF) - In this method it’s possible to assess the overall firm
value by discounting the after-tax free cash flow available from operations at a weighted-average cost of capital (WACC). Fernández (2007) describes free cash flows as the after-tax cash generated from a firm’s operations assuming there’s no debt. Damodaran (2006) also defines FCFF as a cash flow computed as “if the firm had no debt and no tax benefits from interest expenses”. The author highlights that this cash flow is calculated before any sources of financing and hence, it is unaffected by firms’ financial structure. While there are many versions of FCFF, the most common one is given as follows:
𝐹𝐶𝐹𝐹 = 𝐸𝐵𝐼𝑇 (1 − 𝑇) − (𝐶𝑎𝑝𝑖𝑡𝑎𝑙 𝐸𝑥𝑝𝑒𝑛𝑑𝑖𝑡𝑢𝑟𝑒 − 𝐷𝑒𝑝𝑟𝑒𝑐𝑖𝑎𝑡𝑖𝑜𝑛) − ∆𝑁𝑊𝐶 (2) The firm value is given by discounting FCFF at WACC rate:
𝐹𝑖𝑟𝑚′𝑠 𝑉𝑎𝑙𝑢𝑒 = ∑ 𝐹𝐶𝐹𝐹𝑛 (1 + 𝑊𝐴𝐶𝐶)𝑛 𝑛=∞
𝑛=1
5
𝑊𝐴𝐶𝐶 = 𝐸
𝐸 + 𝐷× 𝐾𝑒+ 𝐷
𝐸 + 𝐷× 𝐾𝑑(1 − 𝑡) (4)
Where, E is the market value of Equity, D the market value of Debt and T the tax rate. WACC is a weighted average of the cost of equity and debt, which are required by shareholders and debtholders, concerning the company’s financial structure (Fernandez, 2007).
For some authors, WACC is the most common technique for valuing risky cash-flows. Its major strength is the simplicity from which deviations in the financing mix can be built into the valuation model (Damodaran, 2006; Ruback, 2000). Some authors, such as Luherman (1997) and Damodaran (2012) state that this model it is a practical choice when managers aim for a constant debt-to-equity ratio over the long run.
Despite the problems associated to its usage, WACC is still the most widely method used for firm valuation (Sabal, 2005). For other authors, the WACC is obsolete once it is affected by deviations in the capital structure, implicating some implementation problems with FCFF. This is specially true in high levered transactions and project financing in which capital structure changes over time (Esty, 1999).
2.2.1.2. Equity Valuation Models
According to Damodaran (2006), equity valuation models assess the value of the firm’s equity stake in a business. This is done by discounting the expected cash flows that are considered belonging to the equity holders, at a rate that reflects the cost of equity financing.
Within this category it can be found two different models: i) Dividend Discount Model (DDM), in which the expected cash flow to the equity is equivalent to the expected shareholders dividends in perpetuity; ii) Free cash flow to the equity (FCFE), which are
6
considered all cash flows distributed to shareholders, as well as the potentials, i.e. those that the company generates, but for some reason chooses not to distribute.
Dividend Discount Model (DDM) - Based on the idea that, when an investor buys
shares from publicly traded companies, he is expecting to earn two different types of cash flows: dividends during the holding period and an expected price at the end of that period (Damodaran, 2006). If one assumes that a publicly traded company lasts forever, which in theory is possible, then the price of a stock is equal to the expected dividends that stock will pay in perpetuity. The first to identify the connection between present value and dividends was Williams (1938). After that, several other variations of the model have been developed differing in assumption about future growth. Durand (1957) introduced the stable-growth model which was later on, further analysed and promoted by Gordon (1962). According to this model, the expected dividend of the next period and the cost of equity adjusted by the expected growth rate in dividends explain the value of a stock.
𝐷𝐷𝑀: 𝑉𝑎𝑙𝑢𝑒 𝑜𝑓 𝑆𝑡𝑜𝑐𝑘 = 𝐷𝑖𝑣 𝑘𝑒− 𝑔
(5)
Where, Div is the expected dividend for the next period, ke the cost of equity and g the constant growth rate.
Free Cash Flow to Equity (FCFE) – Traditional CFE represent what is available for
distribution to shareholders after capital expenditures and net working capital needs have been met, as well as, financial obligations (Damodaran, 2002 and 2006)
.
These obligations consist of debt payments as well as changes in working capital and preferred dividend payments. Therefore, FCFE is given by:𝐹𝐶𝐹𝐸 = 𝑁𝑒𝑡 𝐼𝑛𝑐𝑜𝑚𝑒 + 𝐷&𝐴 − 𝐶𝑎𝑝𝐸𝑥 − ∆𝑁𝑊𝐶 − (𝑁𝑒𝑤 𝐷𝑒𝑏𝑡 𝐼𝑠𝑠𝑢𝑒𝑠 − 𝐷𝑒𝑏𝑡 𝑅𝑒𝑝𝑎𝑦𝑚𝑒𝑛𝑡𝑠) − 𝑃𝑟𝑒𝑓𝑒𝑟𝑒𝑑 𝐷𝑖𝑣𝑖𝑑𝑒𝑛𝑑𝑠
7
Once the future cash flows to equity are computed, they’re discounted at the expected cost of equity, in order to obtain the equity value.
𝐸𝑞𝑢𝑖𝑡𝑦′𝑠 𝑉𝑎𝑙𝑢𝑒 = ∑ 𝐹𝐶𝐹𝐸𝑡 (1 + 𝑘𝑒)𝑡 𝑡 = 𝑛
𝑡=1
(7)
Damodaran (2006) makes a comparison between DDM with FCFE, retitling the latter “potential dividend model”1, it means that if a company was to pay out to its
shareholders all its cash flows after debt payment and reinvestment needs, both DDM (considering company doesn’t inflate dividends by borrowing) and FCFE methods would yield the same value for the company.
2.2.1.3 Adjusted Present Value
According to Fernandez (2007), this method computes the company’s value by assessing the value of its assets. There are three main types of asset based valuation methods: book value, replacement cost and liquidation value (Damodaran, 2012). The book value approach, it uses book value as the measure of the value of the assets; replacement cost is the estimation of what would be the cost to substitute all of the assets that a company has today; liquidation value is achieved by combining the estimated sale profits of the assets owned by a firm. However, these methods do not take into account the company’s possible future evolution, the money’s temporary value or the industry’s current situation (Fernández, 2002).
2.2.2 Relative Valuation
Relative Valuation is often used in the most of the equity research reports, not only because it can be a complement to DCF valuation (although the fact that it’s precision is especially separate from the DCF valuation techniques), but also because it requires less assumptions and variables.
1 Damodaran, A. (2006), Valuation Approaches and Metrics: A Survey of the Theory and Evidence, Stern
8
There are three essential steps in order to perform a relative valuation. The first one requires the analyst to identify a set of comparable companies priced by the market. In general, analysts often use companies belonging to the same sector or whose potential growth, profitability and perceived risk are similar. The second step, consists in standardize the prices to a common variable, since absolute prices cannot be compared. Therefore, the analyst must convert the prices into multiples so firms with different size and unit can be compared to their peers. According to Fernández (2002), the most used multiple is the Price Earnings Ratio (PER), though, some multiples can be more appropriate than others, depending on the industry (in hotel valuation processes it’s generally used the price per room). Despite having the prices achieve the standardized form; one can still notice discrepancies between companies relative to growth, risk and cash-flows. Hence, the final step involves controlling for those differences.
According to Fernández (2002) there are three main types of multiples as we can see on the table below:
Table II - Relative Valuation Multiples Multiples based on the market
capitalization (Equity)
Multiple based on the company’s
value (Enterprise Value) Growth referenced multiples
E.g.
Price-to-Earnings (PER) Price-to-Sales (P/S) Price-to-Book Value (P/BV) Price-to-Cash Flow (P/CF) Dividend Yield (DY)
E.g. EV/EBITDA EV/Sales EV/IC E.g. PEG EV/EG
Source: Fernández, P. (2002). Valuation using multiples. How do analysts reach their conclusions?, IESE Research Papers D/450, IESE Business School.
Even with the easiness of relative valuation, it is difficult to implement when there is not a quite large number comparable firm in the sector. Moreover, the definition of
9
comparable firms in itself is not always easy to establish and often leaves space for subjectivity.
That is, relative valuation adds explanatory power and accuracy to DCF’s estimates and thus, should be used in a second stage as a complementary tool to DCF.
2.2.3 Specific valuation methods for Hotels
In this case, the best model to evaluate MEL is the FCFF, discounted at WACC, not only because it is reasonable to consider a constant target debt to equity ratio, but also because it allow us to work with the company consolidated accounts without considering the value of each hotel or business unit. If we were valuing another lodging company with a different business model than Meliá, we could consider other valuation methods, more related to the intrinsic value of a company’s real estate properties. If we were concerned about the value of the hotel, as a real estate asset, then the three most used methods2 are: i)
Market comparative method; ii) Income method; and iii) Cost method.
The market approach is similar to relative valuation, although the comparatives of real estate market are specific, like price per square meter, in general, or price per room, particularly in the hotel sector. The income approach is based on the same methods applied in corporate field, namely DCF, or the most simple and expedite yield, or cap rate method. Regarding cost approach, this one is not a driven market method, and so, only when it is not possible the other methods this one should be applied (also, it does not work in valuing companies)
3. Meliá Hotels International - Company Overview 3.1 Company Presentation
Founded in 1956 in Palma de Mallorca, Spain, MEL is one of the world’s largest resort hotel chains, as well as Spain’s leading hotel chain. It currently provides more than 350 hotels in 35 countries, on 4 continents.
10 18% 24% 58% Owned Leased Managemen t & Franchised
All over its history, the company has been involved in several M&A operations with other hotel companies, allowing the company to grow at a startling rate.
This evolution and the strategic focus on international growth has allowed Meliá Hotels International to be the first Spanish hotel company with presence in key markets such as China, the Middle East, or the US, as well as maintaining its leadership in traditional markets such as Europe, Latin America or the Caribbean.
In 1996, it was the first Spanish hotel company to be floated on the stock exchange, with the resulting requirement of transparency, regulatory control, and corporate social responsibility. Since then, the company’s focus on maintaining a stable financial position has seen an increase in loyalty among its shareholders and investors.
MEL is the only company in the sector to be included in the Spanish Stock Exchange index of responsible companies, the FTSE4Good. The company is also a point of reference in the Spanish tourist sector when it comes to Sustainability and Corporate Social Responsibility. Its Global Sustainability Policy formally sets out its commitment to the environment, cultural and social integration and sustainable, responsible growth.
3.2 Business Model
The group has developed and implemented a new Organisational and Business Model in order to simplify the alignment with corporation’s strategy. This new model
Graph 1 – MEL’s Business Model relies on four business areas: Hotels, Asia Pacific, Real
Estate and Club Meliá. These four areas
actively cooperate and are also highly complementary in their activities to achieve the company’s strategic challenges: to become a more global company, with growth in the most
11
relevant brands and markets, (especially through management, lease and franchise agreements), with a special focus on Asia and maximising the profitability of its assets. It follows a brief description of the activities in each of the different areas:
Hotels
Responsible for the operations in the MEL hotels, this area includes all of the hotel brands and the wide range of experiences they offer guests, from the most avant-garde to the most family-oriented.
The Hotels area has evolved in 2011 towards a hybrid management model by both brand and region, which at the same time ensures the personality of the brand and the efficiency of operations.
Given the large number of hotels in the company portfolio, MEL developed three different systems for operating hotels as follows: Ownership: both the ownership and the management of the property are in the hands of MEL; Management: the management of the hotel is the responsibility of MEL, but the hotel is owned by a partner with whom the company has agreed conditions for its management services; Lease: MEL leases facilities to operate a hotel under one of its hotel brand name.
Given the Company’s focus towards a low-capital model, it is desirable to manage and franchise hotels rather than own them. This allows management to do what they do best: selling rooms, offering their guests an experience and guaranteeing a solid control over operating costs. The emphasis of the company on the long-term management contracts and franchising tends to provide more stabilized earnings in periods of economic softness like that we are living through today, while adding new hotels to the system generates growth with small or even no investment.
12 Asia-Pacific
The Asia-Pacific area was created with the aim of a growing presence of MEL in the continent, at the same time that promotes the role of Asia as a feeder market for company hotels. In order to achieve this goal, MEL has reinforced its sales, distribution and hotel development squads with the creation of a corporate office in Shanghai from which the company's Asia-Pacific strategy is managed.
Real Estate
Real Estate is another basic foundation for the MEL organisational structure with the dual goal of, not only maximising the profitability of the company’s real estate assets, but also using those assets to widen the range of services available to clients.
Therefore, this area is responsible for enhancing the sustainable profitability of company assets, ensuring the quality of the real estate portfolio, optimizing the lifecycle of assets, planning medium and long-term investments, promoting and maintaining relationships with partners and real estate investors, and marketing and managing residential developments, shopping malls and golf courses. In order to get the most out of all the catering and sports facilities in hotels, the company has forged a number of strategic alliances with market leaders in each area.
Club Meliá
Created in 2004, with 27 000 members worldwide, Club Meliá is the vacation club of MEL, with the aim of completing the company's range of holiday products.
Club Meliá guarantees its members one week's vacation a year, for 50 years. Members purchase a “holiday currency” named Options, which they can swap for annual vacations in a large selection of company hotels or in a network of more than 4,000 affiliated resorts worldwide.
13
3.3 MEL Future’s Strategy
Regarding the future strategy of the Company, MEL aims to keep working based on the same values, but with a larger and growing hotel chain. The main goal is to consolidate the brand in the mature markets and to grow in the emerging ones.
In 2015 the Company signed 25 new hotels of which 5 already opened in 2015 and therefore they are not included in the pipeline (pipeline data details existing hotel supply and projected growth globally) at the year end. As a result, the pipeline reached 62 hotels (16 085 rooms) due to the efforts to reinforce internationalization while also boosting presence in those traditional markets that generate value for Meliá and its brands.
82% of the pipeline will be incorporated under management formulas, while only an 18% are lease contracts, all this lease contracts are located in strategic markets that meet Company’s requirements in terms of quality, productivity and safety, such as Germany, U.K, United States or Italy. On the other hand, the focus will be the maintenance of Melia leadership in the resorts segment while reinforcing the presence in leisure destinations.
Of these 62 hotels, 2 hotels have opened in January 2016: the Sol Costa Atlantis in Tenerife (289 rooms under lease agreement) taking advantage of the strong momentum in Mediterranean resorts and the Company expertise in the Canary Islands; and the Meliá Braco Village in Jamaica (226 rooms under management) that extends the Meliá footprint in the English-speaking Caribbean.
On the other hand, in 2016 the pace of new agreements is expected to remain the same, with 25-30 new hotels being added to the pipeline, which implied one new signature every two weeks. In terms of hotel openings, the forecast based on the pipeline as it stood on 31st December is for Meliá to open 20-25 hotels over the year:
America (12 hotels / 2 325 rooms): Of the 13 hotels in the pipeline, 5 are
14
the United States: the ME Miami (129) and Meliá Costa Hollywood (227) in Miami, and the Innside New York NoMad, the only lease contract in the pipeline in the Americas.
Asia (20 hotels; 4,827 rooms): Within the framework of the new Strategic Plan
2016-2018 one of the most important objectives for the company is to increase its presence in Asia, as reflected in the current pipeline in the region which makes up 27% of the global rooms pipeline. In recent years, the Company has made great efforts to detect strategic partners which could contribute to the consolidation of Meliá’s presence in the region, the fruit of which is a current pipeline which includes the opening in 2016 of 8 hotels (1.823 rooms) all under management agreement.
EMEA (20 hotels; 4,006 rooms): The pipeline in EMEA is well balanced between
lease and management agreements. Going into 2016 the current pipeline includes the opening of 3 leased hotels under the Innside brand in Germany) and 2 managed hotels in Italy and Morocco.
Mediterranean (3 hotels; 1725 rooms): One of the agreements has been already
opened (the Sol Costa Atlantis), while another 2 hotels in Cape Verde are expected to open (one of them in 2016).
Brazil (4 hotels; 1178 rooms): Including 2 hotels which are expected to open in
2016 before the Olympic Games in Rio de Janeiro.
Cuba (3 hotels; 2024 rooms): Cuba where Meliá currently operates 39% of hotel
rooms in the island remains one of the key markets for the Company.
3.4 Operational and Financial Performance
Despite the losses in 2013, MEL has been growing through the past three years. This is due to the fact that the Company continued opening new hotels each year and expansion of several MEL brands.
15 0 500 1000 1500 2000 2500 2013 2014 2015 Overheads Club Meliá Real Estate Hotels Graph 3 - MEL Revenues per Segment; (2013-2015; millions of euros)
1368,7 1464,3 1738,2 174,9 132,4 163,9 -73,2 30,4 36 2013 2014 2015
Revenues Operating Income Net Income Graph 2 - MEL Results (2013-2015; millions of euros)
Revenues
Regarding the results presented by the Group in 2015, it is important to note that the main indicators have grown compared with the previous year. These results are due to consolidation of the improvement in all divisions of the
hotel business, generating a record increase of Revenue Per Available Room (RevPAR3). A
result of an improvement in the business environment and economy in key markets, a brand strategy and product repositioning and rise of 13,4% in the prices. This trend should continue in 2016, where macro and international instability come together with good repositioning results in mature locations.
The maturity in the hotel management has lead MEL to outperform results when compared with the benchmark, registering 19 consecutive quarters of RevPAR growth. The differences between MEL’s results and the benchmark are expressed on the next figure. ~
3 Hotel guestroom revenue divided by the room count
Source: Meliá Hotels International
16 0,0% 2,0% 4,0% 6,0% 8,0% 10,0% 12,0% 14,0% 0 50 100 150 200 2011 2012 2013 2014 2015 EBIT Operating Margin
Source: Meliá Hotels International
Figure 1 - MEL vs Benchmark
According to MEL annual report 2015, there were improvements in the sales of every region: In the Americas, RevPAR increased by 20,6% thanks to a rise in Average Room Rate (ARR4) of 21,3%; In EMEA (includes Premium Hotels in Spain), RevPAR in
owned and leased Hotels grew by 11,2%, 100% explained by increases in prices; In the
Mediterranean Division, RevPAR grew by 8,7%, almost all (7,5%) due to price increases.
The geopolitical situation in other destinations also had an impact on the hospitality industry in Cape Verde, where Meliá manages about 1 500 rooms; The division Spain (City hotels) reports an increase in RevPAR of 13,1%, mainly attributable to the consistent recovery in all market segments which allowed Meliá to maintain its leadership in the most tourist cities, where the Company takes advantage of its experience and expertise in the Urban and Leisure segments, to develop its successful "bleisure" strategy (business + leisure), focused on both the business and leisure travellers, to optimize occupancy and ARR.
EBIT & Operating Margin
As we can see on Graph 4, MEL’s EBIT has been generally increasing over the past five years (with the
4 Hotel guestroom revenue divided by the number of rooms sold
Source: Meliá Hotels International
Graph 4 - Operating Margin & EBIT (2011-2015; millions of euros)
17
Graph 5 - Net Income (2011-2015; millions of euros)
-100 -50 0 50 2011 2012 2013 2014 2015 Net Income 0 20 40 60 80 100 120 140 160 2011 2012 2013 2014 2015 Capital Expenditures
Source: Meliá Hotels International
Graph 6 - MEL Capital Expenditure (2011-2015; millions of euros)
Source: Meliá Hotels International
exception of 2013-2014). In 2015, EBIT increased by, approximately 25% when compared with 2014.
Regarding the Operating Margin, it increases 4,3% from 2014 to 2015. This is due to the fact of the Group increased the management fees in 19,5M€, when compared with 2014, including hotels owned, leased and under management to third parties.
Net Income
In 2015, the net income was up 18,3% in comparison with 2014. Despite the impact of higher taxes resulted of an
inspection to verify compliance with tax obligation and duties over the period of 2009-2012. Excluding the impairment and the extra-taxes, net income increased more than 200%.
Capital Expenditures
In 2015, the Group invested around 64M€, mainly in the development of new hotels, rehabilitation and modernization of existing ones. For 2016, MEL is expecting to continue the investment through refurbishing of new hotels in order to increase the number
of rooms and hotels under management, aligned with the Strategic Plan for 2016-2018.
Working Capital
At the end of 2015, MEL had negative working capital as the current liabilities were approximately 869,3M€, while the current assets were around 767,2M€. The fact that the
18 - 500 1.000 1.500 2015 2014 2013 2012 Net Debt
Source: Meliá Hotels International
company has negative working capital could indicate that it could experience problems expanding. However, negative working capital is not necessarily a bad thing, once it could indicate that the company is very efficient at running over inventory or that MEL has large financial subsidiaries and institutions.
Debt Structure
2015 was the second consecutive year of debt reduction, reaching a total Net Debt of 768,8M€, minus 216M€ than the previous
year. Current debt levels are now similar to the ones in
2007, one of the best years in MEL history. There were a successful evolution of Financial Expenses account with 36M€ savings, when compared with 2014, due to the lower value of debt and a decrease in the average cost of debt, that now stays at 4,36%.
Essentially, its debt structure is mainly composed by simple and convertible bonds, bank loans, mortgage banked-loans, credit facilities and leases.
3.5 Stock Performance, Dividend Policy and Shareholder’s Structure Stock Performance
MEL is quoted since 1996, when the company became public at the initial price of 6,42€. The stock price decreased by 2,1% during the fourth quarter of 2015, while the IBEX Medium Cap rose by 5,5% and the IBEX 35 decreased by 0,2%. For the 12 months of 2015, the stock price rose by 37,5%.
Over the last 3 years, the market capitalization of the company has been increasing in average, as can be seen in the graphic at Appendix A. This recent trend and valorization
19 58% 2% 1% 1% 1% 1% 36% Escarrer Julia (Gabriel & Family)
Santander Asset Management
DNCA Investments
Source: Meliá Hotels International
of the Group reflects the company’s strategy of managing and developing a larger number of rooms around the world and the intention to invest in the next few years, in order to scale the business and enlarge the number of hotels under management.
Dividend Policy
MEL has the objective of ensure a satisfactory remuneration to the shareholders through the distribution of dividends. In order to achieve that the Company has been paying about 20% of the Parent Company’s consolidated profits in dividends. The last dividends were paid out on August 5th, 2015 with a gross value of 0,03€ per share.
Shareholder’s Structure
MEL’s capital, in 31 of December of 2015, was accounted for 199 053 048 shares of common stock outstanding, of which 58,32% are held by the group and 41,68% correspond to floating stock.
The majority of these non-floating shares are held by
Gabriel Escarrer and his family, the founders of MEL. The top 5 shareholders of MEL hold together around 63% of the Company, with the remaining 37% widely scattered.
4. Macroeconomic environment and lodging industry overview
This section comprises an analysis of the macroeconomic outlook in 2016 and for the subsequent years, in the main regions where MEL operates and a global lodging industry overview. This macroeconomic perspective will be done across regions rather being country-specific due to the MEL own strategy.
20 4.1 Spain
Spain economic crisis lasted more than five years. Though, a robust economic recovery in Spain is projected to continue into 2016 and 2017. 2014 was the first year of recorded growth for the country since the crash of 2008. The positive impact of the depreciation of the euro, lower oil and other commodity prices, low borrowing rates for businesses and households will also continue to provide support together with the fiscal stance, which is projected to be mildly expansionary over the following two years. These factors, together with the execution of significant structural reforms, are increasing business confidence.
Tourism has been a strong contributor to Spain’s economy and it’s playing an important part in the nation’s recovery. The scale of tourism’s contribution in the first two months of 2015 was unprecedented. Tourism figures for January and February smashed previous records, with 6,5 million international tourists spending €6,6 billion– an increase on the previous year of 4.5% and 8% respectively.
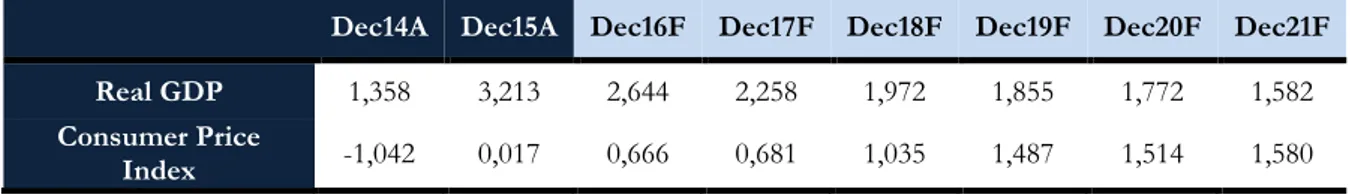
Table III - Spain Economic Figures (2014-2021; % change)
Dec14A Dec15A Dec16F Dec17F Dec18F Dec19F Dec20F Dec21F
Real GDP 1,358 3,213 2,644 2,258 1,972 1,855 1,772 1,582
Consumer Price
Index -1,042 0,017 0,666 0,681 1,035 1,487 1,514 1,580
4.2 European Union
In Europe, the last years have been disturbed due to the global financial and economic crisis, what leed some countries to the need of assistance from the IMF. In the coming years, IMF predicts that the GDP will grow above 1,8%, per year.
Table IV - European Union Economic Figures (2014-2021; % change)
Dec14A Dec15A Dec16F Dec17F Dec18F Dec19F Dec20F Dec21F
Real GDP 1,445 1,986 1,841 1,949 1,871 1,868 1,834 1,801
21 Consumer Price
Index -0,034 0,191 0,977 1,459 1,670 1,761 1,822 1,895
Geopolitical uncertainty in the Middle East appears to be having a strongly positive effect on some cities, as travellers choose perceived ‘safer’European resorts over destinations in the Middle East and North Africa. However, the refugee crisis across Europe and terrorist attacks in Istanbul, Paris and Brussels have affected these cities.
According to the Pricewaterhouse Coopers (PwC) (2016), Europe (+5%) led global growth in absolute and relative terms supported by a weaker euro vis-à-vis the US dollar and other main currencies. Arrivals reached 609 million, 29 million more than in 2014. Central and Eastern Europe (+6%) rebounded from last year’s decrease in arrivals. Northern Europe (+6%), Southern Mediterranean Europe (+5%) and Western Europe (+4%) also recorded good results, especially considering the number of mature destinations making up the region.
4.3 Middle East and North Africa
This particular region presents some of the most actual and expected growth rates, in what concerns real GDP and inflation, which is explained by the oil exportations. Last year, the real GDP growth rate in the region was 2,336% and the inflation was around 5,53%. For the following years, these economies are expecting sustainable growth, with a real GDP growth rate of 3,593% in 2021.
Table V - Middle East and North Africa Economic Figures (2014-2021; % change)
Dec14A Dec15A Dec16F Dec17F Dec18F Dec19F Dec20F Dec21F
Real GDP 2,613 2,336 2,942 3,301 3,390 3,588 3,712 3,593
Consumer Price
Index 6,552 5,526 5,782 4,765 4,073 3,918 3,956 3,968
PwC on a Middle East Hotel Report (2014), states that there is a opportunity and growth potential at this region, with the upcoming of Mega Events, such as Expo 2020 and
Source: IMF, World Economic Outlook Database Source: IMF, World Economic Outlook Database
22
Qatar World Cup 2022). However, the same report refers that the current political instability and impact from the Arab Spring leaves many of the remaining Middle East countries facing declining occupancies and RevPAR.
4.4 Latin America & Caribbean
The region’s growth average is weighted by the slowdown in vital economies such as Venezuela and Brazil. Optimistic spots include economies in the north, such as Mexico, Central America and the Caribbean, these economies are linked to the US.
For the second consecutive year the Latin American & Caribbean region (LAC) faces a continuing decline in growth, as a result of an external environment particularly adverse to commodity exporters.
Table VI - Latin America and Caribbean Economic Figures (2014-2021; % change)
Dec14A Dec15A Dec16F Dec17F Dec18F Dec19F Dec20F Dec21F
Real GDP 1,302 -0,081 -0,472 1,510 2,140 2,613 2,724 2,771
Consumer Price
Index 4,965 6,201 5,008 4,243 4,002 3,796 3,597 3,596
2015 was an significant year for LAC’s image as a travel destination. For example, Brazil coasted on the achievement of a successful World Cup and in 2016 will host the Olympic Games. With LAC present in the minds of consumers as a destination, economic recovery in many source markets and better-than-ever tourism infrastructure, the region seems geared up to receive arriving visitors in 2016.
4.5 Emerging and Developing Asia
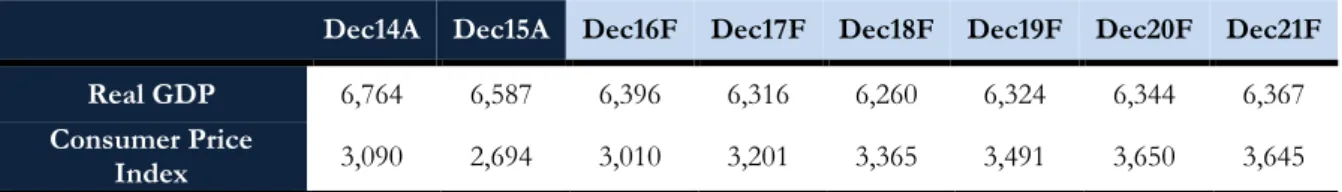
This is the region where real GDP growth rates are higher, mainly due to the large industries and exportations, with a growth rate always superior to 6,2%. CPI was 2,694% in 2015 and it is expected to reach 3,645% in 2021.
23
Table VII - Emerging and Developing Asia Economic Figures (2014-2021; % change)
Dec14A Dec15A Dec16F Dec17F Dec18F Dec19F Dec20F Dec21F
Real GDP 6,764 6,587 6,396 6,316 6,260 6,324 6,344 6,367
Consumer Price
Index 3,090 2,694 3,010 3,201 3,365 3,491 3,650 3,645
According to the World Tourism and Travel Council (WTTC) report of Economic Impact (2016), this region is the one that wil have higher growth rates of travel spending, not only in leisure but also on business travels. The same report also forecasts a rise of almost 5% in the tourism investment on this region, and a 5,4% per year up to 2016.
4.6 Global Lodging Industry Overview
The WTTC forecasts that the direct contribution of travel and tourism to the global GDP will be 3,3% and to rise 4,2% per year, from 2016 to 2026. This same study states that, for this year the leisure travel spending is expected to grow by 3%, while the business travel spending is going to grow 3,9%.
As can be observed on the graph in the Appendix A, following the macroeconomic environment, the amount spent in business and travel tourism is, generally, growing around the globe. We can also see that the regions that are expected to grow the most, according to WTTC report (2016), are Spain, Middle East and Asia. This fact is favourable to MEL once it main operations and new investments are allocated to this areas.
5. Strategic Analysis
In this section we will lead a strategic analysis to MEL in order to identify its competitive position in the industry.
5.1 SWOT Analysis
In the current context it was possible to build up the Strenghts, Weakenesses, Opportunities and Threats analysis to the Company taking in consideration the external
24
and internal environment of MEL in order to better understand its business position. (Consult Appendix C).
5.2 Porter’s Five Forces
The Porter’s Five Forces is an instrument that aims to identify the attractiveness of an industry in the long-term by analyzing the competitive intensity. This model is, however, designed for use at a line-of-business level. In that sense, in this work it will only be applied to MEL’s business, the hotel industry. At Appendix C it can be found the full analysis of MEL’s business.
6. Company Valuation 6.1 Methodology
The valuation of MEL will be based on the group consolidated accounts. According to financial literature, consolidated accounts can be used to evaluate a company that operates in the same sector and with the same business model. Although the Group is present in 40 countries alongside with many different brands, the industry in which it operates and the business model that it uses remains the same.
In valuing the Company we follow the Free Cash Flow to the Firm and the WACC as it is the most used model by general analysts in hotel companies valuation. From a theoretical point of view, the valuation period would extent to infinity, given the longevity of the industry in which MEL operates. However, due to practical reasons (including the difficulty of estimating parameters for longer periods), we considered a limited explicit project period of five years, from the base date 31st December 2016 up to 31st December 2021. The terminal value is then added at the end of this period. Additionally, despite of having business and associated transactions worldwide the currency of the estimated cash-flows it will be euros, to simplify the calculations and because that is the currency presentend in the Annual Reports.
25
6.2 Assumptions 6.2.1 Revenues
MEL’s revenue growth doesn’t depend exclusively on the continued growth of the demand, but are also reliant on the general economic and business conditions worldwide and may fluctuate due to a wide diversity of risks. Due to these facts, to estimate the future growth rates from 2016 up to 2021, it was taken a more conservative approach.
First, we split the total revenues in revenues per region (Spain, EMEA, Asia and America), according to own MEL organization. Then, we used the growth rates forecasted by WTTC for each region and per segment (leisure and business) to forecast the total revenues of MEL, for the next five years.
We estimate, a annual growth, in average of 3,2% and that this year the total revenues will reach around 1 800 millions of euros and 2 100 millions of euros by 2021. These computations and estimates can be found at Appendix D.
6.2.2 EBITDAR
We will use the Earnings Before Interest, Taxes, Depreciation, Amortization and Rental (EBITDAR), instead of EBITDA, once is the parameter used in the valuation of hotel business, once there are significant rental and lease expenses. This parameter was estimated by looking at the average EBITDAR as a percentage of the total consolidated revenues of MEL. We concluded that EBITDAR-to-Sales ratio followed a constant pattern since 2012, so we considered remaining static over the following years as well. We will assume an EBITDAR margin of 25%.
6.2.3 Capital Expenditures, Amortizations and Depreciations
MEL is focused on lightening its asset ownership structure (increasing the weight of hotels under management and franchising) should allow the company to continue to deliver healthy growth levels without significant CapEx commitments. Due to lack of
26
information concerning the values to invest on the next years, capital expenditures were determined as a percent of revenues over the past four years. It is assumed that capital expenditures will converge to the mean, 3%.
While having little information concerning D&A, the future value was determined by averaging D&A as a percentage of the fixed assets from the previous year. It was assumed that D&A/Fixed Assets was 5,20% and remained constant over the forecasting period.
For detailed information regarding each year see Appendix E.
6.2.4 Minority Interests
In average, in the last 4 years, 7% of the net profit of the group is attributed to the minority interest and it is reasonable to assume that a similar percentage continues to be verified on the following years. For valuation purposes, and given the influence in the results of the Group, we will assume that 11% (percentage of the Group net profit of 2015 attributed to minority interests) of the future FCFF are attributed to minority interests.
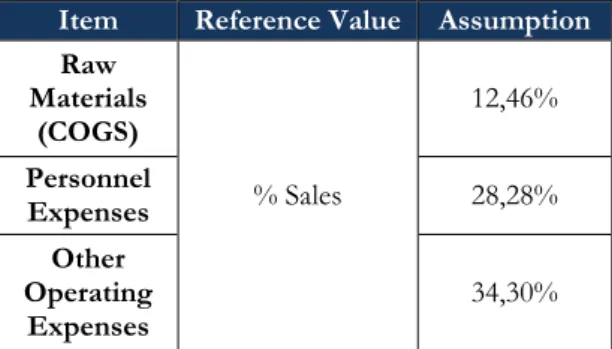
6.2.5 Operating Expenses
This line includes all the expenses that are considered as result of operations MEL, such as Raw Materials (COGS), Personnel Expenses and
Other Operating Expenses. Due to the lack of information regarding those items we assumed that for the following years these parameters will represent the same percentage of the sales as the mean of the past four years.
Item Reference Value Assumption Raw Materials (COGS) % Sales 12,46% Personnel Expenses 28,28% Other Operating Expenses 34,30%
Table VIII - Operating Expenses Assumptions
27
6.2.6 Net Working Capital
For the purposes of FCF and MEL’s valuation, the calculation of the investments in working capital was based on the
historical data and the company's management practices. The assumptions that follow on the next table are made with base on a 4 year average from the ratio between the item and the reference value. The values of each year of the forecast can be found at the Appendix F.
6.2.7 Debt
As we refered on the CapEx and D&A topic, MEL is focused on lightening its asset ownership structure, what means lower CapEx commitements and it’s financial strategy is now focused on debt deleveraging. We estimate a gradual decrease in financial leverage with Debt / EBITDAR to fall from 2,38x in 2016 to 1,64x by 2021. We included in Debt the fair value of derivative financial instruments that are used to hedge against foreign exchange and interest rate risks relating to finance debt.
The full calculation and forecast can be found at Appendix G.
6.2.8 Cost of Capital
Given the chosen methodology to value MEL, the cash-flows were discounted at the appropriate WACC rate. This rate was determined through the Equation 4 expressed in the Literature Review chapter.
Item Reference Value Assumption
Current Assets
Inventories Sales 5,20%
Account Receivables Sales 18,40%
Current Tax Assets Sales 1,62%
Other Current Financial
Assets Sales 2,10%
Current Liabilities
Accounts Payables COGS 22%
Current Tax Liabilities COGS 11,83%
Other Current Liabilities Other Operating Expenses 18,40% Table IX - Net Working Capital Assumptions
28 6.2.8.1 Cost of Equity (ke)
There are many approaches to estimate the cost of equity, the most practical and the most used is the CAPM theory. The CAPM postulates that the opportunity cost of equity is given by the sum of a risk-free rate plus an individual risk premium. The risk premium is the company’s systematic risk multiplied by the market risk premium. We followed a modification of this model that includes the Country Risk Premium (CRP).
Risk-free rate: We have used a rate that refers to the 10 years treasury bond’s yield for
European AAA economies. Therefore, the rate observed at 1st Jun16A of 0,418% was used.
(Source: Bloomberg Database). In our point of view, this rate constitutes a reasonable proxy for a risk-free rate for a company established in any European Member State. These AAA rated European economies have traditionally been regarded as the entities least likely to default.
Beta: According to the Thomson Reuters database, MEL’s beta is 1.11. In this project it is
assumed that the Company’s beta will converge to the industry average of 0.99.
CRP: We have considered a CRP of 2,84%, as presented in Damodaran’s database. This is
the premium associated to the spanish sovereign debt current credit rating of BBB+, as
presented by S&P.
Market Risk Premium: Damodaran provides a spreadsheet with estimates of equity risk
premiums which are updated regularly through the year. As of January of 2016, the equity risk premium for our country of reference, Spain, is 7,41%. Given a risk-free rate of 0,42%, this would imply a market risk premium of 6,99%.
29 6.2.8.4 Cost of Debt (kd)
For this valuation purposes, and in order to reflect the reality of the company, we will use the average cost of debt stated in the last annual report, which is 4,36%.
6.2.8.3 Effective tax rate
For the valuation purposes, we have considered an effective tax rate of 28%. This rate was estimated taking into account the latest changes of the Spanish Laws, where the tax rate varies between 25% and 28%.
We do understand that the effective tax rate incorporated in the model differs from the one that MEL has been effectively paying through the past years. However, the methodology and effective tax rate used in this project are aligned with the generally accepted by financial analysis practioners.
6.2.8.4 Terminal Value
The terminal value of each business captures the estimated value beyond the projected period, brought to present value at the estimated discount rate. We assumed a perpetual growth rate of 3,162% that refer to the forecast of global GDP for 2016. Please consider that we are being conservative in our approach, once this rate is inferior to the one expected from WTTC to the growth of the industry for the next ten years, that is 3,30%.
6.2.8.5 Debt and Equity Weights
At the end of the year 2015, MEL’s market debt-to-value ratio corresponded to 45,95% and the equity-to-value represented 54,05% of the total financing. Since the
30
company is in a deleverage ing process, it is assumed that these ratios will reach the industry average which, according to Damodaran, are 31,66% and 68,34%, respectively.
6.3 Valuation Results
Taking into consideration all the parameters estimated in the previous section, the discount rate (WACC) was estimated for each year of the forecast. The table that follows that components underlying the WACC rate for each year and respective estimated discount rates.
Table X MEL's WACC
COST OF EQUITY Dec16F Dec17F Dec18F Dec19F Dec20F Dec21F
Rf 0,418% 0,418% 0,418% 0,418% 0,418% 0,418% CRP 2,84% 2,84% 2,84% 2,84% 2,84% 2,84% MRP 7,0% 7,0% 7,0% 7,0% 7,0% 7,0% Beta 1,11 1,09 1,06 1,04 1,01 0,99 Cost of equity [Rf + β(Rm-Rf) + CRP] 11,02% 10,85% 10,68% 10,52% 10,35% 10,18% COST OF DEBT Cost of debt 4,36% 4,36% 4,36% 4,36% 4,36% 4,36%
Marginal tax rate 28,0% 28,0% 28,0% 28,0% 28,0% 28,0%
After-tax cost of debt 3,1% 3,1% 3,1% 3,1% 3,1% 3,1%
WACC
Weight of equity 56,4% 58,8% 61,2% 63,6% 66,0% 68,3%
Weight of debt 43,6% 41,2% 38,8% 36,4% 34,0% 31,7%
WACC 7,59% 7,67% 7,76% 7,83% 7,89% 7,95%
Note that the discount rates are different from year to year. This reflects the assumption that some of the values will revert to the industry averages, such as beta and the weight of debt and equity. We assumed that this values will decrease over time, therefore the operational risk of the company will also decrease in the future.
Table XI Projected Cash Flow Statement
Currency € Dec16F Dec17F Dec18F Dec19F Dec20F Dec21F Terminal
EBIT(1-marginal tax rate) 151 860 431 161 182 403 169 423 978 177 764 870 186 279 525 194 981 607 194 981 607 D&A 94 440 893 91 073 774 89 507 764 88 113 801 86 798 212 85 552 051 85 552 051 Net increase in NWC 287 420 284 9 486 765 9 784 395 10 091 363 10 407 961 10 734 492 10 734 492 CAPEX 64 390 475 64 331 248 64 272 075 64 212 957 64 153 893 63 003 328 63 003 328 FCFF (105 509 435) 178 438 164 184 875 272 191 574 351 198 515 882 206 795 837 206 795 837
31
The estimated enterprise value for MEL in 2015, is 3 727 million euros, where 659 millions results from the present value of future cash flows and 3 067 millions comes from the terminal value, as can be seen at Table XII. MEL’s equity value is achievied by adding cash and marketable securities, subtracting total debt, minority interests, provisions and non-core assets.
Table XIII Enterprise and Equity Value & Share Price
Terminal growth rate 3,16%
Perpetuity WACC 7,95% Terminal value 4 454 741 050 PV of terminal value 3 067 457 349 NPV of FCFF 659 783 868 Enterprise value 3 727 241 217 Enterprise value 3 727 241 217 Net debt 575 823 338 Minority Interests 12 561 992 Provisons 48 227 839 Non-Core Assets 211 971 548 Value of equity 2 878 656 500
No. of shares outstanding 229 700 000
Equity value per share 12,53
Price Target 12,53€
Taking into account this outcome, the company appears to be undervalued. These results are in agreement with the general consensus estimated by analysts. The target share price obtained for 2016 indicates an undervaluation of 26% given the lastest stock price of €9,98 (18th July 2016).
The value obtained wasn’t precise due to the valuation based in the determined economic and sector assumptions. Furthermore, a sensitivity analysis will then be performed to allow greater certainty estimations with a wide range of values in which the given price can take.
Source: Author’s Calculation
32
7. Relative Valuation 7.4.1 Methodology
In this section we perform a relative valuation in order to compare MHI with its peers and confirm the results obtained in DCF valuation. We applied the forward valuation for multiples as the future estimates are more accurate than the historical figures, incorporating more information in valuation. We used 2016 forecasted multiples from Thomson Reuters while MHI’s multiples are from own estimates.
EV multiples are useful when comparing companies with different leverage positions. We will use also EBITDAR multiples, that are multiples currently used in business where there’s significant lease and rental expenses, such as hotel companies.
7.4.2 Selection of Peers
According to Dittman and Weiner (2005), valuation errors are smaller if comparable are chosen from the same continent, particularly when valuing companies headquartered in Belgium, Finland, France, Germany, Italy, the Netherlands, Portugal and Spain. The EU15 and OECD is optimal minimizing the mean absolute error.
In order to guarantee that candidate companies have a business structure as similar as possible, they have to fulfil a number of eligibility criterions: European Company, Worldwide Operations, Quoted. Finally, the peers selected were the groups NH, Accor SA, Intercontinental, Millenium & Copthorne and Dalata.
7.4.3 Results
Peer companies follow different strategies and exhibit different capital structures. In order to address possible biased multiples, we average the price targets from different multiples, resulting in a more reliable relative valuation.
33 Table XIV Valuation with Multiples
EV/Sales EV/EBITDAR EV/EBIT P/E P/CF
Multiple 2,67x 8,17x 13,48x 14,83x 9,72x
EV (EUR' 000) 4 796 818 3 677 474 2 843 618 N/A N/A Net Debt (EUR' 000) 575 823 575 823 575 823 N/A N/A Minority Interests (EUR' 000) 12 562 12 562 12 562 N/A N/A Provisions (EUR' 000) 48 228 48 228 48 228 N/A N/A Non-Core Assets (EUR' 000) 211 972 211 972 211 972 N/A N/A Market Equity (EUR' 000) 4 044 689 2 925 345 2 091 489 N/A N/A
Target Price 17,61 € 12,74 € 9,11 € 7,37 € 6,14 €
Average Target Price 10,59 €
We can note large discrepancies in the values obtained for the target price using different multiples. Still, the average result of the relative valuation lead us to the same conclusion as in DCF’s.
8. Sensitivity Analysis
To assess the robustness of the target price estimated in the previous chapter and how it is affected by changes in the main drivers established we runned a sensitivity analysis to the cost of capital, terminal value growth rate, market risk premium and country risk premium. This analysis is presented by showing the change in the price target due to a percentual change in the chosen variable. With the results obtained we can reinforce the idea that MHI’s shares are quite sensitive to these variables.
In Appendix I, it is shown the impact on the price by changing, individually and simultaneously, the chosen variables.
9. Conclusions
Taking in consideration the role of valuation in finance, there are plentiful methods to determine the value of a firm. As considered all over the literature review, each technique finds its use suitable in different situations and depending on the characteristics of the firm. Nevertheless, the same value can be obtained from each model if consistent assumptions are considered.
34
In summary, and taking into account our valuation through the relative valuation and DCF model, we can conclude that Melia’s stock price of €9,98 at 18th July, 2016 is
undervalued. Therefore it is our belief and we would start a buy recommendation for Melia International shares. Probably, Financial Markets will recognize the company value and, consequently, its price per share are going to increase, offering returns of around 26%.
The results obtained are aligned with the general consensus of analysts’ opinion – a buy recommendation. Nevertheless, it is important to mention, that this valuation was based on a conservative approach and therefore, some of the assumptions may be uncertain and not take place in the future.