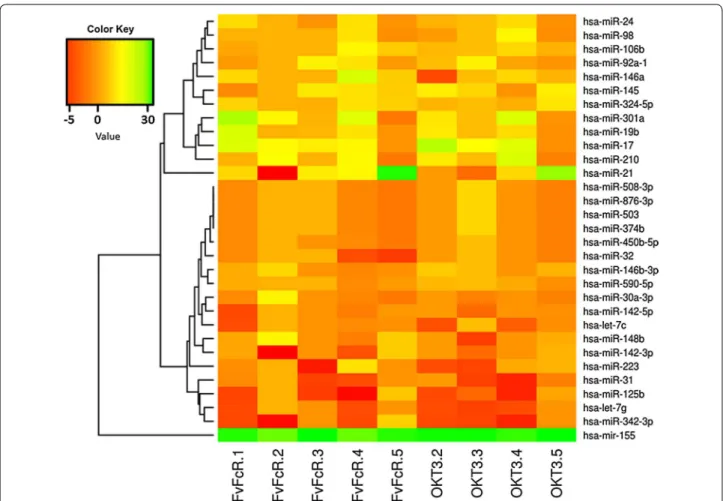
MicroRNA expression profiles in human CD3
Texto
Imagem
Documentos relacionados
Normal cells, human peripheral blood mononuclear cells (PBMC), murine fi broblasts cell lines (L929 and V79) and canine kidney epithelial cells (MDCK) were used to evaluate
Higher T cell proliferation has been observed in cord blood- derived mononuclear cells compared to peripheral blood-derived cells in response to one of the major milk allergens
Estas ondas são essencialmente afetadas por interação com o fundo e empolamento, chegando à linha de costa com altura maior do que a observada em águas profundas (aumentam
Seroprevalence and molecular epidemiology of human T-cell leukemia virus type 1 (HTLV-1) and HTLV-2 in blood donors from Dakar, Senegal.. Prevalence of antibody to human T
Results of this study suggest lymphocyte count in peripheral blood is not equivalent to CD3 + T cell count determined by flow cytometry as far as anti-T cell polyclonal
3: contour plots from apoptotic cells after monocyte infection by dengue virus (DENV)-2: monocyte-enriched human peripheral blood mononuclear cell (PBMC) was incubated for two
IFN- g mRNA expression was evaluated in nonstimulated peripheral blood mononuclear cells (PBMC) of HIV-infected and seronegative individuals using quantitative competitive
(A) Lambda Hind; (B) 100 bp (Gibco ); (C) DNA of non-irradiated MDAMB-231 cell; (D) DNA fragmentation of MDAMB-231 treated with 10% methanol; (E) DNA fragmentation of MDAMB-231
