© 2020 The Author(s)
This work is licensed under the Creative Commons Attribution 4.0 International (CC BY 4.0). To view a copy of this license, visit https://creativecommons.org/licenses/by/4.0/
Exploring online prices with an advance booking horizon on
Booking.com
Gloria Sánchez-Lozano
1*, Luis Nobre Pereira
2and Esther Chávez-Miranda
31 Facultad de Ciencias Económicas y Empresariales, Departamento de Economía Financiera y Dirección de
Operaciones, Universidad de Sevilla, Campus de Ramón y Cajal, 41018 Sevilla, Spain; Email: [email protected].
2 Research Centre for Tourism, Sustainability and Well-being (CinTurs) & Escola Superior de Gestão, Hotelaria e
Turismo, Universidade do Algarve, Campus da Penha, 8005-139 Faro, Portugal; Email: [email protected]
3 Facultad de Ciencias Económicas y Empresariales, Departamento de Economía Financiera y Dirección de
Operaciones, Universidad de Sevilla, Campus de Ramón y Cajal, 41018 Sevilla, Spain; Email: [email protected]; Phone: +34 954551606
*
Corresponding authorAbstract
The online market enables hotels to enhance their visibility and drive up their revenue. This study analysed both the average room price and price count (i.e. the sum of the number of prices that hotels offer) on Booking.com for a period of 300 days prior to check-in, with data classified by official hotel category. Hotels’ number of rooms, day of the week, room type, room capacity (i.e. maximum number of guests per room) and length of stay were also tracked. This research was based on a stratified sample of hotels gathered by using random sampling and proportional allocation, as well as defining the strata by hotel categories. The dataset included 1,353,751 records. The results reveal that channel management activities are an important area of hotels’ operations, which generate a considerable workload in terms of the time devoted to updating data and other related tasks. However, hotels’ participation in online channels does not always match their importance in the market as measured by their relative number of rooms. Most of the variables under study have a significant positive impact on prices, except for hotels’ number of rooms, which failed to follow any discernible pattern of influence.
Keywords: pricing, online distribution channel, channel management, booking horizon, revenue management,
hotel
Citation: Sánchez-Lozano, G., Nobre Pereira, L. & Chávez-Miranda, E. (2020). Exploring online prices with an
Introduction
Implementing revenue management in the hotel industry requires managers to determine ‘the right price for the right product for the right customer’ (Smith, Leimkuhler & Darrow, 1992) ‘at the right moment’ (Cross, 1997; Kimes, 1989; Kimes, Chase, Choi, Lee & Ngonzi, 1998; Kimes & Singh, 2008) and through the right distribution channel. When correctly formulated, this decision mix generates the maximum possible revenue and, where possible, extracts the greatest profit from hotels’ perishable assets or available resources (Baker & Collier, 2003; Donaghy, McMahon & McDowell, 1995; Guadix, Onieva, Muñuzuri & Cortés, 2011). Time is an unambiguously essential dimension of revenue management, which has been shown to be highly significant because a proper use of time allows managers to establish resource distribution and determine selling conditions in advance. However, time also increases revenue management’s complexity (Maier, 2012) and the number of decisions to be made. In the lodging sector, a resource or inventory unit (e.g. room night) and its related components (e.g. room type and length of stay) and/or conditions can be offered to potential customers up to a year in advance (Cross, Higbie & Cross, 2009; Schütze, 2008) in order to generate bookings up to the time that the service is actually provided. When hotel companies such as Marriott International (Hormby, Morrison, Dave, Meyers & Tenca, 2010) and Carlson Rezidor (Pekgün, Menich, Acharya, Finch, Deschamps, Mallery & Sistine, 2013) publish or update their prices and room availability daily, these hotel groups could benefit from an analysis of the relationship between prices and booking pace (i.e. booking on hand registered along the booking horizon prior to customers’ arrival). Researchers have found evidence of a relationship between advanced time periods and published prices (Choi & Kimes, 2002). This information is used to obtain new forecasts and update prices and availability on all hotel channels. Revenue managers – or the individuals responsible for these management activities – must define and use appropriate strategies and tactics during these periods to improve their hotels’ level of profitability. Therefore, managers have to learn more about the way that hotels’ resources and features evolve throughout the entire booking period preceding check-in dates.
Price is considered to be one of the main variables in revenue management (Guillet & Mohammed, 2015; Ropero, 2011). The existing research has focused strongly on pricing applied in distribution channels, which has been widely studied to explain customer behaviour from a demand perspective (Liu & Zhang, 2014; Schamel, 2012; Soler et al., 2019) and, to a lesser extent, a supply perspective (Hung et al., 2010; Kim et al., 2016; Kreeger & Smith, 2017; Thrane, 2007). Significant changes have occurred in the overall pattern of hotel distribution that require further study (Law, Leung, Lo, Leung & Fong, 2015). In particular, channel management is an increasingly important part of hotel distribution and an emerging line of research within the field of revenue management (Domingo-Carrillo, Chávez-Miranda & Cubiles-de la Vega, 2017; Ivanov & Zhechev, 2012; Kimes, 2011).
The online booking market is currently a source of revenue generation. Nielsen (2016) reports that the category of ‘travel products and services’ is ranked in the top five (i.e. third place) for all regions worldwide (i.e. Africa, Asia-Pacific, Europe, Latin America, the Middle East and North America). Online channels are expected to become increasingly important in the future because of their popularity among online customers (Guo, Ling, Dong & Liang, 2013). The online travel agency Booking.com is recognised as one of the main hotel distribution channels and, together with Expedia, this site has become a major driver of change in this area.
The present study sought to explore both hotels’ room prices and price counts (i.e. the number of prices or entries) regarding offers provided through online distribution channels. These offers are made, depending on product features, over a booking horizon of 300 days prior to check-in dates. Booking.com
was selected as the source of data because it is a key player, accounting for 60% of all bookings made in Europe (Tom Dieck, Fountoulaki & Jung, 2018).
From an academic perspective, this research aimed to enrich the literature on revenue management through an in-depth analysis of the online hotel room supply profile, with a special focus on two crucial variables of revenue management implementation: advance prices and total counts of prices. An urban destination was chosen as a case study. The research included taking the first steps towards conducting an analysis of combined offers of prices and features while considering an extensive booking horizon. For practitioners, the results provide information that can support the decision-making processes related to revenue management. The ability to analyse average prices by feature and hotel category could further improve managers’ ability to make appropriate decisions.
This paper is structured into five sections. The next section presents the literature review. The third section sets out the methodology and describes the data retrieval and usage processes. Section four then describes the results. The conclusions offered in the final section highlight this research’s principal achievements and theoretical contributions, as well as proposing future research directions.
Literature review
This study focused on hotels’ price policies applied in online distribution channels. Pricing has long been considered a core part of revenue management (Baker & Collier, 1999; Chiang, Chen & Xu, 2007; McGill & van Ryzin, 1999; Weatherford & Bodily, 1992), but channel management is a relatively new area of research that has only recently gained relevance, especially in terms of hotels (Domingo-Carrillo
et al., 2017; Guillet & Mohammed, 2015; Ivanov & Zhechev, 2012). Channel management is also an
emerging field of study that has increasingly influenced revenue management practices and trends (Wang, Yoonjoung Heo, Schwartz, Legohérel & Specklin, 2015; Yeoman & McMahon-Beattie, 2017). Efficient distribution channel management must be implemented in complex scenarios (Kimes, 2016) that require both more time devoted to these activities and awareness of their impacts on costs. The Internet has radically changed the way that hoteliers inform customers about prices and room availability, but, simultaneously, this has entailed the assumption of new costs (Vinod, 2004). In addition, monitoring and controlling channel activities needs to be part of managing hotels in this competitive, constantly changing environment (Josephi, Stierand & van Mourik, 2016). Despite these challenges and channel management’s importance and impact on costs and revenue management performance measures, a gap still exists in the research in this area, especially from a supply perspective. Vives, Jacob and Payeras (2018) describe the current situation as a ‘new era of online distribution channels’. The online market has grown significantly, facilitating access to information and connections with customers. When these channels are properly utilised, opportunities arise for increasing revenues and profits (Talón-Ballestero & González-Serrano, 2013). Hotels already distribute approximately one-third of their bookings through the online market, and this figure may grow from 60 to 70% in the coming years (Law et al., 2015).
Recent studies have used the data available in distribution channels and, specifically, on Booking.com to examine the behaviour of prices offered (Abrate & Viglia, 2016; Ivanov & Piddubna, 2016; Oses, Gerrikagoitia & Alzua, 2016; Pawlicz & Napierala, 2017). However, the existing research has only considered a maximum advance booking period of 90 days, which is significantly smaller than the 300-day period covered by the present study. As far as the literature review could determine, this study’s inclusion of hotels’ offer or price counts is also a novelty. Price count provides insights into the total and relative value of resources’ – or perishable assets’ – distribution through online channels. These
figures can be considered an indicator of the importance that hoteliers give to each of their online offers, thereby providing valuable information.
Analyses of room prices and price counts according to booking conditions across the entire advance booking horizon enable general predictions to be made about hotels’ situation on any given day (i.e. the check-in date). Revenue managers can benefit from this overview, taking advance actions to achieve improved revenue. Thus, this research analysed both the average prices and price counts published on Booking.com based on a booking horizon of 300 days before customers’ arrival dates. In addition, the data analyses considered hotels’ official category and various variables published in the selected online travel agency, namely, day of the week, room type, number of guests per room and length of stay. Methodology
This study focused on hotels located in Seville, a city in southern Spain famous for its rich cultural heritage. The destination was chosen for its greater importance compared to other Spanish cities. Seville is especially predominant in tourism as the city has been consistently ranked between third and sixth among all urban destinations in Spain, according to Exceltur (2013, 2016, 2017a, 2017b 2018). Its current prominence has recently been confirmed by being ranked first in Lonely Planet’s (2018) cities category. Regarding the hotels’ profile, Spain’s official hotel rating system classifies establishments into five categories indicated by the number of stars awarded, with 1 star being the lowest category and 5 stars the highest. Previous studies on revenue management in Spain have mainly focused on higher categories, that is, hotels with 3-, 4- and 5-star ratings (Chávez-Miranda, 2005; Domingo-Carrillo, 2016; Oteo-Iturmendi, 2013; Talón-Ballestero, 2010). This classification system was used in the present research.
The hotel study population was first identified to facilitate the selection of a representative sample. Hostelmarket’s (2014) hotel census was compared to and completed with the hotels listed on Booking.com for Seville. The most recent census also provided the required information on hotels’ official star ratings, which meant that the population could be divided into 3 strata (i.e. 1 per hotel category). The total population was 94 hotels: 38 3-star, 51 4-star and 5 5-star hotels. The size of each strata of the sample was determined by a random sampling method with proportional allocation (5% margin of error; 95% confidence level; p = q). The resulting proportional allocation of the final sample of 31 hotels was, therefore, as follows: 12 3-star, 17 4-star and 2 5-star hotels. IBM SPSS Statistics software was used to obtain 3 independent random samples. This sampling method ensured that the results could be extrapolated both to hotel categories and the selected urban destination as a whole.
To gather the required information, the data were retrieved from Booking.com by emulating the behaviours of consumers who visit the website to look at hotel prices. The dataset obtained was broadened to include hotels’ official hotel star ratings and number of rooms. Following previous related studies’ recommendations, an analysis was conducted of the main variable (i.e. price) and its influence 300 days in advance of check-in dates. The final dataset included room rates and offer-related conditions, namely, day of the week, type of room, number of guests per room and length of stay. The data were collected on 20 January 2017. No missing values were detected, and all values for each variable were collected.
The variables covered by this study are presented in Table 1. Hotel category contains information about the sample hotels’ official star rating from 3 to 5 stars. The number of rooms was used to measure the hotels’ size, which ranged from 7 to 437 hotel rooms. The day of the week is a time variable that refers to the day of the week for which a specific price value is offered, so this variable ranges from Monday to
Sunday. The variable of type of room enables the rooms offered to be put into similar categories of rooms: Standard, Superior, Superior Plus, Junior Suite and Suite. The number of guests per room or room PAX refers to the maximum number of guests allowed in a room, which went from 1 to 4. The length of stay gives information about the minimum number of nights that customers must stay in hotels for specific price offers to be valid, with values running from 1 to 4 hotel nights.
Table 1. Summary of independent variables and their ranges Variables Categories
Hotel category 3-, 4- and 5-star hotels Number of rooms 7–437 hotel rooms
Day of the week 1–Monday, 2–Tuesday, 3–Wednesday, 4–Thursday, 5–Friday, 6–Saturday, 7– Sunday
Type of room 1–Standard, 2–Superior, 3–Superior Plus, 4–Junior Suite, 5–Suite Number of guests 1–4 guests
Length of stay 1–4 hotel nights
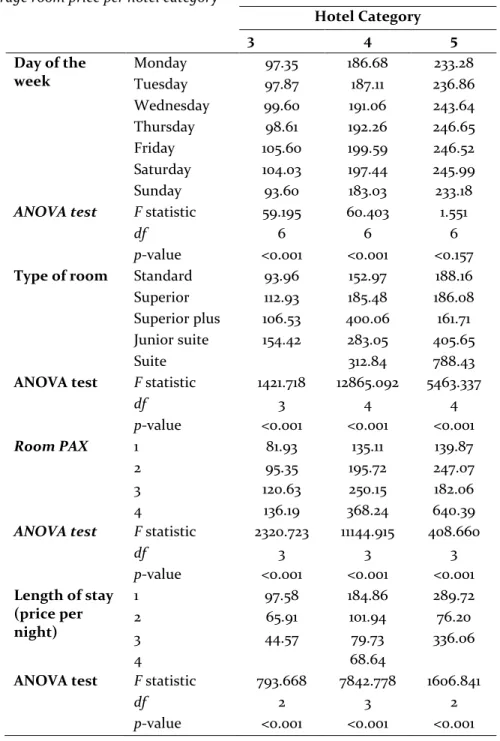
In the selected set of variables, only type of room is a recoded variable. Hotels in Seville use more than 80 different types of room or ways of naming a room. On occasion, rooms that are almost identical in physical terms are named differently, which made the natural variable impractical. Based on two main criteria (i.e. probable room size or space and the room style, amenities and services included), all these room labels were reduced to five categories. Given this study’s aims, the results are presented in two ways: (1) average room price, which was calculated directly from the mean value of the variable of room price and (2) room price count, which is the sum total of prices retrieved from the Booking.com website. Additional results based on the hotels’ category are given in Table 2.
A simple regression model was estimated to explain the relationship between room price and each independent variable. The model with the best fit was chosen based on the R-squared (R2) value.
Number of rooms was the only variable not found to have a clear relationship with room price, it also presented numerous categories, so the results for that variable are not showed in Table 2 above. Finally, in line with similar previous research on price behaviour in distribution channels (Ivanov & Piddubna, 2016), the analysis of variance (ANOVA) and t-test for independent samples were applied to check for differences in average room prices between the independent variables.
To summarise, the dataset contained 193,393 lines for each of the analysed variables including room price, which resulted in 1,353,751 records. This volume of data is remarkable for such a relatively small sample of hotels in Seville (31), which were able to produce a vast price offer database in a single online distribution channel on one day. These data were processed using both Microsoft Excel (2016 version) and IBM SPSS Statistics (version 24) software. In addition, Microsoft Power BI Desktop (version 2.73.5586.984) software was used to generate a dashboard with the categories, average room prices and maximum and minimum values per variable.
Results
Hotel category
Given the 300-day booking horizon prior to check-in dates, an overview of the data on prices hotels’ offered through the selected online distribution channel shows an average room price of €177.80 (euros) for this urban destination. Figure 1 shows the average room prices by hotel category (i.e. 3–5 stars). The solid line indicates the average room price for each category, while the bars give the price count. The trendline (i.e. the dotted line) is discussed in greater detail below.
Table 2. Average room price per hotel category Hotel Category 3 4 5 Day of the week Monday 97.35 186.68 233.28 Tuesday 97.87 187.11 236.86 Wednesday 99.60 191.06 243.64 Thursday 98.61 192.26 246.65 Friday 105.60 199.59 246.52 Saturday 104.03 197.44 245.99 Sunday 93.60 183.03 233.18
ANOVA test F statistic 59.195 60.403 1.551
df 6 6 6
p-value <0.001 <0.001 <0.157
Type of room Standard 93.96 152.97 188.16
Superior 112.93 185.48 186.08
Superior plus 106.53 400.06 161.71 Junior suite 154.42 283.05 405.65
Suite 312.84 788.43
ANOVA test F statistic 1421.718 12865.092 5463.337
df 3 4 4 p-value <0.001 <0.001 <0.001 Room PAX 1 81.93 135.11 139.87 2 95.35 195.72 247.07 3 120.63 250.15 182.06 4 136.19 368.24 640.39
ANOVA test F statistic 2320.723 11144.915 408.660
df 3 3 3 p-value <0.001 <0.001 <0.001 Length of stay (price per night) 1 97.58 184.86 289.72 2 65.91 101.94 76.20 3 44.57 79.73 336.06 4 68.64
ANOVA test F statistic 793.668 7842.778 1606.841
df 2 3 2
Figure 1. Average room price and price count by hotel category
Average room prices behave as expected with respect to the hotel categories. The price increases significantly as the star rating rises (F = 16,135.8; degrees of freedom1 [df1]= 2; df2 = 193,390; p-value <
0.001). However, this increase is not proportional since the average value for four-star hotels is almost double of the value found for the lowest category considered (92.0%). The mean room price offered for 5-star hotels, in turn, rises only by 26.0% in comparison with the preceding category. The average increase between categories is €70.60 (41.3%), which is 30 to 36% higher than the increase found by researchers in the Polish hotel industry (Pawlicz & Napierala, 2017). The higher the hotel category, the broader the price variability. In all cases, the price range is quite wide, that is, from €566.10 (3 stars) to €2,405.50 (5 stars). Notably, 3-star hotels sometimes ask prices that could be considered more suitable for 4-star hotels. Both 3- and 4-star hotels offer prices starting from similar minimum values (€33.90 and €32.40, respectively), but the maximum prices offered by 3-star hotels, for example, include values as high as €600.00. In addition, the highest category hotels offer rooms at €94.50, which could be considered a more appropriate price for 4-star establishments.
Regarding the room price count, four-star hotels present the highest volume of price offer. They dominate the Seville market with over 66.6% of the total price count. This percentage exceeds the proportion of 4-star hotels in the sample (54.8%). Three-star hotels (price count of 26.0% out of 38.7% of the sample) and 5-star hotels (7.4% out of 6.5%) produce a lower percentage of price offers. Despite the well-documented dependence of 3-star hotels on Booking.com and the 38.7% they represent in the sample, their share in the price offer’s total volume is only 26.0%
The average room price trend according to hotel category was estimated with a logarithmic function (R2 = 0.9996). The results clearly indicate that, as the number of stars rises, the average room rate also
increases. This relationship was set out in Equation (1), in which y refers to the average room price and
x to the hotel category (x=1 for 3 stars; x=2 for 4 stars; x=3 for 5 stars):
y = 128.9ln(x) + 100.02. (1) 50 203 128 855 14 335 99,44 € 190,96 € 240,63 € 0 20 000 40 000 60 000 80 000 100 000 120 000 140 000 0 € 50 € 100 € 150 € 200 € 250 € 300 €
3-star hotels 4-star hotels 5-star hotels
R o o m Price Co u n t A ve rag e R o o m Price
Number of rooms
The average room price was examined in relation to the number of rooms available at each hotel included in the study (see Figure 2). Some of the average room prices given are the result of multiple hotels having exactly the same size (2 hotels with 7 rooms, 2 hotels with 23 rooms and 2 hotels with 81 rooms). The data do not appear to show any particular behaviour pattern regarding hotel size and average room prices. However, the ANOVA results show that the average room price varies significantly by hotel size (F = 5,612.9; df1 = 26; df2 = 193,366; p-value < 0.001). When the results were analysed in detail,
various individual cases were identified, which are discussed further below.
In general, the maximum values correspond to 33- and 189-room hotels. Both are 4-star hotels, although they differ substantially in size (156 rooms). For example, the smallest hotel with 7 rooms sells these at a higher average rate than a 365-room hotel.
Figure 2. Average room price and price count by number of rooms
Regarding the room price count, the percentage expected for each hotel’s share is 3.2% of the total overall volume. However, this figure fails to measure the importance that each hotel places on its offer. Thus, the present analysis needed to consider the number of rooms’ influence on the number of price offers. To this end, the hotels’ fair share was calculated because this is an indicator used by revenue managers to compare hotels’ size (i.e. measured by number of rooms) with their competitive set of 4 to 7 hotels. The fair share can be calculated in an urban context by dividing the number of rooms in each hotel by the total number of rooms in the sample, which gave the expected average hotel offer for the current sample as 3.7%, which is reasonably similar to the expected offer (i.e. 3.2%).
One further aspect that needs to be highlighted is the combined analysis of higher prices and price volume. The results include the individual cases mentioned previously. A third of the hotels (10) currently offer prices that exceed their expected percentage (a fair share above 3.7%), but only 3 – all 4– star hotels – offer a more advantageous average room price ranging from €200 to €250. One case is particularly interesting since this hotel is responsible for over 19% of the volume of price offers (i.e. 5 times more than the expected percentage). This anomaly can be partially explained by the hotel’s size
37 912 46 046 41 417 68 018 €158,46 €138,68 €173,28 €171,46 0 10 000 20 000 30 000 40 000 50 000 60 000 70 000 80 000 €-€20 €40 €60 €80 €100 €120 €140 €160 €180 €200 Less or equal to 50 rooms
From 51 to100 From 101 to 200 Over 201 rooms
Roo m Price Co u n t Av era ge Roo m P rice
(437 rooms) since it is the largest of all the hotels considered. An examination of these cases based on prior research’s results for the same destination (Chávez-Miranda, 2005) suggests that a mindful pricing strategy, tactics and, in general, proactive revenue management explain why these 3 hotels meet the 2 criteria of a higher volume of prices offered and success in terms of higher average prices.
A second set of special cases was also be identified. The 2 hotels with the highest average prices (€400.00 to €465.00) offer fewer prices than expected (1.3% and 2.1% of the price count), but these establishments are different sizes (33 and 189 hotel rooms, respectively). A further examination of the present data and additional information about these specific cases revealed that their high average prices are unrelated to either of these hotels’ number of rooms or relative importance (i.e. their price offer) in the online distribution channel in question. The elevated prices may be due to price differentiation based on special hotel facilities as one is a boutique hotel and the other – with the highest average rate – is a five-star hotel.
Day of the week
The results also confirmed that the average room price behaves differently depending on the day of the week (F = 64.5; df1 = 6; df2 = 193,386; p-value < 0.001). Figure 3 shows that prices rise at weekends and
falls on weekdays (t = -17.7; df = 193,391; p-value < 0.001). An in-depth analysis (see Table 2 above) showed that the average room price significantly differs in all three hotel categories according to the day of the week. A similar analysis was also carried out for the remaining variables because the average room price varies significantly for hotels of different categories.
Figure 3. Average room price and price count by day of the week
A fictitious boundary was set at an average room price of €175.00, revealing two different rate categories. The average price offered for weekend days (Friday and Saturday) is €178.50, and the average price for weekdays is €167.90 (the remaining days), with a difference between the two rates of €10.60. This result is not unexpected since the primary users of Booking.com are tourists on holiday (Law et al., 2015). However, further analysis identified an additional price class in the middle of the week, so three price clusters were ultimately differentiated: (1) start of the week, (2) mid-week and (3) weekend. Average prices start a gradual upward trend on Wednesdays and Thursdays – immediately before the most significant change on Fridays, which signals the start of the weekend. Hotels in Seville tend to set higher
164,49 € 166,91 € 166,93 € 170,02 € 171,29 € 179,07 € 178,01 € 26 000 26 500 27 000 27 500 28 000 28 500 29 000 0 € 20 € 40 € 60 € 80 € 100 € 120 € 140 € 160 € 180 € 200 €
Sunday Monday Tuesday Wednesday Thursday Friday Saturday
R o o m Price Co u n t A ve rag e R o o m Price
prices for the weekend (Friday and Saturday nights). The lowest average price is associated with Sundays, which marks the beginning of the weekday period.
Notably, these hotels’ prices remain stable during the week, and the count of prices offered per day of the week is similar in all cases (from 14.0% to 14.6%). Average room price by day of the week was estimated by applying a polynomial function (R2 =0.9164), represented by Equation (2):
y = 0.2113x2 + 0.7828x + 163.6 (2)
in which x is the day of the week (from x=1 for Monday to x=7 for Sunday).
Type of room
The average room price’s behaviour proved to be logical and in line with the type of room posted (see Figure 4). The price rises significantly as the room category improves (F = 19,530.3; df1 = 4; df2 = 193,388;
p-value < 0.001). A similar conclusion was drawn from the results of an analysis by hotel category (see
Table 2 above), namely, that prices progressively increase at an average of €78.40 for each room type. However, two of the room type changes are more pronounced, with above-average increases: changes from Superior to Superior Plus (€89.10) and from Junior Suite to Suite (€172.80). The smallest increase is from Superior Plus to Junior Suite (€6.40). The two largest changes can be explained by a jump in the room size, given that the Superior Plus category involves a floorspace and services similar to apartments, or a qualitative change to privileged services in the case of Suites. Superior Plus and Junior Suite rooms tend to be comparable in size and have analogous services, so these rooms are sold at similar prices.
Figure 4. Average room price and price count by type of room
Regarding the data on the volume of total price offers, over 85% of all prices posted are set for Standard and Superior room types (52.1% and 33.0%, respectively). As expected, these rooms are the ones most often available. Only under 3% of the entire price offer corresponds to Suites, followed by Superior Plus (3.2%). These low percentages can be explained for the former room type by how not all establishments provide luxury rooms of this type and, when they do, they only represent a small percentage of the total
100 817 63 734 6 266 17 730 4 846 130,92 € 176,03 € 265,16 € 271,52 € 444,35 € 0 20 000 40 000 60 000 80 000 100 000 120 000 0 € 50 € 100 € 150 € 200 € 250 € 300 € 350 € 400 € 450 € 500 €
Standard Superior Superior
Plus
Junior Suite Suite
R o o m Price Co u n t A ve rag e R o o m Price
room offer. A similar explanation can be given for Superior Plus rooms, as this category includes quite specific types of rooms with physical features usually found in tourist apartments, for example, spacious rooms able to accommodate families or small groups of guests, with several rooms at the same price and cooking facilities.
The behaviour of average room prices (y) according to type of room approximately corresponds to an exponential function (R2 = 0.9552). Equation (3) shows how prices increase as room size grows and the
included services and/or their quality rise:
y = 99.687e0.2877x (3)
In this equation, x refers to the type of room (from x=1 for Standard to x=5 for Suite).
Number of guests
The average room price behaved as expected according to the maximum number of guests that rooms can accommodate (F = 6,275.5; df1 = 3; df2 = 193,389; p-value < 0.001). Despite this tendency to rise with
the room PAX, the increments by which prices change are not directly proportional to the increase in the number of PAX (see Figure 5). Table 2 above shows a significant rise in the average room price for each hotel category as the number of guests allowed in a room rises.
Figure 5. Average room price and price count by number of guests allowed in rooms
The average increase between categories is €40.70. The horizontal axis (see Figure 5 above) shows the actual size of the increments by which prices change according to room capacity. The average room price increases 45% (€55.00) in the first shift from one to two guests. The smallest increase (€23.70) is in the second change from 2 to 3 room PAX, so the average room price rises less than expected. This anomaly could be due to the common practice in the hotel industry of fitting an extra bed into more spacious double rooms in order to sell them as triple rooms, allowing them to sell the same physical space at a slightly higher price. For the last shift in room PAX from 3 to 4 guests, the average price increases by the greatest increment (€84.40). This jump can be explained as linked to the characteristics
48 402 109 192 28 956 6 843 122,29 € 177,28 € 200,95 € 285,25 € 0 20 000 40 000 60 000 80 000 100 000 120 000 0 € 50 € 100 € 150 € 200 € 250 € 300 € 1 2 3 4 R o o m Price Co u n t A ve rag e R o o m Price RoomPAX
of these rooms, which are the most spacious and offer the best facilities and/or services. For instance, Superior Plus rooms include cooking facilities, Junior Suites have access to special facilities and penthouse suites contain several rooms and executive lounge access.
As mentioned previously, the average room price’s incremental increase is not proportional to changes in room PAX. If hoteliers seek to devote more of their establishments to four room PAX and offer privileged services, these strategies could contribute to prices being set that are higher but not proportionately so. This pattern might explain why Seville’s accommodation providers concentrate on rooms of fewer than 3 guests (96.5%). The most common offer is 2 room PAX as demonstrated by the corresponding volume of price offers (56.5%). These rooms are followed in terms of availability by single-use rooms (25.0%) and 3 room PAX (15.0%), putting 4 room PAX (3.5%) in last place.
Finally, the results show that the average price per person falls with each rise in PAX number (€122.30, €88.60, €67.00 and €71.30). In general, the more people allowed in a room, the lower the price is per person. While the price per person increases for rooms that can accommodate 4 people, the change in price per person is marginal (€4.32). This minimal increase is probably due to the type of room that offers maximum capacity. Rooms with 1, 2 or 3 PAX usually conform to Standard or Superior room profiles in this study’s classifications, which are, mainly single-use, double standard rooms, double standard rooms with an extra bed and standard triple rooms, among other options. The rooms offered as four PAX are usually rooms classified as Superior Plus, Junior Suites and Suites. These rooms are offered at higher rates, so the price per person also rises. The minimum prices are higher for 3 and 4 room PAX than the average prices offered for 1 and 2 room PAX. In this case, the exponential function that offered the best fit (R2 = 0.9695) indicated that rooms’ prices rise faster than their room PAX, as
shown by Equation (4):
y = 96.407e0.2666x (4)
in which x indicates the number of guests (x=1, 2, 3, 4) allowed per room.
Length of stay
The analysis next focused on changes in average prices for guests’ entire stay depending on the length of stay. As expected, the results reveal an increase in prices for longer stays from 1 to 4 days (F = 970.1;
df1 = 3; df2 = 193,389; p-value < 0.001) (see Figure 6), but, remarkably, that average price per night
decreases when 1 additional night is considered.
This decrease in the average room price per night for longer stays can be explained by rooms being offered with the restriction of a minimum length of stay. Hotels are willing to offer lower unitary prices per night when customers are required to purchase a longer stay. Conversely, guests expect to pay less per night for a room if they commit to staying for more days. The results provide support for these explanations, but they run contrary to findings reported in the more recent literature, which indicate that hotels in the United States charge more per night when guests stay longer (Riasi, Schwarz, Liu & Li, 2017).
The present results also reveal that over 76% of the prices offered correspond to 1-night stays. The remaining 24% includes the combined price offers for 2 (23.0%), 3 (0.7%) and 4 nights (0.2%). In other words, rooms at the urban destination in question are usually distributed under a single-resource model regarding length of stay. The function that best approximates average room prices’ behaviour according
to length of stay is the polynomial function (R2 = 0.9925). Equation (5) represents the relationship
between average prices and length of stay as:
y = 14.984x2 – 105.49x + 252.33 (5)
In this equation, x indicates length of stay in number of days (x=1, 2, 3, 4).
Figure 6. Average room price and price count by length of stay Conclusion
Findings
This study’s results reveal that prices applied over the entire 300-day advance booking horizon vary according to hotel category and day of the week, which is in line with the existing literature (Abrate, Capriello & Fraquelli, 2011; Abrate, Fraquelli & Viglia, 2012; Ivanov & Piddubna, 2016). Hotels’ number of rooms also affects their prices, but no specific pattern could be discerned. In this regard, Abrate and Viglia (2016) and Pawlicz and Napierala (2017) obtained contradictory results. The former cited authors found that hotel size has a negative influence on prices, but the latter researchers report that prices increase with a rising number of rooms.
The variable of type of room shows the expected behaviour so that, whenever the room category improves, prices rise as well. Previous research has considered only one type of room, making comparisons impossible (Andersson, 2010; Herrmann & Herrmann, 2014; Sun, Law & Tse, 2016). The current results for number of guests per room are also difficult to compare with the extant literature for similar reasons. In this study, the more people stay in a room, the higher the price goes. Notably, Juaneda, Raya and Sastre (2011) obtained similar results for requests to change from 1 to 2 guests per room. Another important result that needs to be highlighted is that the average room price varies significantly for each variable considered in the current study.
The way that prices differ in accordance with each selected variable and its respective values were incorporated into a dashboard. This dashboard could facilitate comparisons with future studies or serve
147 475 44 218 1 398 302 163,28 96,91 75,07 68,64 0 20 000 40 000 60 000 80 000 100 000 120 000 140 000 160 000 0 € 20 € 40 € 60 € 80 € 100 € 120 € 140 € 160 € 180 € 1 2 3 4 R o o m Price Co u n t A ve rag e R o o m Price ( p er n ig h t) Length of stay
as a reference point for professionals (see Figure 7). The average room price appears in the centre of each chart, with the maximum price on the right and minimum on the left.
Contribution
This study used a large dataset of online prices posted on Booking.com by a Spanish city’s hotels. As the research was carried out with a representative sample of hotels in this destination, the findings can be extrapolated to the entire population of the city’s hotels. Consequently, revenue managers can use the results to support their practices and decision making regarding prices offered online for a time horizon of up to 300 days without needing to perform exhaustive, time-consuming pricing analyses. This research’s end goal was thus to help hotels improve their pricing strategies.
Channel management is currently of great importance to hotel distribution. The large volume of online prices offered by the sample (193,393 prices published per day by just 31 hotels) would have risen to even more extreme numbers if the entire hotel population at this destination had been considered in the present study. The 94 hotels registered in Seville are capable of producing over 580,000 room rates per day in just one of their online distribution channels (i.e. Booking.com). This extreme figure represents an excessive workload in terms of the time that managers have to devote to updating data and other related activities, so more efficient channel management is an important topic.
The heavy workload that key channel management activities generate may explain why they are not always in keeping with hotels’ importance (i.e. their number of rooms) in the market. Most of the variables under study were found to have a quite significant effect on prices. The only exception is the number of rooms, which does not appear to have a well-defined pattern of influence. These results differ from previous research’s findings, which indicates that all the available data needs to be considered, as opposed to reducing the volume of variables’ values. Thus, all the information available on Booking.com should be analysed and not just the prices published for a 2-person, 1-night stay.
Practitioners operating in the context in question, especially revenue managers of three-star hotels, must pay closer attention to channel management in order to set and manage an adequate number of room rates in line with their hotels’ real presence in the market. These managers should also consider the prices offered by their competitive set and adjust their hotels’ pricing policies accordingly. More particularly, three-star hotels can boost their presence on Booking.com, as the number of price offers (26.0%) they currently produced is not commensurate with their weight in the sample (38.7%) (see Section 4.1). This anomaly might be linked to three-star hotels’ weaker commitment to developing an appropriate revenue management philosophy.
Managerial implications
Practitioners can use the above findings to dig deeper into the pricing process for this destination in the selected online channel. They will also be able to benefit from the price dashboard and database generated and make better and more profitable advance decisions through price-related revenue management activities. In addition, revenue managers can identify the most appropriate behaviour in prices depending on the significance of each variable analysed (e.g. hotel category and day of the week) while considering a long advance booking horizon. These managers can learn more about how price strategies are applied throughout the urban destination in question, as this study’s data covered a broader scope of hotels than that commonly included (i.e. competitive set).
Figure 7. Summary of average (in the centre), maximum (on the right) and minimum (on the left) room
prices for each variable and its values
K K K K K K K K K K K K K K K K K
Limitations and future research directions
While the present study’s results have some limitations, these simultaneously represent future lines of research. First, this research used online data from only one online distribution channel, although this channel has been shown to be the most important in Europe. Second, one further variable that future research needs to take into account is how average room price behaves according to number of days to check-in dates. Third, evidence has been found that online room prices increase as the date of bookings approaches, but researchers may get more useful results by confirming this pattern for the urban destination under study with reference to, among other variables, hotel category, room type, length of stay or tourism season. Last, this research explored only one city, albeit in great detail.
Acknowledgements
We would like to acknowledge the participation of the company Beonprice S.L. in the present research. We would also like to thank the Vice-Rectorate of Research of the University of Seville for providing financial support for this study through its ‘V Plan Propio de Investigación’. The authors are thankful for support from the Research Centre for Tourism, Sustainability and Well-being (CinTurs) [FCT Grant Number UIDP/SOC/04020/2020]. Lastly, we are extremely grateful to the reviewers and the Editor Prof. Ivanov for their insightful comments, which contributed to a significant improvement of this paper.
References
Abrate, G., Capriello, A., & Fraquelli, G. (2011). When quality signals talk: Evidence from the Turin hotel industry. Tourism Management, 32(4), 912-921.
Abrate, G., Fraquelli, G., & Viglia, G. (2012). Dynamic pricing strategies: Evidence from European hotels.
International Journal of Hospitality Management, 31(1), 160-168.
Abrate, G., & Viglia, G. (2016). Strategic and tactical price decisions in hotel revenue management.
Tourism Management, 55, 123–132.
Andersson, D.E. (2010). Hotel attributes and hedonic prices: an analysis of internet-based transactions in Singapore’s market for hotel rooms. The Annals of Regional Science, 44(2), 229-240.
Baker, T. K., & Collier, D. A. (1999). A comparative revenue analysis of hotel yield management heuristics. Decision Sciences, 30(1), 239–263.
Baker, T. K., & Collier, D. A. (2003). The benefits of optimizing prices to manage demand in hotel revenue management systems. Production and Operations Management, 12(4), 502-518.
Chávez-Miranda, M. E. (2005). Yield management. Estudio de su aplicación en el sector hotelero. Doctoral dissertation, Universidad de Sevilla, Spain.
Choi, S. & Kimes, S.E. (2002) Electronic distribution channels’ effect on hotel revenue management.
Cornell Hotel and Restaurant Administration Quarterly, 43(3), 23–31.
Cross, R. G. (1997). Revenue Management: Hard-core tactics for market domination. Broadway books. Cross, R. G., Higbie, J. A., & Cross, D. Q. (2009). Revenue management’s renaissance: A Rebirth of the
Art and Science of Profitable Revenue Generation. Cornell Hospitality Quarterly, 50(1), 56–81. Chiang, W., Chen, J. C. H., & Xu, X. (2007). An overview of research on revenue management: current
issues and future research. International Journal of Revenue Management, 1(1), 97–128.
Domingo-Carrillo, M. Á. (2016). Investigación sobre revenue management en turismo en el sector
hotelero. Estudio empírico sobre hoteles de 4 y 5 estrellas. Doctoral dissertation, Universidad de
Sevilla, Spain.
Domingo-Carrillo, M. Á., Chávez-Miranda, E., & Cubiles-de la Vega, M. D. (2017). Journal segmentation and competitive position based on revenue management research publications. Journal of Revenue
Donaghy, K., McMahon, U., & McDowell, D. (1995). Yield management: an overview. International
Journal of Hospitality Management, 14(2), 139-150.
Exceltur (2013). UrbanTUR 2012. Monitor de competitividad turística de los destinos urbanos españoles. www.exceltur.org
Exceltur (2016). Barómetro de la rentabilidad y el empleo de los destinos turísticos españoles. Balance
2015. www.exceltur.org
Exceltur (2017a). Barómetro de la rentabilidad y el empleo de los destinos turísticos españoles. Balance
2016. www.exceltur.org
Exceltur (2017b). UrbanTUR 2016. Monitor de competitividad turística de los destinos urbanos españoles. www.exceltur.org
Exceltur (2018). Barómetro de la rentabilidad y el empleo de los destinos turísticos españoles. Balance
2017. www.exceltur.org
Guillet, B. D., & Mohammed, I. (2015). Revenue management research in hospitality and tourism: A critical review of current literature and suggestions for future research. International Journal of
Contemporary Hospitality Management, 27(4), 526–560.
Guadix, J., Onieva, L., Muñuzuri, J., & Cortés, P. (2011). An overview of revenue management in service industries: an application to car parks. The Service Industries Journal, 31(1), 91-105.
Guo, X., Ling, L., Dong, Y. & Liang, L. (2013). Cooperation contract in tourism supply chains: The optimal pricing strategy of hotels for cooperative third party strategic websites. Annals of Tourism
Research, 41, 20-41.
Herrmann, R., & Herrmann, O. (2014). Hotel roomrates under the influence of a large event: The Oktoberfest in Munich 2012. International Journal of Hospitality Management, 39, 21-28.
Hostelmarket (2014). Hostelmarket: Informe Anual de la Hostelería. Madrid: Publicaciones Alimarket. Hormby, S., Morrison, J., Dave, P., Meyers, M., & Tenca, T. (2010). Marriott International increases
revenue by implementing a group pricing optimizer. Interfaces, 40(1), 47-57.
Hung, W.T., Shang, J.K., & Wang, F.C., 2010. Pricing determinants in the hotel industry: quantile regression analysis. International Journal of Hospitality Management, 29(3), 378–384.
Ivanov, S. H., & Piddubna, K. (2016). Analysis of prices of accommodation establishments in Kiev: determinants, dynamics and parity. International Journal of Revenue Management, 9(4), 221–251. Ivanov, S., & Zhechev, V. (2012). Hotel revenue management–a critical literature review. Turizam:
znanstveno- stručni časopis, 60(2), 175–197.
Josephi, S. H. G., Stierand, M. B., & van Mourik, A. (2016). Hotel revenue management: Then, now and tomorrow. Journal of Revenue and Pricing Management, 15(3-4), 252–257.
Juaneda, C., Raya, J. M., & Sastre, F. (2011). Pricing the time and location of a stay at a hotel or apartment.
Tourism Economics, 17(2), 321-338.
Kim, M., Lee, S.K., & Roehl, W.S. (2016). The effect of idiosyncratic price movements on short- and long-run performance of hotels. International Journal of Hospitality Management, 56, 78–86.
Kimes, S.E. (1989). The basics of yield management. Cornell Hotel and Restaurant Administration
Quarterly, 30(3), 14-19.
Kimes, S.E. (2011). The future of hotel revenue management. Journal of Revenue and Pricing
Management, 10(1), 62-72.
Kimes, S.E. (2016). The evolution of hotel revenue management. Journal of Revenue and Pricing
Management, 15(3-4), 247–251.
Kimes, S.E., & Singh, S. (2008). Spa Revenue Management. Cornell Hospitality Quarterly, 50(1), 82–95. Kimes, S.E., Chase, R. B., Choi, S., Lee, P. Y., & Ngonzi, E. N. (1998). Restaurant revenue management.
Applying yield management to the restaurant industry. Cornell Hotel and Restaurant
Kreeger, J.C., & Smith, S. (2017). Amateur innkeepers utilization of minimum length stay restrictions.
International Journal of Contemporary Hospitality Management, 29(9), 2483–2496.
Law, R., Leung, R., Lo, A., Leung, D., Hoc, L. & Fong, L. H. N. (2015). Distribution channel in hospitality and tourism: Revisiting disintermediation from the perspectives of hotels and travel agencies.
International Journal of Contemporary Hospitality Management, 27(3), 431–452.
Liu, J.N.K., & Zhang, E.Y. (2014). An investigation of factors affecting customer selection of online hotel booking channels. International Journal of Hospitality Management, 39, 71–83.
Lonely Planet (2018, April 19). Best in travel 2018: las 10 mejores ciudades. Retrieved from: https://www.lonelyplanet.es/blog/best-in-travel-2018-las-10-mejores-ciudades
Maier, T. (2012). International hotel revenue management. Journal of Hospitality and Tourism
Technology, 3(2), 121-137.
McGill, J. I., & van Ryzing, G. J. (1999). Revenue management: Research overview and prospects.
Transportation Science, 33(2), 233–256.
Nielsen (2016, May 30). Global Connected Commerce. Is e-tail therapy the new retail therapy? January. Retrieved from: https://www.nielsen.com/content/dam/nielsenglobal/jp/docs/report/2016/ Nielsen-Global-Connected-Commerce-Report-January-2016
Oses, N., Gerrikagoitia, J. K., & Alzua, A. (2016). Monitoring and benchmarking the performance of a destination’ s hotel industry: The case study of Bilbao in 2014. Tourism Management Perspectives,
19, 48–60.
Oteo-Iturmendi, J. M. (2013). La aplicación del yield management en el sector hotelero: El caso de los
hoteles de las tres capitales vascas. Doctoral dissertation, Universidad de Deusto, Spain.
Pawlicz, A., & Napierala, T. (2017). The determinants of hotel room rates: An analysis of the hotel industry in Warsaw, Poland. International Journal of Contemporary Hospitality Management, 29(1), 571–588.
Pekgün, P., Menich, R., Acharya, S., Finch, P., Deschamps, F., Mallery, K., Sistine, J., Christianson, K., & Fuller, J. (2013). Carlson Rezidor hotel group maximizes revenue through improved demand management and price optimization. Interfaces, 43(1), 21-36.
Riasi, A., Schwartz, Z., Liu, X., & Li, S. (2017). Revenue management and length-of-stay-based room pricing. Cornell Hospitality Quarterly, 58(4), 393–399.
Ropero-García, M. Á. (2011). Dynamic pricing policies of hotel establishments in an online travel agency.
Tourism Economics, 17(5), 1087–1102.
Schamel, G. (2012). Weekend vs. midweek stays: modelling hotel room rates in a small market.
International Journal of Hospitality Management, 31(4), 1113–1118.
Schütze, J. (2008). Pricing strategies for perishable products: the case of Vienna and the hotel reservation system, hrs.com. Central European Journal of Operations Research, 16(1), 43-66. Smith, B. C., Leimkuhler, J. F., & Darrow, R. M. (1992). Yield Management at American Airlines.
Interfaces, 22(1), 8–31.
Soler, I.P., Gemar, G., Correia, M.B., & Serra, F. (2019). Algarve hotel price determinants: a hedonic pricing model. Tourism Management, 70, 311–321.
Sun, S., Law, R., & Tse, T. (2016). Exploring price fluctuations across different online travel agencies: A case study of room reservations in an upscale hotel in Hong Kong. Journal of Vacation Marketing,
22(2), 167-178.
Talón-Ballestero, M. P. (2010). Revenue yield management en los hoteles de Madrid: Análisis empírico de
su aplicación y resultados. Doctoral dissertation, Universidad Rey Juan Carlos, Spain.
Talón-Ballestero, P., & González-Serrano, L. (2013). Future trends in revenue management. Journal of
Revenue and Pricing Management, 12(3), 289-291.
Thrane, C. (2007). Examining the determinants of room rates for hotels in capital cities: Тhe Oslo experience. Journal of Revenue and Pricing Management, 5(4)315–323.
Tom Dieck, M. C., Fountoulaki, P., & Jung, T. H. (2018). Tourism distribution channels in European island destinations. International Journal of Contemporary Hospitality Management, 30(1), 326– 342.
Vinod, B. (2004). Unlocking the value of revenue management in the hotel industry. Journal of Revenue
and Pricing Management, 3(2), 178–190.
Vives, A., Jacob, M., & Payeras, M. (2018). Revenue management and price optimization techniques in the hotel sector: A critical literature review. Tourism Economics, 24(6), 720–752.
Wang, X. L., Yoonjoung Heo, C., Schwartz, Z., Legohérel, P., & Specklin, F. (2015). Revenue management: progress, challenges, and research prospects. Journal of Travel & Tourism Marketing,
32(7), 797-811.
Weatherford, L., & Bodiliy, S. E. (1992). A taxonomy and research overview of perishable-asset revenue management: Yield management, overbooking and pricing. Operations Research, 40(5), 831–844. Yeoman, I. S., & McMahon-Beattie, U. (2017). The turning points of revenue management: a brief history
of future evolution. Journal of Tourism Futures, 3(1), 66-72. Received: 03/06/2019
Accepted: 06/03/2020