[27]
Agris on-line Papers in Economics and Informatics
Volume II Number 2, 2010
What is the structure of the coffee market: Can the real poor benefit from
the coffee trade?
I. Pokorná, L. Smutka
Czech University of Life Sciences Prague, Faculty of Economics and management, Department of Economics
Abstract
This article deals with the trade with coffee. The primary aim of the paper is to analyse the international coffee trade. Because coffee belongs to the cash crops we have focus on the production. We have analysed the structure of the trade concerning the green (not roasted) coffee, roasted coffee and coffee extracts, essences or concentrates. The analyses of production show enormous differences between developed and developing countries on the supply side. Dissimilarity appeared in the price system. Our results show that developing countries (especially least developed countries) cannot fully benefit from the international trade because they are placed just on the lowest level of the production vertical line. The results prove that there must exist strong influence of the supply chains. This is connected with the export of roasted coffee and import of the green coffee.
Pieces of knowledge introduced in this paper resulted from solution of an institutional research intention MSM 6046070906 „Economics of resources of Czech agriculture and their efficient use in frame of multifunctional agri-food systems“.
Key words
Coffee market, international trade, prices, supply chains, developing countries
Anotace
P edkládaný lánek se zabývá obchodem s kávou. Primárním cílem bylo analyzovat mezinárodní obchod s kávou. Protože však káva pat í mezi tzv. „cash crops“, analýza se zam ila p evážn na produkci. Sou ástí provedeného rozboru byla nezpracovaná káva, pražená káva a kávové extrakty, esence a koncentráty. Výsledky jasn prokazují výrazné rozdíly mezi rozvojovými a rozvinutými zem mi na stran nabídky. Rozdílnost panuje i v rámci cenového systému. Výsledky poukazují na fakt, že rozvojové (a speciáln nejmén rozvinuté zem ) nemohou pln využívat výhod z mezinárodního obchodu, protože se nacházejí pouze na nejnižší úrovni produk ní vertikály. Provedené analýzy rovn ž nazna ují nezanedbatelný vliv dodavatelských et zc , kdy v tšina zemí exportuje praženou kávu a importuje kávu surovou.
Poznatky prezentované v lánku jsou výsledkem ešení výzkumného zám ru MŠM 6046070906 „Ekonomika zdroj eského zem d lství a jejich efektivní využívání v rámci multifunk ních zem d lskopotraviná ských systému.
Klí ová slova
Obchod s kávou, mezinárodní obchod, ceny, dodavatelské et zce, rozvojové zem .
Introduction
It is widely known truth that many developing countries depend just on few agricultural commodities and due to that; they are vulnerable to the crises at the international markets. Several of these commodities are cash crops and their price fluctuation is one of the well documented at the international market. Coffee belongs to the group of cash crops.
Coffee probably originated in Ethiopia from where it spread to Sudan and Yemen. Originally, the Arabs had very strict policy not to export beans suitable for reproduction. Due to that no other state could grow coffee.
[28] families depend just on this one commodity, which is widely used all around the world. These farmers are mostly small holders.
For example in Indonesia the small holders produce nearly 96 % of the overall productions of coffee when Indonesia produces 6,6 % of the coffee production in 2004 (Brata, 2007). Barret (2008) found out that the majority of the smallholders producing cash crops are net buyers of the food crops. Also these farmers depend on the off-farm employment to be able to purchase the food crops. On the other hand Goetz (1992) studied the possible change between cash crops and food crops in Singapore and on the base of his result it is possible to say that the structural change is rather complicated due to the limited financial resources. Azam and Besley (1991) analysed the impact of the price rise on the rationed peasant farmers producing cash crops and “normal” crops. They found out that the market for food plays an important role in examining the reaction of rationed peasant farmer to a rice of price of his crop. Most of these farmers, their families but also their home countries were significantly hit by the fall of the prices at the end of the last century. Coe (2006) mentioned the problem of participation in market authorities as a way to increase the prices. Niederhauser et al (2008) called attention to the fact that the price of most agricultural commodities shows a long-term trend to decline. Chosen set of commodities shows a general price decline of 1–3 % per year.
Raju and Melo (2003) say that these major booms and falls happen every ten years. The impact of falling down of the prices caused major problems to the stability of developing and especially least developed countries (LDC). The International Coffee Organization (2003) documented the economic and social effect of the falling prices on the group of producing countries (such us Nicaragua, Costa Rica). Tucker et al (2009) researched the perception of farmer to the risk of the price instability and weather. They did not consider the later one as a risky factor compare to the former one which is perceived as particularly stressful. However, even this awareness does not push the farmers to change their production.
There also exist increasing concert about the substantiality of the coffee production. Barbier (1989) pointed out that cash crops are increasingly
grown on the more fertile lands and are pushing food production, especially subsistence cultivation, on to marginal areas. However, the volumes of coffee that is cultivated under the environmentally friendly or labour friendly condition remains relatively low. Bacon (2005) highlights the fact that also the share of the commodity chain relating to the Fair trade or organic commodity farming remains relatively low. Valkila (2009) examined the difference between the fair trade price and price of conventional coffee in the mainstream markets in Nicaragua.
Aim and methodology
We have decided to analyse the market with coffee that belongs to the cash crop commodity. The aim of this paper is to analyze the structure of the coffee market with reference to the different types of traded coffee. Our fundamental premise is that coffee trade should show the difference between developed, developing and the least developed countries. We can expect that there will be different structure of the merchandise trade with coffee. The least developed countries together with the developing countries would trade higher volume with lower value due to the products with lower value added and vice versa with the developed countries.
Analysing the structure of the market can help us to understand the influence of the coffee supply chains. This analysis is also important to show the value added which should be the primary source of economic growth.
We also use revealed comparative advantage indices for our analyses. The original RCA index, formulated by Balassa (1965) can be written as:
RCA = (xij / xit) / (xnj / xnt)
[29] Source: Authors calculation based on FAO
Figure 1: Production and consumption of coffee.
omission of imports especially when country-size is significant.
For the analyses of the production and consumption of coffee between the years 1960 – 2007, we have used the FAO database. Data from the Standard International Trade Classification Revision 3 commodity nomenclature (COMTRADE data) will be used for more detailed analyses of the structure of trade.
The basic facts
Production of the coffee beans has been increasing over the decades. As is evident from the chart 1 the production has doubled since 1960. However, we cannot talk about standard growth.
The production fluctuates significantly. During the monitored period the lowest peak was reached in the year 1974 comparably the highest production was in the last monitored year 2008. The trend of consumption does not copy the pattern of production in all years, especially from the year 1960 until the year 1985. (However, we have to take in consideration that we are talking about green coffee.)Very significant drop is between the years 1975 and 1976 in both production and
consumption that can be connected with the oil crises and due to that the coffee crises. Durevall (2007) explains this drop of the consumption by the sharp increase in price.
Since the year 1986 the same pattern exists between both production and consumption. We cannot prove relation between the consumption and production. Mostly the producers do not react to the increasing consumption by the increasing production. On the other hand, consumers are able to consume nearly all-available production. In 2005 the highest consumption of coffee can be found in Europe (4,67 kg/person/yr) and surprisingly in Oceania (4,07 kg/person/yr), Americas are on the third position.
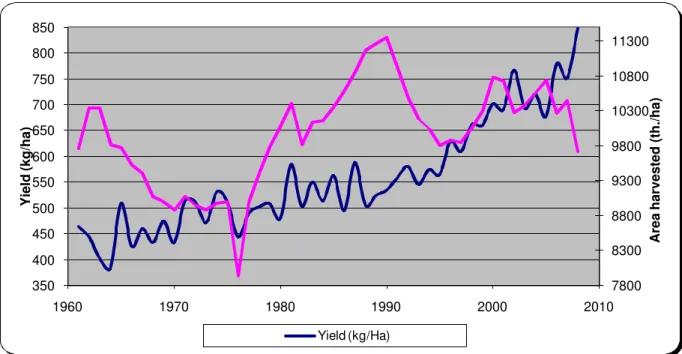
As is evident the production can be explained by two main factors. One of them is yield per hectare and the second one harvested area. The yields doubled between the years 1960 and 2008. When we compare the evolution of the harvested area, we can say that fluctuation exist during the monitored period (Figure 2).
However, the area in the year 2008 is nearly the same as in the first year. The minimum size of the
0,85 0,9 0,95 1 1,05 1,1 1,15 1,2 1,25 3500 4000 4500 5000 5500 6000 6500 7000 7500 8000 8500
1960 1970 1980 1990 2000 2010
C o n s u m p ti o n ( k g /c a p it a ) P ro d u c ti o n ( ti s . to n n e s )
[30] harvested area was in the year 1976 with contrast to the year 1991 when the harvested area was the largest. When we take in consideration the relation between production and yields we can say that the yields have witnessed the same evolution like the production of the green coffee. This founding is rather important because it means that developing and least developed countries do not react to the changes in the international market just by the changes of the production area. It means that they behave rationally. This founding support the idea of Maxwell and Fernando (1989) who stressed the stability of the cash crops harvested area in comparison with the food security plants. This is also a reaction to the long growing cycles of coffee tree. Lewis et al (2004) stress the problematic planning of the production in the long cycles of some cash crops (tea, coffee, etc.).
The harvested area play less important role in explaining the overall production of coffee (table 1), it is explained just from 39 %. Compare to that the yields explained the changes from 92 % and very strong dependency exists (Table 1). We can say that the production of the green coffee has beenmore influenced by the yields than by the harvested area. It means that producers cannot react to the changes in the international market by increasing the harvested area.
The international trade
Data analysed in this section comes from the FAO database. The international trade has few really
Source: Authors calculation based on FAO
Figure 2: Yields and harvested area of coffee.
Production Area Yields Pearson Correlation Production 1,000 ,632 ,963
Area ,632 1,000 ,404 Yields ,963 ,404 1,000 Sig. (1-tailed) Production . ,000 ,000
Area ,000 . ,002
Yields ,000 ,002 .
Source: Authors calculations based on FAO
Table 1: Correlations.
7800 8300 8800 9300 9800 10300 10800 11300
350 400 450 500 550 600 650 700 750 800 850
1960 1970 1980 1990 2000 2010
A
re
a
h
a
rv
e
s
te
d
(
th
./
h
a
)
Y
ie
ld
(
k
g
/h
a
)
[31] important export commodities. Oil is the first one and coffee is the second most essential article of trade. Coffee is an important product in many economies especially for the financial system of the least developed countries. Coffee exporters contribute to the national income. Many authors (Otero, 2000; Bacon, 2004; Nestel, 1995) stress the fact that coffee is the main source of the foreign exchange, employment and value added. For some countries, coffee is one of the most valuable products of the agriculture.
The trade with coffee can be divided by different criterion. One of the divisions depends on the species of coffee – in this case, we are talking about coffee Arabica and coffee variant Robusta. Robusta forms 90 % of world production. Arabica (9 % of the world production) is more valuable due to the finest flavour (Kemsley et al, 1995). However, for our analysis is necessary to distinguish between green (or not roasted) and roasted coffee and also to take into consideration the coffee substitutes containing coffee in any proportion.
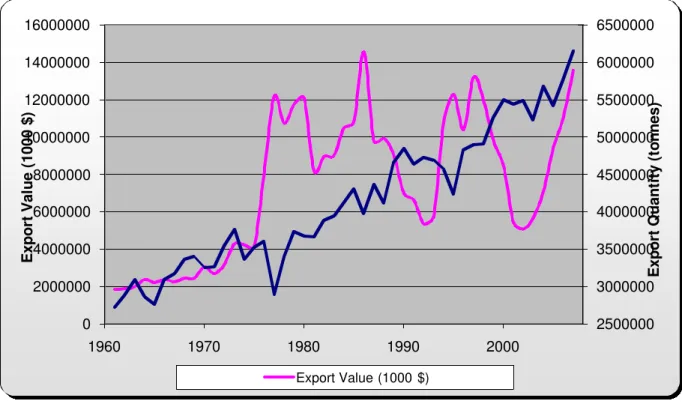
As is evident from the chart 3 the export of coffee doubled during the monitored period. The growth was quite stable. This is in contrast with the situation of the value of the export. Even if the final value of the export is higher than the initial one the
course of the curve is very irregular with many considerable fluctuations.
The trend of the export value exactly shows the coffee crises connected with the downfall of the prices. This trend is not evident for roasted coffee. The value and amount of trade of the roasted coffee witness significant growth in this case. On the base of the previously mentioned facts, we can say that producers are mostly badly hit by the decline in the prices. The huge fluctuations are also evident and this is exactly what makes the producers of the cash crops so vulnerable at the international market.
Bacon (2005) mentioned that this vulnerability depends on many factors – location, access to assets etc. The stable evolution of the prices of the roasted coffee gives us an idea that difference between products with no or very low value added and higher value added exist.
In this case we should have supposed that the same situation would have appeared in the market with coffee substitutes containing coffee in any proportion. Nevertheless, the situation is different (Figure 4). Trade with these substitutes of coffee became more important in the eighties of the last century. Big upsurge is evident between the years 1996 – 1997 and again few years later.
Source: Authors calculations based on FAO
Figure 3: Export of green coffee
2500000 3000000 3500000 4000000 4500000 5000000 5500000 6000000 6500000 0 2000000 4000000 6000000 8000000 10000000 12000000 14000000 16000000
1960 1970 1980 1990 2000
E x p o rt Q u a n ti ty ( to n n e s ) E x p o rt V a lu e ( 1 0 0 0 $ )
[32] The trend of the production either in tonnes or in value is nearly the same. We could not prove any
relationship between productions of green coffee, roasted one or substitutes of coffee.
Source: Authors calculation based on FAO
Figure 4: Export of Coffee Substitutes containing coffee.
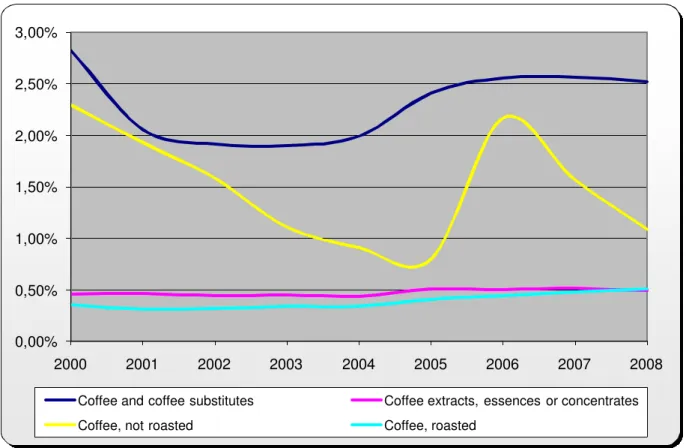
Source: Authors calculation based on FAO
Figure 5: Share of selected groups in the agricultural trade.
-5000 5000 15000 25000 35000 45000 55000
1960 1965 1970 1975 1980 1985 1990 1995 2000 2005
Export Quantity (tonnes)
0,00% 0,50% 1,00% 1,50% 2,00% 2,50% 3,00%
2000 2001 2002 2003 2004 2005 2006 2007 2008
Coffee and coffee substitutes Coffee extracts, essences or concentrates
[33] As we are mostly able to define what caused the changes in the export of the green coffee, we are unable to say what is behind the oscillations in the export of the coffee substitutes containing coffee in any proportion. When we take in consideration the situation of the developing countries, where most of the populations depend on the some kind of cash crops, and compare it with results of the previous analyses we cannot expect that developing and especially least developed countries would be able to plan their production with regards to the international market. The high fluctuation between monitored years makes any long-term plans very difficult to fulfil.
The structure of the international
trade
Data analysed in this section comes from the COMTRADE database. Between the years 2000 - 2008 the share of green coffee in the agricultural trade (Figure 5) was gradually declining till the year 2005 when it reached its minima (0,8 %). The annual growth between year 2005 and 2006 was nearly 150 % and in year 2006 it reached 2,17 %. The significant drop again followed this increase. Conversely, the export of the green coffee has increased during the monitored decades. The share of not roasted coffee (the equivalent of green coffee in FAO database) shows significant drop. The share of these products of coffee in total trade is marginal.
Forty percent of the not roasted coffee has been produced in low income food deficit countries and 16 % in least developed countries (LDC´s) though these countries export just 7 % of not roasted coffee. On the other hand, Germany that does not have any single coffee tree exports 6 % of the not roasted coffee. There exist nine most important producers of not roasted coffee: Brazil, Viet Nam, Colombia, Indonesia, Germany, Belgium, Guatemala, Peru and Ethiopia which share is over 4 %. The first three count for 53 % of the overall trade with not roasted coffee. The order in the trade value nearly corresponds to the order in weight.
It is well-documented fact that just few international firms exist in the coffee production industry. On one side they behave like a buyers of the green coffee on the other hand they are producing the processed coffee as is evident in the case of Germany.
When we put side by side the comparative advantage as measured by RCA indices for 20 biggest exporters of not roasted coffee huge differences exist (Chart 6). The boxplot shows us the distribution of RCA. While the box represents 50 % of the ordered data stretching between the lower and upper hinge, the median line is situated at the top of the box that means that some asymmetry between the analysed data exists and the data set is negatively skewed as more cases follow under the median line. It means that most of the countries do not reach the median value of the RCA indices. This is rather interesting because the lowest level of RCA was reached in 2005 when the RCA of Ethiopia was only 0,16. Quite the opposite situation happens to Rwanda, Uganda, Peru and Guatemala. Their RCA indices reached 1,7 in the year 2003 and during the whole monitored period this is the highest level of RCA.
When we compare the situation concerning the level of RCA we can see that USA, Spain, Germany, Belgium, China are unable to reach comparative advantage for not roasted coffee in the long term. However, these countries are still on the market. We can say that even obvious comparative disadvantage does not clear the market. India and Cote d´Ivore fluctuate around 1. The rest of the countries have the level of RCA above 1 and we can say that these countries have comparative advantage. The highest comparative advantages have Peru, Rwanda, Viet Nam, Uganda, Guatemala, Costa Rica or El Salvador. It means that developing countries have higher comparative advantage in not roasted coffee than developed countries.
[34] Coffee extracts, essences or concentrates make up the last group of coffee products. The top twenty producers compromise of 86 % of the international trade. The highest producer is Germany, which produces 19 % of the whole production. The distribution of production is slightly different compare to the previous group of products. Developing countries are producing thirty five percent of the production (Brazil, Colombia, India,
Singapore, Malaysia, etc.). However, there is no single producer from the least developed countries. Nearly all the analysed states have rather high comparative advantage in coffee extracts, essences or concentrates. We cannot say that the comparative disadvantage is equally distributed just between developing countries. Even developed countries such as USA or Belgium have comparative disadvantage.
Source: Authors calculation based on COMTRADE
Figure 6: Distribution of the RCA indices for top twenty exporters of not roasted coffee.
Source: Authors calculation based on COMTRADE
[35]
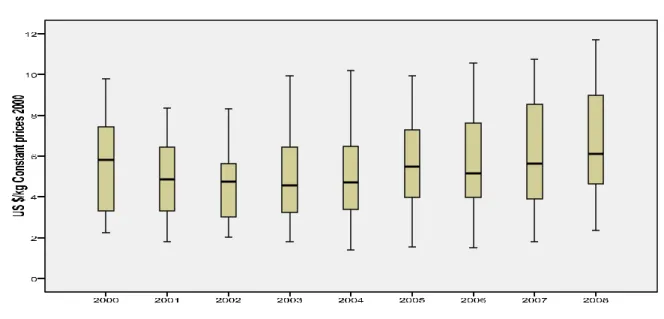
The prices at the international
market
Different situation is with prices. The prices of the exporting countries depend very much on the quality of the coffee that can change over time (for more details see Krivonos, 2004). The average price of not roasted coffee reached its minima in 2002 as is evident from the median line and since than the median is increasing. It means that the price is increasing as well. The price is more or less equally distributed. In the year 2008 the minimum price was the same as the level of highest 25 percentile in 2002.
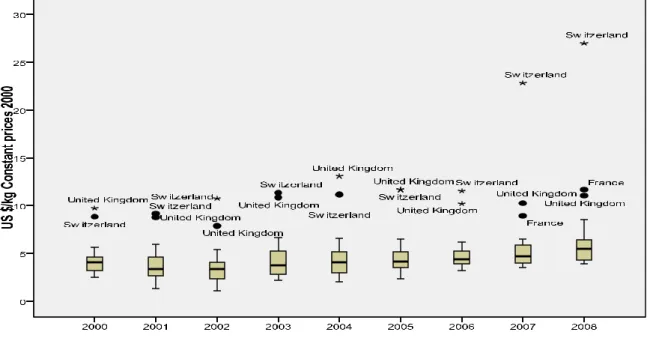
Different situation appears with the prices of roasted coffee. As is evident from the following chart (No. 8) the highest prices have Switzerland, United Kingdom and France and none of these countries belongs to the developing countries. Workman (2007) suggests that the higher price in Switzerland is given by the steep premium for gourmet roasted Swiss coffee beans. The value of medium is slowly increasing over the monitored period; however, higher differences in prices exist than in the previous case.
The last chart (no. 9) illustrates the evolution of prices of Coffee extracts, essences or concentrates.
The median line is slightly increasing and during the last three monitored years is situated in the bottom line of the box that means that most of the prices are under the median line.
When we compare the prices of the above mentioned products, we can say that the lower price of not roasted coffee and higher prices of roasted coffee and coffee extracts, essences or concentrates is typical for products with lower and higher value added. It also illustrates the difference between producers when producers of primary products mostly comes from developing countries. The difference between the prices can be also explained by the influence of supply chains.
Conclusion
As is evident from the above mentioned facts the international coffee trade does not support the developing or least developed countries. The green (or not roasted) coffee is mostly produce in developing countries on the other hand most of the primary producers do not manufacture the roasted coffee. It means that developing countries mostly do not put in any added value for their products and because of that they cannot expect economic growth. Germany is a country that even exports green (not roasted) coffee.
Source: Authors calculation based on COMTRADE
[36] Source: Authors calculation based on COMTRADE
Figure 9: Distribution of prices of extracts, essences or concentrates. The price of these commodities is also different.
The price of primary product – in this case not roasted coffee is much lower than the price of coffee extracts, essences or concentrates. Switzerland has the highest prices for roasted coffee. Of course, this all means that money from the added value do not stay in the country of origin primary product but due to the price transmission
flow more to the other countries. We can say that most of the countries that act as a buyer of green coffee are also producers of processed coffee.
The current situation when the process of adding value is unequally distributed between countries cannot help the poorest countries to improve their situation.
Corresponding author: Ing. Irena Pokorná, Ph.D.
Czech University of Life Sciences Prague, Department of Economics Kamycká 129, Prague- Suchdol, Czech Republic
e-mail: [email protected]
References
[1] Azam, J.P. and Besley T. (1991): Peasant supply response under rationing: The role of the food market. European Journal of Political Economy 7, p. 331 – 343, North Holland, ISSN: 0176-2680.
[2] Bacon, C. (2005): Confronting the Coffee Crisis: Can Fair Trade, Organic, and Specialty Coffees reduce Small-Scale Farmer Vulnerability in Northern Nicaragua? World Development Vol. 33, No. 3, pp. 497– 511, Elsevier. ISSN: 0305-750.
[3] Balassa, B. (1965): Trade Liberalization and “Revealed” Comparative Advantage. The Manchester School, 33, 99–123.
[4] Barret, C. B. (2008): Smallholder market participation: Concepts and evidence from eastern and southern Africa. Food Policy 33 p. 299–317, Elsevier. ISSN: 0306-9192.
[5] Barier, E. B. (1989): Cash Crops, Food Crops, and Sustainability: The Case of Indonesia. World Development, Vol. 17, No. 6. pp. 879-895, Maxwell Pergamon Macmillan plc. ISSN: 0305-750.
[37]
[7] COE, C. (2006): Farmer Participation in Market Authorities of Coffee Exporting Countries. World Development, Vol. 34, No. 12, p. 2089-2115. Elsevier, ISSN: 0305-750X
[8] Dureval, D. (2007): Demand for coffee in Sweden: The role of prices, preferences and market power. Food Policy 32, p. 566-584. Elsevier. ISSN: 0306-9192. Elsevier, ISSN: 0305-750X
[9] Goetz, S. J. (1992): Economies of Scope and the Cash Crop – Food Crop Debate in Senegal. World Development, Vol. 20, No. 5, pp. 727-734,1992. Elsevier, ISSN: 0305-750X.
[10] International Coffee Organization (2003): Impact of coffee crisis on poverty in producing countries. ICC 89-5, Rev. 1, available http://www.ico.org/documents/icc89-5r1e.pdf (cit. Jan. 10. 2010).
[11] Kemsley, E. K., Ruault, S. and Wilson, R. H. (1995): Discrimination between Coffea Arabica and Coffea canephora variant robusta beans using infrared spectroscopy. Food Chemistry 54, p. 321 – 326, Elsevier. ISSN: 0308-8146.
[12] Krivonos, E. (2004): The impact of coffee market reforms on producer prices and price transmission. World Bank Policy Research Working Paper 3358. Available at http://ideas.repec.org/p/wbk/wbrwps/3358.html, (cit. Jan. 15, 2010).
[13] Lewin, B., Giovannucci, D. and Varangis, P. (2004): Coffee Market: New Paradigms in global Supply and Demand. Agriculture and Rural Development Discussion Paper 3. The World Bank. Available at http://www-wds.worldbank.org/external/default/WDSContentServer/WDSP/IB
/2007/06/22/000310607_20070622095247/Rendered/PDF/283000REVISED0Coffee1Markets01PUBL IC1.pdf (cit. Jan. 15, 2010).
[14] Maxell, S. and Fernando, A. (1989): Cash Crops in Developing Countries: The Issues, the Facts, the Policies. World Development, Vol. 17, No 11, p. 1677-1708. Elsevier. ISSN: 0305-750X.
[15] Nestel, D. (1995): Coffee in Mexico: international market, agricultural landscape and ecology. Ecological Economics 15, p.165-178. Elsevier. ISSN: 0921-8009.
[16] Niederhauser, N., Oberthur, T., Kattnig, S. and Cock, J. (2008): Information and its management for differentiation of agricultural products: The example of specialty coffee. Computers and electronics in agriculture, Vol. 6/1, p. 241–253. Elsevier, ISSN: 0168-1699.
[17] Otero, J.G. (2000): Coffee, economic fluctuations and stabilisation: an intertemporal disequilibrium model with capital market imperfections. Journal of Development Economics, Vol. 62_2000.105–129. Elsevier. ISSN: 0304-3878.
[18] Raju, S. S. and Melo, A. (2003): Money, real output, and deficit effects of coffee booms in Columbia. Journal of Policy Modelling, Vol. 25, p. 963–983, Elsevier. ISSN: 0161-8938.
[19] Tucker, C. M., Eakin, H. and Castellanos, E. J. (2009): Perceptions of risk and adaptation: Coffee producers, market shocks, and extreme weather in Central America and Mexico. Global Environmental Change 20 (2010) 23–32, , Elsevier, ISSN: 0959-3780.
[20] Valkila, J. (2009): Fair Trade organic coffee production in Nicaragua — Sustainable development or a poverty trap? Ecological Economics Vol. 68, p. 3018–3025, Elsevier. ISSN: 0921-8009.