Glacial vicariance drives
phylogeographic diversification in
the amphi-boreal kelp Saccharina
latissima
João Neiva
1, Cristina Paulino
1, Mette M. Nielsen
2, Dorte Krause-Jensen
2,3, Gary W. Saunders
4,
Jorge Assis
1, Ignacio Bárbara
5, Éric Tamigneaux
6, Licínia Gouveia
1, Tânia Aires
1,
Núria Marbà
7, Annette Bruhn
2, Gareth A. Pearson
1& Ester A. Serrão
1Glacial vicariance is regarded as one of the most prevalent drivers of phylogeographic structure and speciation among high-latitude organisms, but direct links between ice advances and range fragmentation have been more difficult to establish in marine than in terrestrial systems. Here we investigate the evolution of largely disjunct (and potentially reproductively isolated) phylogeographic lineages within the amphi-boreal kelp Saccharina latissima s. l. Using molecular data (COI,
microsatellites) we confirm that S. latissima comprises also the NE Pacific S. cichorioides complex and is composed of divergent lineages with limited range overlap and genetic admixture. Only a few genetic hybrids were detected throughout a Canadian Arctic/NW Greenland contact zone. The degree of genetic differentiation and sympatric isolation of phylogroups suggest that S. latissima s. l. represents a complex of incipient species. Phylogroup distributions compared with paleo-environmental
reconstructions of the cryosphere further suggest that diversification within S. latissima results from chronic glacial isolation in disjunct persistence areas intercalated with ephemeral interglacial poleward expansions and admixture at high-latitude (Arctic) contact zones. This study thus supports a role for glaciations not just in redistributing pre-existing marine lineages but also as a speciation pump across multi-glacial cycles for marine organisms otherwise exhibiting cosmopolite amphi-boreal distributions. Glacial vicariance, the geographical separation of species into regional populations associated with glacial con-ditions, is one of the most pervasive and recurrent drivers of phylogeographic structure and speciation1. Genetic
differences accumulate in isolated gene-pools and thus may eventually lead to new genomic recombinations in subsequent contact events or reproductive isolation. High-latitude species have been particularly prone to undergo such processes as a consequence of the cyclic growth and decay of the ice-sheets during the Quaternary ice-age (2.5 Ma ago to present)2. Continental-scale changes in regional temperature and oceanographic
circula-tion regimes, among others, have resulted in important latitudinal shifts in the distribucircula-tion and connectivity of biodiversity. For most high-latitude species in the northern hemisphere, glacial maxima, such as the last glacial maximum (LGM, ca. 26.5–19 ka)3, would have been characterized by more southerly, and often more fragmented,
geographical distributions, such as the disconnected southern European peninsular refugia4. Likewise, with each
ice advance and retreat, shallow coastal areas were also alternately exposed and submerged5, opening and closing
dispersal corridors for marine and terrestrial biota such as the glacial Beringia land bridge (currently Bering Strait).
Speciation, the evolution of reproductive isolation leading to the formation of new biological species, can be an extended process spanning multiple climatic shifts. Diverging gene pools thus only become evolutionarily
1CCMAR- Centro de Ciências do Mar, Universidade do Algarve, Faro, Portugal. 2Department of Bioscience, Aarhus
University, Silkeborg, Denmark. 3Arctic Research Centre, Aarhus University, Aarhus, Denmark. 4Centre for
Environmental and Molecular Algal Research, University of New Brunswick, Fredericton, Canada. 5Biocost Research
Group, Universidade de A Coruña, A Coruña, Spain. 6NSERC Industrial Research Chair for Colleges in Marine
Macroalgae, Cégep de la Gaspésie et des Îles, Grande-Rivière, Québec, Canada. 7Department of Global Change
Research, IMEDEA (CSIC-UIB), Esporles, Spain. Correspondence and requests for materials should be addressed to J.N. (email: jmneiva@ualg.pt) or E.A.S. (email: eserrao@ualg.pt)
Received: 22 June 2017 Accepted: 4 January 2018 Published: xx xx xxxx
relevant from a speciation perspective if they survive and retain their integrity (i.e. do not fully merge) in the longer-term. Low-dispersal species are often subdivided in phylogeographic groups that are largely parapatric and presumably formed when isolated subpopulations expanded and contacted, a common process post-glacially6–10.
Even when species ranges become more continuous, gene-flow can continue restricted beyond secondary con-tact/hybrid zones, so that pre-existing genetic differences are preserved, at least in original refugial areas. This can be due to limited dispersal and/or density-barrier effects10, or evolving post-zygotic (e.g. Dobzhansky-Muller)
incompatibilities11. Such a composite mode of divergence and speciation, characterized by cyclic regional
isola-tion and accumulaisola-tion of genomic differences that are conserved beyond narrow and often geologically tempo-rary interglacial contact/ hybrid zones, now seems pervasive among low-dispersal terrestrial taxa4,7,12,13.
Links between glacial/sea-level dynamics, allopatric divergence and speciation have been more challenging to document in the marine realm14–16, where often dispersal barriers are elusive, detailed fossil records unknown,
and glacial histories obscured by intrinsic high rates of dispersal. Still, approaches including phylogeography and niche modelling have revealed effects of past climatic shifts and changes in the geographic distribution of marine organisms and/or of their lineages. Northern extirpations, climatic refugia (including northern refugia) and post-glacial contact/hybrid zones have been identified across the world oceans, and several pathways of poleward post-glacial expansions established17–22. However, explicit biogeographical settings of marine glacial
vicariance, and how they might have actually contributed to generate new marine biodiversity in the long-term, have seldom been identified (but see21,23).
The sugar kelp Saccharina latissima sensu lato (s.l.) was recently shown to be composed of three lineages of uncertain biological status, morphologically cryptic but genetically distinct [based on the barcoding mitochon-drial cytochrome c oxidase gene (COI, COX1 or CO1, <700 bp]24. Phylogroup divergence and distributions,
matching the NE Pacific, NW Atlantic and NE Atlantic shores (with some overlap in the Canadian Arctic), led these authors to hypothesize that S. latissima s.l. could correspond to a complex of incipient species, presumably resulting from repeated cycles of glacial isolation and interglacial migration and contact. Internal transcribed spacer (ITS, located between the small and large subunits of the nuclear ribosomal RNA genes) data, however, did not recover the same geographic clustering, and many NW Atlantic individuals exhibited ambiguous base calls (i.e. heterozygosity) suggestive of re-established gene-flow. Because incomplete lineage sorting and/or concerted evolution of ITS sequences could also explain low phylogeographic signals and resemble admixture, the status of these mtDNA phylogroups remained unresolved.
At a higher level, the genetic circumscription of S. latissima s.l. itself is also probably incomplete. Morpho-species delimitation within Saccharina, and more generally the taxonomy of Laminariales, is afflicted by extensive intra-specific plasticity (ontogenic, ecological, etc.) and/or convergence25–27. The genus, for instance,
was only recently separated from Laminaria28, and now includes several taxa formerly placed in e.g. Hedophyllum,
Kjellmaniella, Cymathaere28–30. S. latissima has been reported but not genetically confirmed from the NW
Pacific31, where a range of other putative endemic congeners also occur. Recently, the COI gene has been
suc-cessfully employed as a standardized DNA barcode marker in a range of kelp genera, including Saccharina24,32–35.
Besides the Atlantic phylogroups of S. latissima s.l., COI has clarified the identity and geographical ranges of Pacific S. bongardiana, S. nigripes and cryptic S. druehlii24,33,34. While other morpho-taxa from the NW Pacific
(e.g. S. cichorioides complex) appear to be genetically very similar and possibly conspecific to S. latissima s. l.36,37,
they have not been examined for this same discriminant marker. Definite species boundaries and genealogic relationships of S. latissima s. l. remain therefore unclear29.
In this study, based on an extended panel of populations and the integration of environmental, COI barcoding and microsatellite genotypic data, we address several related questions regarding the identity and biogeography of S. latissima s. l. Specifically, we aimed to clarify 1) the current taxonomic circumscription and global range of S. latissima s. l. and 2) the validity, genetic integrity (reproductive isolation in sympatry) and biogeographi-cal history of previously described mtDNA phylogroups. We confirmed the presence of S. latissima in the NW Pacific, where specimens had previously been classified as distinct species, and mapped with unprecedented scale and resolution the complex distribution of phylogroups in the Arctic/Atlantic. There, we inferred the sequence of post-glacial poleward migration of phylogroups from disjunct glacial ranges based on phylogeographic and palaeo-environmental evidence. This and their general isolation along a modern secondary contact zone sup-port the role of glacial vicariance as a driver of marine allopatric divergence and speciation, a role that is often hypothesized but poorly documented with good empirical evidence. These findings are particularly relevant for the understanding of the evolution and biogeography of amphi-boreal species complexes and other high-latitude marine biota most directly affected by periodic glacial advances.
Results
COI data.
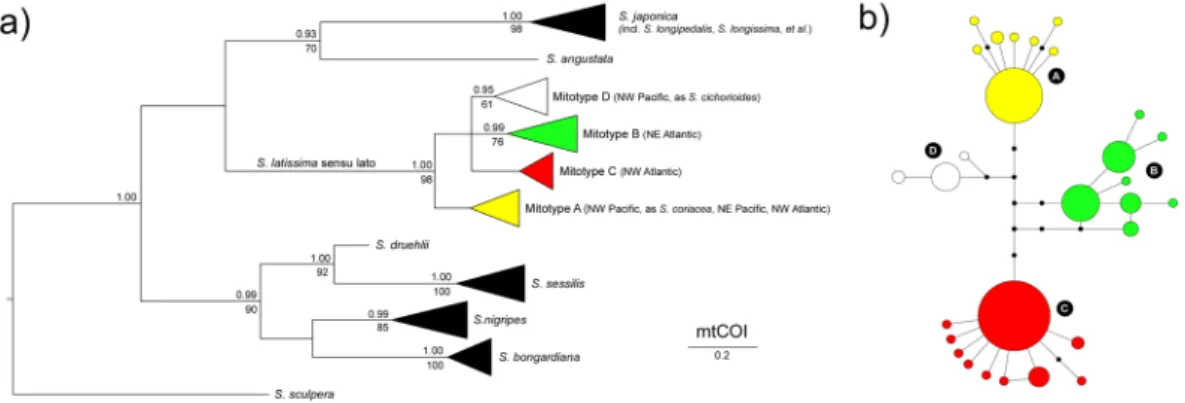
The global alignment of COI sequences of Saccharina spp. was 658 bp long and included 225 sequences retrieved from Genbank (Table S1), plus 51 newly generated sequences of Atlantic S. latissima s. l. from the eastern Canada, Greenland and Europe. The final alignment used in phylogenetic analyses consisted of a sub-set of 62 unique sequences (most COI sequences were identical within species/phylogroups, demonstrating the usefulness of this locus for barcoding purposes), and the best-fit nucleotide substitution model was determined to be the Hasegawa-Kishino-Yano38 (HKY + G; different transition/transversion rates, unequal base frequencies)with gamma distributed rate variation among sites. Recovered ML and Bayesian trees revealed three well sup-ported clades containing a total of 11 taxa: 1) S. japonica s. l. (comprising many genetically indistinguishable taxa) and S. angustata, 2) S. latissima s. l. (including S. cichorioides and S. coriacea, see below), and 3) S. bongardiana,
S. nigripes, S. sessilis and S. druehlii (Fig. 1a, see also Table S1 for original species designations). Low phylogenetic signal of this fragment of COI did not allow further resolution of the tree.
S. latissima s. l. was subdivided in four differentiated phylogroups, separated by 4–6 fixed mutations (Fig. 1b). These correspond to the three mitotypes (Pacific, European and Atlantic) previously identified by McDevit and
Saunders24, herein designated phylogroups A, B and C, respectively, plus a fourth one, originally identified as
S. cichorioides (here phylogroup D). Maximum K2P divergence within recognized species was typically below
0.8%, whereas interspecific divergences ranged between 1.7 (closely related S. sessilis & S. druehlii) and 7.26% (Fig. 2, Table S2). S. latissima s. l. exhibited atypically high (maximum) intra-specific divergence (K2P < 1.54%), with sequence divergences between different phylogroups ranging from 0.61–1.07% (A vs D) to 0.92–1.54% (A vs C). Phylogroups exhibited contrasting distributions on the Atlantic and the Pacific oceans (Fig. 3, last panel). Phylogroup A was detected in both NW (Japan, as S. coriacea) and NE (British Columbia) Pacific and also in the colder areas of the NW Atlantic (W Greenland and Hudson Bay). The remaining phylogroups were restricted to a single biogeographic region – B and C throughout NE and NW Atlantic, respectively, and D (sampled as S.
cichorioides) was genetically confirmed only from Russia’s Pacific region of Primorye.
Microsatellite data.
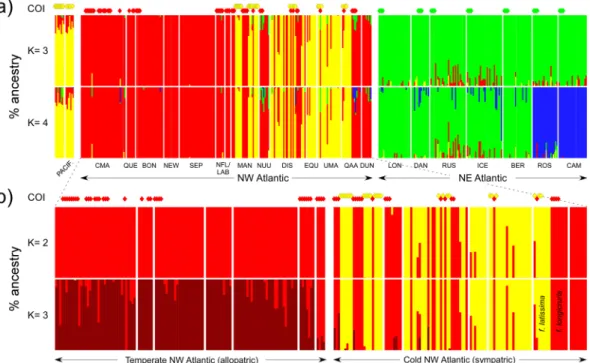
Genetic diversity within populations was very variable but highest in NE Atlantic (Table 1), and regional differences in allelic composition were readily apparent (Fig. S1). The genotypic clusters recovered matched remarkably well the COI phylogroups, as illustrated in the FCA plot (Fig. 4). Shallower sub-divisions were also apparent within phylogroups, e.g. NE Pacific vs NW Atlantic populations of phylogroup A, or “southern” (Iberia and Brittany) and “northern” (remaining) populations of phylogroup B. LEA admixture analyses also recognized 3 (or 4) stable genotypic clusters in the whole data-set (Fig. S2a), matching these same groups (Fig. 5a). When analysed separately, 2 (or 3) stable genotypic clusters were detected in the NW Atlantic (Fig. S2b), again matching remarkably well A and C phylogroups, and the mild separation of the latter in a tem-perate (allopatric) and a colder (sympatric) subpopulations (Fig. 5b). Both FCA and admixture plots revealed intermediate A/C genotypes along their sympatric cold NW Atlantic range (Figs 4 and 5b). In the temperate NW Figure 1. Genealogic relationships within Saccharina based on mtCOI sequence data. (a) Bayesian 50% majority-rule consensus tree based on 62 unique sequences. Numbers above and below the branches are Bayesian posterior probabilities (>0.90) and maximum likelihood bootstrap support values (>60), respectively. Horizontal triangles represent collapsed branches, with length (horizontal) representing the distance from the branches’ common node to the tip of the longest branch, and height (vertical) scaled to the number of (unique) sequences collapsed. (b) COI haplotype network of S. latissima sensu lato, showing the four (A–D) inferred mitotypes. Haplotypes are represented by circles sized to their frequency. Black dots represent inferred, unsampled haplotypes.Figure 2. Range of K2P sequence divergences (%) within recovered genetic entities of Saccharina spp. Boxplots are grouped according to the type of pairwise comparison: intra-specific (left, intra-phylogroup in the case of
Atlantic (phylogroup C), individuals exhibiting longicruris (long hollow stipes) and latissima (short solid stipes) morphologies were genetically indistinguishable based on both COI and microsatellite markers. Conversely, in Manitoba and W Greenland, many individuals belonging to phylogroup C were originally collected as S.
lon-gicruris, whereas those belonging to phylogroup A were always collected as S. latissima (see also McDevit and
Saunders24). This pattern is well illustrated in sympatric individuals from QAA. The highest heterozygote
defi-ciencies were detected in these mixed A/C populations (Table 1).
The first hierarchal analysis of ABC, testing 18 scenarios regarding the topology of population ancestry, revealed that the Pacific and Atlantic gene-pools diverged from a common ancestor ~198,000 generations ago, with NE and (allopatric) NW Atlantic S. latissima diverging much latter, around ~90,000 generations ago (sce-nario 5; Figs 6a and S3a; Table S3). Unsurprisingly, the second hierarchal ABC analyses identified the Pacific (A) and (allopatric) NW Atlantic (C) gene-pools as the main putative sources of the current mixed region of W Greenland and Hudson Bay (scenario 6; Figs 6b and S3b). This contact zone was estimated to have formed ~3,550 generations ago, i.e., post-glacially (Table S4). Error rates were estimated as 0.124 and 0.045, for the first and sec-ond hierarchal levels of ABC, respectively.
Figure 3. Glacial vicariance and post-glacial secondary contact of Atlantic phylogroups of S. latissima. The hypothetical glacial ranges and re-distribution of mtCOI phylogroups since the LGM (as inferred from indirect phylogeographic and paleoenvironmental data) are illustrated with a sequence of time points starting with (a) maximum ice-sheet size, (b) the opening of the Bering Strait, (c) the collapse of the Laurentide ice-sheet and the transgression of the Hudson Bay and (d) the present. Phylogroups are coloured as in Fig. 1 (COI-A: yellow, COI-B: light green; COI-C: red, COI-D: white). Sites that were also genotyped for microsatellite markers are marked as circles, otherwise stars. Sites in grey correspond to inhospitable areas (emerged, or under ice-sheets and perennial sea-ice) or beyond ice barriers. Maps were generated with QGIS 2.17 (http://qgis.osgeo.org) using modelled ice-sheet and land extent data54.
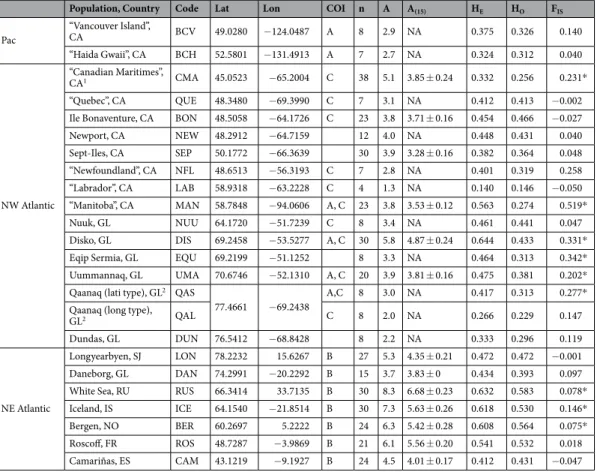
Population, Country Code Lat Lon COI n A A(15) HE HO FIS Pac “Vancouver Island”, CA BCV 49.0280 −124.0487 A 8 2.9 NA 0.375 0.326 0.140 “Haida Gwaii”, CA BCH 52.5801 −131.4913 A 7 2.7 NA 0.324 0.312 0.040 NW Atlantic “Canadian Maritimes”, CA1 CMA 45.0523 −65.2004 C 38 5.1 3.85 ± 0.24 0.332 0.256 0.231* “Quebec”, CA QUE 48.3480 −69.3990 C 7 3.1 NA 0.412 0.413 −0.002 Ile Bonaventure, CA BON 48.5058 −64.1726 C 23 3.8 3.71 ± 0.16 0.454 0.466 −0.027 Newport, CA NEW 48.2912 −64.7159 12 4.0 NA 0.448 0.431 0.040 Sept-Iles, CA SEP 50.1772 −66.3639 30 3.9 3.28 ± 0.16 0.382 0.364 0.048 “Newfoundland”, CA NFL 48.6513 −56.3193 C 7 2.8 NA 0.401 0.319 0.258 “Labrador”, CA LAB 58.9318 −63.2228 C 4 1.3 NA 0.140 0.146 −0.050 “Manitoba”, CA MAN 58.7848 −94.0606 A, C 23 3.8 3.53 ± 0.12 0.563 0.274 0.519* Nuuk, GL NUU 64.1720 −51.7239 C 8 3.4 NA 0.461 0.441 0.047 Disko, GL DIS 69.2458 −53.5277 A, C 30 5.8 4.87 ± 0.24 0.644 0.433 0.331* Eqip Sermia, GL EQU 69.2199 −51.1252 8 3.3 NA 0.464 0.313 0.342* Uummannaq, GL UMA 70.6746 −52.1310 A, C 20 3.9 3.81 ± 0.16 0.475 0.381 0.202* Qaanaq (lati type), GL2 QAS
77.4661 −69.2438 A,C 8 3.0 NA 0.417 0.313 0.277* Qaanaq (long type),
GL2 QAL C 8 2.0 NA 0.266 0.229 0.147
Dundas, GL DUN 76.5412 −68.8428 8 2.2 NA 0.333 0.296 0.119
NE Atlantic
Longyearbyen, SJ LON 78.2232 15.6267 B 27 5.3 4.35 ± 0.21 0.472 0.472 −0.001 Daneborg, GL DAN 74.2991 −20.2292 B 15 3.7 3.83 ± 0 0.434 0.393 0.097 White Sea, RU RUS 66.3414 33.7135 B 30 8.3 6.68 ± 0.23 0.632 0.583 0.078* Iceland, IS ICE 64.1540 −21.8514 B 30 7.3 5.63 ± 0.26 0.618 0.530 0.146* Bergen, NO BER 60.2697 5.2222 B 24 6.3 5.42 ± 0.28 0.608 0.564 0.075* Roscoff, FR ROS 48.7287 −3.9869 B 21 6.1 5.56 ± 0.20 0.541 0.532 0.018 Camariñas, ES CAM 43.1219 −9.1927 B 24 4.5 4.01 ± 0.17 0.412 0.431 −0.047
Table 1. Geographic origin and genetic diversity of populations of Saccharina latissima s.l. CA: Canada; GL: Greenland; SJ: Svalbard; RU: Russia; IS: Iceland; NO: Norway; FR: France; ES: Spain; *Lat/Lon in decimal degrees, averaged in artificial populations (in brackets; when individuals were collected at multiple sites and dates inside the general area).1“Canadian Maritimes” includes samples from New Brunswick, Nova Scotia
and Prince Edward Island. 2Lati type = “S. latissima morphotype”; Long type = “S. longicruris morphotype”.
COI: haplogroups sampled; n: individuals genotyped; A: mean allelic richness; A′: standardized number of private alleles; HE: Nei’s gene diversity; Ho: observed heterozygosity; FIS: multi-locus inbreeding coefficient (*if
significant, 1000 permutations).
Figure 4. FCA plot based on all individual multilocus genotypes of S. latissima s. l. Solid lines denote mtDNA phylogroups (note the correspondence with microsatellite-based genotypic clusters) and dashed lines further geographic sub-divisions inferred with genotypic data alone. All putative hybrids were detected in NW Greenland (NW Atlantic) within mixed COI-A/COI-C populations. The “temperate” COI-C outlier could result from backcrossing, genotyping error, or other.
Discussion
Molecular data have contributed greatly to resolve Saccharina within the Laminariales and to refine morpho-species boundaries within the genus. Despite these advances, a comprehensive and stable taxonomi-cal treatment of Saccharina has yet to be produced. Phylogenetic analyses revealed negligible COI divergence between S. japonica and a multitude of named and unnamed taxa from the NW Pacific, confirming that many morpho-taxa from the NW Pacific correspond to mere varieties of this highly plastic species37,39 (see also
COI-based37,40 and ITS/rubisco-based28,30,36 studies). More relevant to our study, COI data were incompatible with
the current taxonomic interpretation of S. latissima, with interesting systematic and biogeographic implications. Thus far, S. latissima was known to comprise three phylogroups with contrasting distributions in the NE Pacific and N Atlantic24. However, the COI tree revealed that Saccharina samples from Hokkaido (Japan) and
Primorye (Russia), originally identified as S. coriacea40 and S. cichorioides37, respectively, were also embedded
within S. latissima. Previous studies already showed very close evolutionary relationships between these taxa. For instance, Yotsukura et al.36 recovered nearly identical ITS1 and ITS2 sequences (only 1 bp indel) between S.
coriacea, S. cichorioides and S. yendoana from Hokkaido and a western Canadian sample of S. latissima. These
authors discussed the possibility that these taxa represented a single biological species, but recognized that low Figure 5. Population structure of Saccharina latissima s. l. based on LEA analyses. (a) Percentage ancestry of each genotyped individual (vertical bars) from the northeast Pacific and north Atlantic/Arctic, when the number of ancestral genetic clusters (k) is set to k = 3 (top) and k = 4 (bottom). (b) Percentage ancestry of individuals from the northwest Atlantic and northwest Greenland, for k = 2 (top) and k = 3 (bottom). COI phylogroups are shown on top of each plot for comparison. Population codes as in Table 1, colour codes as in previous figures.
Figure 6. Diagram of the most likely demographic scenarios chosen by the (a) first and (b) second hierarchal levels of ABC analyses.
ITS resolution could mask biologically meaningful differences between closely related species, and thus that more data would be necessary to settle the issue. Likewise, Balakirev et al.37 also showed that her own samples of S.
cichorioides and S. coriacea from Hokkaido (in our analyses corresponding to phylogroups D and A, respectively)
exhibited identical ITS and plastid rbcLS sequences, and interpreted them as being conspecific.
Collectively, these data concur that S. cichorioides s. l. (sensu Selivanova et al.41, including also S. coriacea, S.
yendoana and S. sachalinensis) and S. latissima s. l. (sensu McDevit and Saunders24, including also NW Atlantic
S. longicruris) correspond to the same group of related phylogroups and thus that they should be formally
syn-onymized. For simplicity, and given nomenclatural priority, we keep S. latissima s. l. when referring to this broader and now decidedly amphi-oceanic definition of the complex. The taxonomic confusion around this spe-cies complex (at least four cryptic phylogroups mismatched with many poorly supported morpho-taxa) and S.
japonica (an over-classified plastic species) illustrates well the pitfalls of classic taxonomy, and beg for the genetic
confirmation of other NW Pacific endemic taxa such as S. gurjanovae, S. kurilensis (=Cymathaere japonica), and the closely related (as assessed with ITS36 S. gyrata (=Kjellmaniella gyrata). Undeniably, COI barcoding probably
represents the most cost-effective approach to verify their identities, and also the most sensible approach to sur-vey new regional floras, at least when multiple or potentially new species/phylogroups may be present42,43.
The limited number of genetically confirmed individuals prevents the mapping of the general ranges of the phylogroups A and D in the Pacific, including establishing if the latter is truly endemic to the NW Pacific coast. A true Pacific phylogeography would require extensive surveys along the coastlines of Japan, Russia, USA and Canada, which were not a goal of this study. Taking into consideration the ecologic and morphologic plasticity of
S. latissima throughout Japanese and Russian shores, underlying the current multitude of described morpho-taxa,
and the very limited (Japanese Sea, British Columbia) or missing (e.g. Okhotsk, Bering and Chukchi Seas) genetic information for other Pacific regions, additional unaccounted diversity cannot be completely ruled out. By com-parison, our knowledge concerning the identity and distribution of phylogroups in the Atlantic is now much more complete. Phylogroups B and C were confirmed to have disjunct distributions in NE (Iberia to Svalbard) and NW (Long Island Sound to northern Baffin Bay) sides of the Atlantic, as well as on each side of Greenland. The Atlantic distribution of phylogroup A was also extended in this study to include whole of W Greenland, where it was often observed in local sympatry with phylogroup C.
Intra-specific COI divergence within S. latissima s. l., as noted before24, is atypically high when compared
to other kelp species, including widespread and morphologically plastic congeners such as S. japonica39 and
S. nigripes (originally as S. groenlandica24). Multi-locus genotypic clusters matched remarkably well COI
phy-logroups, confirming that differences are genome-wide and constant throughout their ranges and not reflecting some single-gene idiosyncrasy. Shallower, intra- oceanic microsatellite structure was also apparent within phy-logroups, but with much weaker phylogeographic signal. In the NE Atlantic (phylogroup B), a “southern” (Iberia plus Brittany) and a “northern” genotypic clusters were relatively well resolved, as was to some extent a similar southern/northern subdivision in the NW Atlantic (phylogroup C). Widespread phylogroup A also revealed mild (recovered only in the FCA) genotypic differences between Pacific and Atlantic samples that deserve further examination.
At least in the Atlantic, phylogroup divergences matching simultaneously unique nuclear backgrounds and biogeographic ranges, strongly suggest that these lineages have had largely independent evolutionary histo-ries (see next section), and may potentially represent incipient species. Laboratory crosses between S. latissima originating from Vancouver (most likely phylogroup A), Halifax (sampled as S. longicruris, phylogroup C) and Roscoff/Helgoland (phylogroup B) show full inter-fertility and result in normal, viable hybrids44. A range of pre-
and post-zygotic mechanisms may nevertheless influence real hybridization (and hybrid survival) rates in the wild, which may be challenging to assess directly. A few mixed populations were detected throughout the overlap-ping ranges of phylogroups A and C in western Greenland and Hudson Bay. These mixed populations exhibited the largest heterozygote deficiencies, suggesting that hybridization is not frequent. Indeed, individuals with inter-mediate genotypes (putative hybrids and backcrosses, <90% assignment to either A or C clusters in the admix-ture analyses) were detected in at least 4 of these populations, but in very low frequencies. In Manitoba, where A and C phylogroups were sampled with a 3/2 ratio, admixed genotypes were not even detected. While the nature of the biological isolation mechanisms that may be operating is not fully identified, it seems clear that rates of gene-flow following contact have been insufficient to compromise their integrity at both local and regional scales.
Globally, the available genetic data (phylogeography and apparent paucity of genetic hybrids in sympatry) is clearly compatible with the hypothesis of S. latissima s.l. corresponding to a complex of incipient species. Unfortunately, despite the sampling effort, an expected contact zone between NE (B) and NW (A & C) Atlantic phylogroups could not be located, making it impossible at present to determine their actual degree of isolation. Mixed populations may still occur along the southern tip of Greenland, as different phylogroups are established on each side of the island. Future sampling campaigns should target this area to look for potential mixed popu-lations, and, if these eventually are found, to assess their degree of isolation. The same applies to the NW Pacific range, where phylogroup ranges, contact areas and reproductive isolation remain basically unassessed. It also remains to be assessed if there is any constant and unambiguous diagnostic character allowing field/laboratory identification of S. latissima s. l. or of any of its constituent phylogroups. A robust multi-locus phylogeny, addi-tional morphological and phylogeographical data, and particularly detailed characterization of addiaddi-tional contact zones are likely to bring new insights on the full diversity and relationships of lineages within the species complex, and ultimately help determine their most adequate biological and taxonomic status.
Genomic differences take time to accumulate and typically require a significant degree of geographic isolation between diverging sub-populations. In general, dispersal barriers are perceived to be less absolute and more tran-sient at geological time-scales in marine vs terrestrial ecosystems, and the environmental conditions promoting allopatric divergence are also expected to differ. For instance, marine analogs of terrestrial glacial refugia such as “disjunct southern peninsulas” are unexpected to form, and persist in the long-term, within south/north-oriented
coastlines characterized by relatively continuous thermal gradients, habitat availability and species distributions45.
This paradigm of glacial vicariance, however, may be useful to explain population structure of S. latissima and other cosmopolitan amphi-boreal species.
During glacial maxima, such as the LGM, the Arctic and much of the adjacent continents and oceans were covered with massive ice sheets, thick ice-shelves, and perennial sea-ice, making them virtually uninhabita-ble to most coastal species46–49. At the height of LGM, when the sea-level was ca. 120 m lower than today, the
Eurasian ice-sheet spread from the Russian Severnaya Zemlya archipelago to the British Isles across the emerged Kara, Barents and North seas. In the Pacific, the modern Bering Sea provided a terrestrial passage (Beringia) between the Eurasian and American continents and supressed the modern connection between the Pacific and the Arctic oceans. The Laurentide ice-sheet also spread across the modern Hudson Bay and the Canadian Arctic Archipelago to connect with the Greenland ice-sheet, forming a second barrier preventing trans-Arctic exchanges between the Pacific and the NW Atlantic oceans.
Remarkably, the current distribution of phylogroup A in the Canadian Arctic and western Greenland coin-cides with one of these regions that were most heavily glaciated and inhospitable during the LGM. Its absence further south in more temperate regions of the NW Atlantic, like phylogroup C, implies that its Arctic/Atlantic range must have been colonized only post-glacially from a N Pacific source, a scenario supported by the ABC demographic analyses and previously documented for other unrelated organisms43,50,51. If so, regional diversity
levels in the Atlantic would be expected to be depressed when compared to putative Pacific sources. Because only a few individuals from two temperate sites in the British Columbia (BCV, BCH) were available for analyses, the diversity of these populations could not be compared with presumably recently established Arctic/Atlantic pop-ulations. Detectable allelic differences between these and NW Atlantic populations (Fig. S1) nevertheless suggest that the latter were not directly involved in the putative trans-Arctic migration. Populations located closer to the Bering Strait are more likely candidates, but only comparable molecular data from this and other N Pacific regions can provide definite evidence for it. In any case, the apparently unidirectional migration is likely to reflect the dominant oceanographic flow (Pacific->Arctic->Atlantic)52 but matches also the pattern of deglaciation.
The Bering Strait opened around 9.5 Ky BP, allowing the eastward colonization of the Arctic along the seasonally ice-free Chukchi and Beaufort Seas (Fig. 3a,b), well before the northwest passage across the Canadian Arctic Archipelago was (seasonally) resumed or the Hudson Bay started deglaciating/transgressing (<7.5 Ky BP53,54;
Fig. 3c).
A similar trans-Arctic migration along the Eurasian Arctic, potentially leading to secondary contact with phylogroup B, would also seem a possibility, especially given the earlier retreat of the Eurasian Ice-sheet and the uninterrupted existence of seasonal ice-free shorelines throughout Siberia. However, the lack of records suggests that this long Arctic coastline may not be particularly suitable for S. latissima, which could hypothetically be caused by extensive discharge of freshwater and sediments from Siberian rivers reducing salinity and rocky sub-strate. Biodiversity in the Laptev Sea for instance is very depauperate when compared to both White/Barents and Chukchi seas, and most diatoms and fish there are characteristic of brackish waters55,56. For sessile species like S.
latissima lacking planktonic dispersive stages, these large distributional gaps may act as a potent trans-Siberian
dispersal barrier.
Lineages B and C are certainly native to the Atlantic, i.e. evolved and split there, possibly after a much older (pre-LGM) colonization event from the diversification centre of Saccharina in the Pacific. Their ranges were also severely constrained at high latitudes during former glacial maxima. Environmental reconstructions of the LGM place the seasonally ice-free boundaries as far south as the British Isles (NE) and New England (NW) (Fig. 3a). Consequences in terms of surviving biota were more severe in the NW vs NE Atlantic, due to a com-bination of lower availability of rocky shores and more compressed temperate envelopes57. While cold-adapted,
plastic species like S. latissima may have endured during these periods they were much more physically separated and presumably much less if at all connected across the two sides of the Atlantic. Indeed, given that potential stepping-stone coastal habitats across mid-latitudes in the Atlantic are so rare and sparse, and the improbability of cross-oceanic migration (via drift) of reproductive sporophytes, gene-flow between glacial subpopulations was probably negligible. Because glacial conditions are typically lengthier (at least one order of magnitude) than inter-glacial conditions58, disjunct glacial ranges and smaller population sizes help explain the observed NE/NW
Atlantic divergence. Also, regular contact and admixture during interglacials are likely to be largely irrelevant evolutionarily. This is because secondary contacts during post-glacial expansions tend to form predominantly at high latitudes [as presently observed in western (and potentially southern) Greenland], so that admixed popula-tions are among those more prone to be erased in subsequent glacial advances. On the contrary, pure, southern populations will tend to persist across climatic shifts.
A scenario of glacial vicariance intercalated with ephemeral interglacial admixture would have cumulative genetic and ultimately reproductive effects across multiple glacial cycles. It represents, in our view, the best expla-nation for the remarkable diversification and modern phylogeographic structure of S. latissima s. l. in the north-ern hemisphere, where the species currently exhibits a rather continuous cosmopolitan distribution that might suggest that genetic admixture opportunities are prevalent over long-term isolation and differentiation. There are many other amphi-boreal, spatially-structured species complexes in the northern Hemisphere, although in con-trast with kelps these are mostly high-dispersal fish and invertebrates, e.g.50,59,60). All this evidence from marine
organisms with distinct dispersal means suggests that episodic waves of trans-Arctic and trans-Atlantic migration and chronic glacial vicariance probably represent rather general drivers of marine diversification.
Conclusions
The over-classification of S. japonica and S. latissima/S. cichorioides illustrates well the potential problems arising from the absence of clear and consensual diagnostic taxonomic characters in widespread plastic taxa, and the importance of sensibly analysing and interpreting genetic data available from public databases, especially when
the underlying taxonomy of the studied group is to some extent unreliable and/or field identifications (even by experts) potentially incorrect (see also Shen et al.61). The COI barcode provides a standardized, cost-effective first
step for species assignments in Saccharina spp. and new and more robust insights are likely to emerge as data from additional species and populations accumulate. Future molecular surveys should prioritize the NW Pacific diver-sity hotspot, where many putative endemic species occur, and where the diverdiver-sity and distribution of genetically confirmed S. latissima s. l. remains basically unassessed. Finally, fine-scale studies focusing on modern contact zones – e.g. integrating morphologic, spatial and genetic (microsatellite) data – are required to further evaluate the nature and strength of the putative isolating mechanisms at play in this complex.
Cold-adapted species like S. latissima s. l. are fascinating models to investigate marine demographic responses, resilience and diversification associated with the Pleistocene climatic shifts. We attributed the clear genomic and biogeographic differences detected within this cosmopolitan species to prolonged glacial isolation in disjunct per-sistence areas intercalated with interglacial expansions and limited admixture in ephemeral, high-latitude contact zones. It remains to be evaluated whether present biodiversity coincides with relevant functional differences that could be important from a conservation or cultivation perspective, particularly in a scenario of ongoing climatic change and ever increasing demand for marine products. More generally, this study shows that glaciations are not just relevant in terms of the redistribution of pre-existing marine lineages but may actually function as an allopat-ric speciation pump, across multi-glacial cycles, for widespread amphi-oceanic organisms.
Material and Methods
Saccharina latissima.
The sugar kelp Saccharina latissima (Linnaeus) C.E. Lane, C. Mayes, Druehl & G.W. Saunders (=Laminaria saccharina (L.) Lamouroux) is an edible, short-lived perennial, canopy-forming brown seaweed (Laminariales, Ochrophyta) widely distributed (and also cultivated) in shallow-water habitats throughout much of the Northern Hemisphere. Its documented but only partially confirmed range extends from the pack-ice border in the high Arctic to cold-temperate latitudes on both sides of the Atlantic and the Pacific oceans31. This vast distribution is accompanied by extensive ecological, morphologic and physiological plasticity,as well as substantial phylogeographic structure24,62–64.
Genetic circumscription of S. latissima.
Phylogenetic relationships within Saccharina were recon-structed with Bayesian and Maximum Likelihood (ML) inference methods using the barcoding COI mitochon-drial gene. COI data included all published sequences of adequate range available (Table S1), as well as new sequences of S. latissima s. l. from both sides of the Atlantic and the Arctic (primers in32). PCRs were performedin 20 μL total volume containing ±10 ng of template DNA, 1x buffer, 2 mM of MgCl2, 0.5 mM of dNTPs, 0.5 μM
of each primer and 1 U of GoTaq G2 Flexi DNA Polymerase (Promega). PCRs were run in a ABI 2720 Thermal Cycler (Applied Biosystems) with an initial denaturation step (95 °C, 5 min), 35 cycles of 95 °C for 30 s, 50 °C for 45 s and 72 °C for 1 min, and a final extension step (72 °C, 10 min). Sequences were aligned, proofread and edited in GENEIOUS 4.8 (Biomatters; http://www.geneious.com). Nucleotide substitution models (using 3 substitu-tion schemes) were compared with jModelTest 265 and best-fit models selected based on the Akaike information
criterion. Bayesian analyses were performed using MrBayes 366. Two parallel Metropolis-coupled Markov chain
Monte Carlo searches, each with four chains (3 ‘heated’), were run for 2 × 10⁶ generations, sampling trees and
parameters every 100 generations. The number of substitution rates, among-site rate variation, and base fre-quency priors were set according to the substitution model selected, leaving the remaining options as default. Run length sufficiency was confirmed by inspecting the average standard deviation of split frequencies between runs and cold chains Log-likelihood stationarity. Based on the latter, 2 × 10⁵ generations (2000 trees) were discarded
as burn-in. The remaining 18000 trees sampled were used to produce 50% majority-rule consensus trees and to calculate branch posterior probabilities. Maximum likelihood analyses were performed with PhyML 367 using
the ATGC bioinformatics platform (http://www.atgc-montpellier.fr/phyml/). Nodal support was calculated using 1000 bootstraps, and trees were rooted with S. sculpera (=Kjellmaniella crassifolia Miyabe 1902, see Yoon et al.30).
The genealogic relationships within S. latissima s. l. were further illustrated with a network calculated with Network 4.6 68, using the median-joining (MJ) algorithm. Divergence within and between recovered taxa were
estimated in MEGA 769 using Kimura’s two-parameter (K2P, allowing different transition/transversions rates)70
sequence distances.
Population structure of S. latissima s. l. in the Atlantic.
Populations of Saccharina latissima s. l. were collected throughout both sides of the Atlantic, from northwest Iberia to Svalbard and northeast Greenland (NE) and Quebec to northwest Greenland (NW) (Table 1). At each site, tissue samples (2–4 cm2) from a variablenumber of individuals (8–30) were collected haphazardly, safeguarding at least one meter between consecutive samples. These were preserved dried in silica-gel crystals and genomic DNA was extracted using the Nucleospin 96 Plant II kit (Macherey-Nagel, Germany). This sampling was complemented with individuals from the NW Atlantic and NE Pacific (British Columbia) previously analysed by24,33. The latter were collected at multiple sites
and dates, but for simplicity individuals were pooled in artificial “populations” matching their general geograph-ical origin (Table 1, populations in brackets). To confirm genetic differences between phylogroups and detect potential admixture versus reproductive isolation), multi-locus genotypes were produced for all individuals by screening 12 microsatellite loci developed specifically for S. latissima as described in Paulino et al.71. Amplified
fragments were run in an ABI PRISM 3130xl automated capillary sequencer (Applied Biosystems) at CCMAR, Portugal. Microsatellite alleles were manually scored in STRAND (Veterinary Genetics Laboratory, University of California, Davis; http://www.vgl.ucdavis.edu/STRand) using the 500 LIZ size standard (Applied Biosystems) and binned using the R package MsatAllele72.
Summary statistics of the microsatellite genetic diversity, including allele frequencies, mean allelic richness (A), standardized number of private alleles (An), Nei’s gene diversity (HE), observed heterozygosity (HO) and
inbreeding coefficients (FIS), were calculated with GENETIX 4.0573. Population structure within north Atlantic S.
latissima s. l., including its concordance with recovered mtDNA phylogroups, was assessed using genotype-based
approaches. Genotypic structure was assessed with a factorial correspondence analysis (FCA) implemented in Genetix 4.0573 and with admixture analyses implemented with the R package LEA74. The latter performs
Structure-like analyses75 but uses a much faster algorithm. Individuals were analysed without any a priori
pop-ulation assignments. Each number of assumed poppop-ulations (K, set sequentially from 1 to 10–15, depending on analyses) was run 20 times with default parameter values, to the exception of the alpha that was set to 100. The best subdivisions of Atlantic S. latissima were determined by inspecting the minimal cross-entropy curve and the inter-run stability of genetic clusters produced for each K.
The evolutionary and demographic history of Atlantic phylogroups of S. latissima s. l. was further recon-structed using Approximate Bayesian Computations (ABC) as implemented in DIYABC76. We compared
com-peting scenarios in two hierarchical levels77 in order to (i) identify the putative topology of ancestry and timing of
divergence between the main phylogeographic groups identified (Fig. S4; NE Pacific, allopatric NW Atlantic and NE Atlantic, see results), and (ii) estimate the timing of secondary contact of divergent gene-pools across the NW Atlantic contact zone (Fig. S2b; previous groupings plus sympatric NW Atlantic, see results). We ran 106
simula-tions per scenario to produce a set of pseudo-observed datasets (PODs). Effective population sizes and parame-ters for the Generalized Stepwise Mutation model were set to the program default77,78, while time of population
divergence (in generations) were defined as uniform within pre- and post-LGM periods. Prior distributions for admixture rates were set between 0.001 and 0.999 (see Tables S5 and S6 for model parameters of each hierarchical level). The posterior probability of each scenario was inferred with a logistic regression performed on the 0.01 proportion of PODs closest to the empirical data77–79. Confidence in selected scenarios was evaluated by a Monte
Carlo estimates of true and false allocations78.
Availability of data and materials.
The single new COI sequence was deposited in Genbank under accession number MF288586. Genotypic data were deposited in Figshare repository@ https://figshare. com/s/5a8fae0032a0148211a3.References
1. Hewitt, G. M. Genetic consequences of climatic oscillations in the Quaternary. Philos. Trans. R. Soc. Lond. B. Biol. Sci. 359, 183–95 (2004).
2. Dynesius, M. & Jansson, R. Evolutionary consequences of changes in species’ geographical distributions driven by Milankovitch climate oscillations. Proc. Natl. Acad. Sci. USA 97, 9115–9120 (2000).
3. Clark, P. U. et al. The Last Glacial Maximum. Science. 325, 710–14 (2009).
4. Hewitt, G. M. Some genetic consequences of ice ages, and their role, in divergence and speciation. Biol. J. Linn. Soc. 58, 247–276 (1996).
5. Lambeck, K. & Chappell, J. Sea level change through the last glacial cycle. Science 292, 679–86 (2001).
6. Petit, R. J. et al. Glacial refugia: Hotspots but not melting pots of genetic diversity. Science 300, 1563–1565 (2003).
7. April, J., Hanner, R. H., Dion-Côté, A. M. & Bernatchez, L. Glacial cycles as an allopatric speciation pump in north-eastern American freshwater fishes. Mol. Ecol. 22, 409–422 (2013).
8. Gómez, A. & Lunt, D. In Phylogeography of southern European refugia (eds Weiss, S. & Ferrand, N.) 155–188 (Springer, 2007). 9. Swenson, N. G. & Howard, D. J. Clustering of contact zones, hybrid zones, and phylogeographic breaks in North America. Am. Nat.
166, 581–91 (2005).
10. Neiva, J., Pearson, G. A., Valero, M. & Serrão, E. A. Fine-scale genetic breaks driven by historical range dynamics and ongoing density-barrier effects in the estuarine seaweed Fucus ceranoides L. BMC Evol. Biol. 12, 78 (2012).
11. Unckless, R. L. & Orr, H. A. Dobzhansky-Muller incompatibilities and adaptation to a shared environment. Heredity 102, 214–217 (2009).
12. Wallis, G. P., Waters, J. M., Upton, P. & Craw, D. Transverse Alpine Speciation Driven by Glaciation. Trends Ecol. Evol. 31, 916–26 (2016).
13. Casazza, G., Grassi, F., Zecca, G. & Minuto, L. Phylogeographic insights into a peripheral refugium: The importance of cumulative effect of glaciation on the genetic structure of two endemic plants. PLoS One 11, e0166983 (2016).
14. Norris, R. D. & Hull, P. M. The temporal dimension of marine speciation. Evol. Ecol. 26, 393–415 (2012). 15. Rocha, L. A. & Bowen, B. W. Speciation in coral-reef fishes. J. Fish Biol. 72, 1101–1121 (2008).
16. Horne, J. B. Thinking outside the barrier: neutral and adaptive divergence in Indo-Pacific coral reef faunas. Evol. Ecol. 28, 991–1002 (2014).
17. Neiva, J., Pearson, G. A., Valero, M. & Serrão, E. A. Drifting fronds and drifting alleles: the genetic architecture of the estuarine seaweed Fucus ceranoides L. J. Biogeogr. 39, 1167–1178 (2012).
18. Fraser, C. I., Nikula, R., Spencer, H. G. & Waters, J. M. Kelp genes reveal effects of subantarctic sea ice during the Last Glacial Maximum. Proc. Natl. Acad. Sci. USA 106, 3249–3253 (2009).
19. Dunton, K. H. Arctic Biogeography: The Paradox of the Marine Benthic Fauna and Flora. Trends Ecol. Evol. 7, 183–189 (1992). 20. Assis, J. et al. Deep reefs are climatic refugia for genetic diversity of marine forests. J. Biogeogr. 43, 833–844 (2016).
21. Hobbs, J.-P. A., Frisch, A. J., Allen, G. R. & Van Herwerden, L. Marine hybrid hotspot at Indo-Pacific biogeographic border. Biol.
Lett. 5, 258–61 (2009).
22. Waltari, E. & Hickerson, M. J. Late Pleistocene species distribution modelling of North Atlantic intertidal invertebrates. J. Biogeogr.
40, 249–60 (2013).
23. Dolby, G. A. et al. Sea-level driven glacial-age refugia and post-glacial mixing on subtropical coasts, a palaeohabitat and genetic study. Proc. R. Soc. Biol. Sci. 283, 20161571 (2016).
24. McDevit, D. C. & Saunders, G. W. A. DNA barcode examination of the Laminariaceae (Phaeophyceae) in Canada reveals novel biogeographical and evolutionary insights. Phycologia 49, 235–248 (2010).
25. Druehl, L., Foottit, R. G. & Masuda, M. Morphological affinities of Japanese species of Laminaria (Phaeophyta). Phycologia 27, 405–412 (1988).
26. Kawashima, S. Taxonomic and distributional remarks on the laminariaceous algae (Laminariales, Phaeophyceae) of Japan: 21 Laminariaceae (2). Aquabiology 65, 484–487 (1989).
27. Longtin, C. M. & Saunders, G. W. On the utility of mucilage ducts as a taxonomic character in Laminaria and Saccharina (Phaeophyceae) – the conundrum of S. groenlandica. Phycologia 54, 440–450 (2015).
28. Lane, C. E., Mayes, C., Druehl, L. D. & Saunders, G. W. A multi-gene molecular investigation of the kelp (Laminariales, Phaeophyceae) supports substantial taxonomic re-organization. J. Phycol. 42, 493–512 (2006).
29. Bartsch, I. et al. The genus Laminaria sensu lato: recent insights and developments. Eur. J. Phycol. 43, 1–86 (2008).
30. Yoon, H. S., Lee, J. Y., Boo, S. M. & Bhattacharya, D. Phylogeny of Alariaceae, Laminariaceae, and Lessoniaceae (Phaeophyceae) based on plastid-encoded RuBisCo spacer and nuclear-encoded ITS sequence comparisons. Mol. Phylogenet. Evol. 21, 231–243 (2001).
31. Lüning, K. Seaweeds: Their Environment, Biogeography, and Ecophysiology. (Wiley-Interscience, 1990).
32. Lane, C. E., Lindstrom, S. C. & Saunders, G. W. A molecular assessment of northeast Pacific Alaria species (Laminariales, Phaeophyceae) with reference to the utility of DNA barcoding. Mol. Phylogenet. Evol. 44, 634–48 (2007).
33. Saunders, G. W. & McDevit, D. C. A. DNA barcode survey of Haida Gwaii kelp (Laminariales, Phaeophyceae) reveals novel ecological and distributional observations and Saccharina druehlii sp. nov. Botany 92, 821–826 (2014).
34. McDevit, D. C. & Saunders, G. W. On the utility of DNA barcoding for species differentiation among brown macroalgae (Phaeophyceae) including a novel extraction protocol. Phycol. Res. 57, 131–141 (2009).
35. Macaya, E. C. & Zuccarello, G. C. DNA barcoding and genetic divergence in the giant kelp Macrocystis (laminariales). J. Phycol. 46, 736–742 (2010).
36. Yotsukura, N. et al. Little divergence in ribosomal DNA internal transcribed spacer −1 and −2 sequences among non digitate species of Laminaria (Phaeophyceae) from Hokkaido, Japan. Phycol. Res. 47, 71–80 (1999).
37. Balakirev, E. S., Krupnova, T. N. & Ayala, F. J. DNA variation in the phenotypically-diverse brown alga Saccharina japonica. BMC
Plant Biol. 12, 108 (2012).
38. Hasegawa, M., Kishino, H. & Yano, T. Dating of the Human-Ape Splitting by a Molecular Clock of Mitochondrial DNA. J. Mol. Evol.
22, 160–174 (1985).
39. Zhang, J. et al. Phylogeographic data revealed shallow genetic structure in the kelp Saccharina japonica (Laminariales, Phaeophyta).
BMC Evol. Biol. 15, 237 (2015).
40. Yotsukura, N., Shimizu, T., Katayama, T. & Druehl, L. D. Mitochondrial DNA sequence variation of four Saccharina species (Laminariales, Phaeophyceae) growing in Japan. J. Appl. Phycol. 22, 243–251 (2009).
41. Selivanova, O. N., Zhigadlova, G. G. & Hansen, G. I. Revision of the systematics of algae in the order Laminariales (Phaeophyta) from the Far-Eastern Seas of Russia on the basis of molecular-phylogenetic data. Russ. J. Mar. Biol. 33, 278–289 (2007).
42. Saunders, G. W. A. DNA barcode examination of the red algal family Dumontiaceae in Canadian waters reveals substantial cryptic species diversity. 1. The foliose Dilsea – Neodilsea complex and Weeksia. Botany 86, 773–789 (2008).
43. Saunders, G. W. & McDevit, D. C. DNA barcoding unmasks overlooked diversity improving knowledge on the composition and origins of the Churchill algal flora. BMC Ecol. 13, 9 (2013).
44. Bolton, J. J., Germann, I. & Luning, K. Hybridization between Atlantic and Pacific representatives of the Simplices section of
Laminaria (Phaeophyta). Phycologia 22, 133–140 (1983).
45. Neiva, J., Assis, J., Fernandes, F., Pearson, G. A. & Serrão, E. A. Species distribution models and mitochondrial DNA phylogeography suggest an extensive biogeographical shift in the high-intertidal seaweed Pelvetia canaliculata. J. Biogeogr. 41, 1137–1148 (2014). 46. Cronin, T. M. & Cronin, M. A. Biological response to climate change in the Arctic Ocean: the view from the past. Arktos 1, 4 (2015). 47. Polyak, L., Edwards, M. H., Coakley, B. J. & Jakobsson, M. Ice shelves in the Pleistocene Arctic Ocean inferred from glaciogenic
deep-sea bedforms. Nature 410, 453–457 (2001).
48. Clarke, A. & Crame, J. A. Evolutionary dynamics at high latitudes: speciation and extinction in polar marine faunas. Philos. Trans.
R. Soc. Lond. B. Biol. Sci. 365, 3655–3666 (2010).
49. Ingólfsson, A. A marine refugium in Iceland during the last glacial maximum: Fact or fiction? Zool. Scr. 38, 663–665 (2009). 50. Laakkonen, H. M., Strelkov, P. & Väinölä, R. Molecular lineage diversity and inter-oceanic biogeographical history in Hiatella
(Mollusca, Bivalvia). Zool. Scr. 44, 383–402 (2015).
51. Laakkonen, H. M., Lajus, D. L., Strelkov, P. & Väinölä, R. Phylogeography of amphi-boreal fish: tracing the history of the Pacific herring Clupea pallasii in North-East European seas. BMC Evol. Biol. 13, 67 (2013).
52. Jones, E. P. Tracing Pacific water in the North Atlantic Ocean. J. Geophys. Res. 108, 3116 (2003).
53. Dyke, A. S. An outline of North American deglaciation with emphasis on central and northern Canada. Dev. Quat. Sci. 2, 373–424 (2004).
54. Peltier, W. R., Argus, D. F. & Drummond, R. Space geodesy constrains ice age terminal deglaciation: The global ICE-6G_C (VM5a) model. J. Geophys. Res. Solid Earth 120, 450–487 (2014).
55. Blix, A. S. Arctic animals and their adaptations to life on the edge. (Tapir Academic Press, 2005).
56. Spiridonov, V. A., Gavrilo, M. V., Krasnova, E. D. & Nikolaeva, N. G. Atlas of marine and coastal biological diversity of the Russian
Arctic. (WWF Russia, 2011).
57. Assis, J., Serrão, E. A., Claro, B., Perrin, C. & Pearson, G. A. Climate-driven range shifts explain the distribution of extant gene pools and predict future loss of unique lineages in a marine brown alga. Mol. Ecol. 23, 2797–810 (2014).
58. Stewart, J. R. & Dalén, L. Is the glacial refugium concept relevant for northern species? A comment on Pruett and Winker 2005.
Clim. Change 86, 19–22 (2007).
59. Coyer, J. A., Hoarau, G., Van Schaik, J., Luijckx, P. & Olsen, J. L. Trans-Pacific and trans-Arctic pathways of the intertidal macroalga
Fucus distichus L. reveal multiple glacial refugia and colonizations from the North Pacific to the North Atlantic. J. Biogeogr. 38,
756–771 (2011).
60. Dodson, J. J., Tremblay, S., Colombani, F., Carscadden, J. E. & Lecomte, F. Trans-Arctic dispersals and the evolution of a circumpolar marine fish species complex, the capelin (Mallotus villosus). Mol. Ecol. 16, 5030–5043 (2007).
61. Shen, Y.-Y., Chen, X. & Murphy, R. W. Assessing DNA barcoding as a tool for species identification and data quality control. PLoS
One 8, e57125 (2013).
62. Muller, R., Wiencke, C. & Bischof, K. Interactive effects of UV radiation and temperature on microstages of Laminariales (Phaeophyceae) from the Arctic and North Sea. Clim. Res. 37, 203–213 (2008).
63. Krause-Jensen, D. et al. Seasonal sea ice cover as principal driver of spatial and temporal variation in depth extension and annual production of kelp in Greenland. Glob. Chang. Biol. 18, 2981–2994 (2012).
64. Møller, N. M. et al. Genetic diversity of Saccharina latissima (Phaeophyceae) along a salinity gradient in the North Sea-Baltic Sea transition zone. J. Phycol. 52, 523–531 (2016).
65. Darriba, D., Taboada, G. L., Doallo, R. & Posada, D. jModelTest 2: more models, new heuristics and parallel computing. Nat.
Methods 9, 772 (2012).
66. Ronquist, F. et al. Mrbayes 3.2: Efficient bayesian phylogenetic inference and model choice across a large model space. Syst. Biol. 61, 539–542 (2012).
67. Guindon, S. et al. New algorithms and methods to estimate Maximum-Likelihood phylogenies: Assessing the performance of PhyML 3.0. Syst. Biol. 59, 307–321 (2010).
68. Bandelt, H. J., Forster, P. & Röhl, A. Median-joining networks for inferring intraspecific phylogenies. Mol. Biol. Evol. 16, 37–48 (1999).
69. Kumar, S., Stecher, G. & Tamura, K. MEGA7: Molecular Evolutionary Genetics Analysis version 7.0 for bigger datasets. Mol. Biol.
70. Kimura, M. A simple method for estimating evolutionary rates of base substitutions through comparative studies of nucleotide sequences. J. Mol. Evol. 16, 111–120 (1980).
71. Paulino, C. et al. Characterization of 12 polymorphic microsatellite markers in the sugar kelp Saccharina latissima. J. Appl. Phycol.
28, 3071–3074 (2016).
72. Alberto, F. MsatAllele-1.0: An R package to visualize the binning of microsatellite alleles. J. Hered. 100, 394–397 (2009).
73. Belkhir, K., Borsa, P., Chikhi, L., Raufaste, N. & Bonhomme, F. GENETIX 4.05, logiciel sous Windows TM pour la génétique des populations. (1996).
74. Frichot, E. & François, O. LEA: An R package for landscape and ecological association studies. Methods Ecol. Evol. 6, 925–929 (2015).
75. Falush, D., Stephens, M. & Pritchard, J. K. Inference of population structure using multilocus genotype data: linked loci and correlated allele frequencies. Genetics 164, 1567–1587 (2003).
76. Cornuet, J. M. et al. Inferring population history with DIY ABC: A user-friendly approach to approximate Bayesian computation.
Bioinformatics 24, 2713–2719 (2008).
77. Razgour, O. et al. The shaping of genetic variation in edge-of-range populations under past and future climate change. Ecol. Lett. 16, 1258–1266 (2013).
78. Cornuet, J.-M., Ravigné, V. & Estoup, A. Inference on population history and model checking using DNA sequence and microsatellite data with the software DIYABC (v1.0). BMC Bioinformatics 11, 401 (2010).
79. Louis, M. et al. Ecological opportunities and specializations shaped genetic divergence in a highly mobile marine top predator. Proc.
R. Soc. B Biol. Sci. 281, 20141558–20141558 (2014).
Acknowledgements
The authors thank Marta Valente (CCMAR) for sequencing and genotyping work and all the people involved in sample collection – Rosa Jonsdottir (Iceland), Mikhail Makarov (Russia), Egon Frandsen (Daneborg), Carlos Duarte (Disko Bay), Stéphanie Pieddesaux and other ÉT colleagues (Gulf of Saint Lawrence), Tanya Moore and other Saunders’s lab members (throughout Canada), and the staff on Hurtigruten’s FRAM cruise 2009 and 2010 for help with sampling along the west coast of Greenland. This work was funded by the Pew Foundation (USA), the Portuguese FCT (Fundação para a Ciência e a Tecnologia) through programs GENEKELP (PTDC/ MAR-EST/6053/2014), MARFOR (Biodiversa/0004/2015), UID/Multi/04326/2013 and postdoctoral fellowships to JN (SFRH/BPD/88935/2012) and JA (SFRH/BPD/111003/2015). ÉT was funded by grants from NSERC and FRQNT. GWS was supported through funding from NSERC, the Canada Foundation for Innovation and the New Brunswick Innovation Foundation. DKJ received financial support from the European Union’s Seventh Framework Programme, grant agreement no. 226248 – Arctic Tipping Points (ATP), and the Danish Environmental Protection Agency within the Danish Cooperation for Environment in the Arctic (DANCEA). The study also received logistic support from the Greenland Ecosystem Monitoring programme (www.G-E-M.dk).
Author Contributions
D.K.J., J.N., G.W.S., G.A.P., E.A.S. designed the research. G.W.S., É.T., D.K.J., M.M.N., I.B., A.B., N.M., T.A., E.A.S. collected the samples. C.P., L.G., M.M.N., G.W.S., obtained sequence and genotypic data. J.N., J.A., C.P., M.M.N., conducted the phylogenetic, population structure and demographic analyses. J.N. led the writing. All authors read, edited, and approved the final manuscript.
Additional Information
Supplementary information accompanies this paper at https://doi.org/10.1038/s41598-018-19620-7. Competing Interests: The authors declare that they have no competing interests.
Publisher's note: Springer Nature remains neutral with regard to jurisdictional claims in published maps and institutional affiliations.
Open Access This article is licensed under a Creative Commons Attribution 4.0 International License, which permits use, sharing, adaptation, distribution and reproduction in any medium or format, as long as you give appropriate credit to the original author(s) and the source, provide a link to the Cre-ative Commons license, and indicate if changes were made. The images or other third party material in this article are included in the article’s Creative Commons license, unless indicated otherwise in a credit line to the material. If material is not included in the article’s Creative Commons license and your intended use is not per-mitted by statutory regulation or exceeds the perper-mitted use, you will need to obtain permission directly from the copyright holder. To view a copy of this license, visit http://creativecommons.org/licenses/by/4.0/.