1 Universidade Estadual do Ceará, Centro de Ciências da Saúde, Programa de Pós-Graduação em Saúde Coletiva. Av. Dr.
Silas Munguba, 1700, Campus do Itaperi, 60741-000, Fortaleza, CE, Brasil. Correspondência para/Correspondence to: EPM STUDART. E-mail: <[email protected]>.
2 Universidade de São Paulo, Centro de Ciências da Saúde, Departamento de Nutrição. São Paulo, SP, Brasil.
Support: Ministério da Ciência, Tecnologia e Inovação/Conselho Nacional de Desenvolvimento Científico e Tecnológico/Mi-nistério da Saúde/Secretaria de Ciência, Tecnologia e Insumos Estratégicos – Decit nº 07/2013 – Política Nacional de Práticas Integrativas e Complementares no Sistema Único de Saúde – área de Plantas Medicinais e Fitoterapia.
Article based on the master’s thesis of EPM STUDART, entitled “Padrões alimentares e associação com níveis glicêmicos e perfil lipídico de pacientes diabéticos tipo 2”. Universidade Estadual do Ceará; 2017.
Como citar este artigo/How to cite this article
Studart EPM, Arruda SPM, Sampaio HAC, Passos TU, Carioca AAF. Dietary patterns and glycemic indexes in type 2 diabetes patients. Rev Nutr. 2018;31(1):1-12. https://doi.org/10.1590/1678-98652018000100001
Dietary patterns and glycemic indexes in
type 2 diabetes patients
Padrões alimentares e níveis glicêmicos de
pacientes com diabetes tipo 2
Elainy Peixoto Mariano STUDART1 0000-0002-0199-1139
Soraia Pinheiro Machado ARRUDA1 0000-0002-3918-4738
Helena Alves de Carvalho SAMPAIO1 0000-0001-8009-6898
Tatiana Uchôa PASSOS1 0000-0002-7604-5948
Antonio Augusto Ferreira CARIOCA1 0000-0002-1194-562X
A B S T R A C T
Objective
To identify the main dietary patterns in type 2 diabetes patients and study their association with glycemic indexes.
Methods
This is a cross-sectional study carried out in a diabetes treatment reference institution located in the city of
Results
A hundred eighty eight diabetic patients were evaluated, of which 51.1% patients had decompensated glucose values. Five main dietary patterns were identified: traditional Brazilian, energy-dense, infusion and wholegrain cereal, sandwich and dairy, and healthy diets, which explained 37.2% of the total variance in intake. A negative correlation with glucose was found for the traditional Brazilian diet (p=0.018; r=-0.173).
Conclusion
Out of the five identified dietary patterns consumed by the type 2 diabetes patients studied, a higher adherence to the traditional Brazilian dietary patterns resulted in lower blood glucose levels.
Keywords: Blood Glucose. Diabetes Mellitus. Feeding behavior.
R E S U M O
Objetivo
Este estudo tem como objetivo identificar os principais padrões de consumo alimentar de pacientes diabéticos tipo 2, bem como investigar sua associação com níveis glicêmicos.
Métodos
Trata-se de um estudo transversal realizado em uma instituição de referência no tratamento do diabetes na cidade de Fortaleza (CE). Foi realizada aplicação de dois R24h, bem como aferição de glicemia de jejum de 12h e medidas antropométricas em 188 pacientes diabéticos. Foi utilizado o método de Análise fatorial por Componentes Principais e rotação ortogonal Varimax para identificação dos padrões alimentares. Regressão de Poisson e coeficiente de correlação de Spearman foram utilizados para testar a associação com os níveis glicêmicos.
Resultados
Foram avaliados 188 pacientes diabéticos, dos quais 51,1% apresentaram valores de glicemia descompensada. Foram identificados cinco principais padrões alimentares – tradicional brasileiro; denso em energia; infusões e cereais integrais; sanduíches e lácteos; e saudável – os quais explicaram 37,2% da variância total de ingestão. O padrão tradicional brasileiro apresentou correlação negativa com os níveis glicêmicos (p=0,018; r=-0,173).
Conclusão
Dos cinco padrões identificados como consumidos pelos diabéticos tipo 2 estudados, a maior adesão ao padrão tradicional brasileiro indicou menores níveis glicêmicos.
Palavras-chave: Glicemia. Diabetes Mellitus. Comportamento alimentar.
I N T R O D U C T I O N
The incidence of diabetes has progressively increased in the world, and to a greater extent in developing countries [1,2], as the prevalence of diabetes affected more than 300 million people in 2013 [3].
Type 2 diabetes is characterized as being a disturbance in the efficient metabolism of glucose and it is related to a considerable increase in the risk of cardiovascular diseases, which can lead to serious complications [3].
Most people with this type of diabetes are overweight or obese and do not rely on exogenous insulin to survive, but may require its use only as a treatment for metabolic control [4].
insufficient physical exercise, and unhealthy food consumption [1,5]. These facts show that environmental elements are the main causes of the increase of type 2 diabetes [4,6].
It is evident that the diet is one of the main risk factors that modifies other risk factors [7]. With the onset of diabetes, food choice and eating habits play a crucial role in controlling disease progression [8].
In traditional epidemiology, the main nutritional approach is to investigate the nutrients or food and their relationship with chronic diseases, including diabetes. However, the human diet is complex, since foods are not consumed in isolation and the nutrients operate in a synergistically or inhibitory way, making it difficult to detect these possible associations. This fact justifies the global consideration of the use of dietary patterns as an alternative to overcome these limitations, analyzing the effects
of multiple dietary factors on the individual’s
health [7,9].
Thus, it is important to know the eating patterns of diabetic individuals and their association with clinical aspects of the disease. In Brazil, we have not found any studies that analyze the dietary patterns among diabetics, nor their relationship with glycemic control.
In this context, the aim of the present study was to identify the main eating consumption patterns of type 2 diabetic patients and investigate their association with glycemic levels.
M E T H O D S
This cross-sectional study was carried out at an important diabetes treatment institution
that receives patients from the Sistema Único de
Saúde (SUS, Unified Health System), in Fortaleza
(CE).
The study population consisted of 188 diabetic female and male patients; patients with
type 2 diabetes Mellitus diagnosed more than 2
years ago (thus, identifying the glycemic control
of the individuals); the patients were continuously monitored at the institution; adults or elderly
(age ≥20 years); Body Mass Index (BMI) of
25.0-34.9kg/m²; use of oral hypoglycemic agentes such as metformin hydrochloride, glibenclamide and/or glicazide, which are distributed by SUS; and they were not on insulin; The patients were not affected by other known diseases, except those commonly associated
with type 2 diabetes Mellitus (hypertension,
dyslipidemia, diabetic dermopathy, among others). Since many diabetics are overweight, the BMI was standardized because advanced obesity has more negative metabolic consequences than overweight [9] and obesity grade I.
The research was approved by the
Research Ethics Committee of Universidade
Estadual do Ceará (UECE) under report CAAE
nº 30308114.1.0000.5534. The interviews were carried out through a semi-structured form, containing data related to sex, age, race (self-reported), years of education, occupation, monthly income, use of medications, and known health problems.
The 24-hour food recall (R24h) and 12-h fasting glycemia were evaluated using the Alere
Cholestech LDX® device (Alere, São Paulo, São
Paulo, Brasil) and anthropometric measurements
of weight, height, and waist circumference. Two R24h were used, one being collected during the interview and the other one was filled out on a weekend day and collected by telephone [10].
According to the American Diabetes Association (ADA) [11], glycemic levels are considered controlled when values are lower than 130mg/dL for fasting glycemia and uncontrolled when they are equal to or greater than 130mg/dL.
items to be listed. The adjusted mean weight by the intra-individual variance of the two R24h was then calculated by the Multiple Source Method (MSM), which represented the dietary variable used in the analysis to identify the dietary patterns.
The Principal Component exploratory factorial Analysis (PCA) was used, followed by Varimax orthogonal rotation, to identify the dietary patterns of the group studied.
This analysis collected the food variables based on the degree to which they are related to each other and the scores for each factor allows the categorization into groups, such as quartiles. This technique is widely used to reduce data and build a theory [13].
Bartlett’s sphericity test and the Kaiser-Meyer-Olkin coefficient (KMO) were carried out
at a cut-off value of p≤0.05 and KMO≥0.50,
respectively [14-16], indicating satisfactory level of confidence for the factorial analysis.
The criteria that determined the number of factors retained were the components with eigenvalues higher than 1.0, Cattel scree plot, in which the number of points on the more declined determine the appropriate number of factors to be retained, and the conceptual significance of the patterns was identified [13]. After establishing the factors, they were rotated by the Varimax method.
The principal components were formed as the foods presented important factorial
loads, established at ≥0.3 (indicating direct
correlation with the pattern) or ≤-0.3 (inverse
correlation with the pattern) [17]. In nutritional epidemiology, these techniques aim at building linear combinations of food intake to explain the high rate of variation in food consumption in general [13].
The nutritional composition of the foods in each component were determinant for their appointment and denominations previously used in other studies were prioritized when the composition pattern was similar.
Each individual received a score for each principal component. These were categorized into quartiles and the upper quartile indicated greater adherence to the dietary pattern.
Statistical analysis was performed using the Stata program, version 12.0. (Stata Corporation, College Station, Texas, United States) Initially, descriptive analysis of the data was performed, the categorical variables were presented in simple and percentage frequencies, and numerical variables presented as means (standard deviation) or median (interquartile range), which were determined by the Shapiro-Wilk test that tested the normality of these variables.
To evaluate the association between the dietary patterns and glycemic levels, a Poisson regression with robust variance estimation was used, which indicated the Prevalence Ratios (PR) of independent variables (dietary patterns) in relation to the outcomes, and classified the dependent variable (glycemic level) as dichotomous: controlled and uncontrolled. Bivariate and multivariate analyses were carried out. The multivariate analysis was verified by two adjusted analyses, one for sociodemographic data (education, income, age and sex) (model I) and the other one for nutritional status (model II).
Spearman’s correlation coefficient was
used to verify the correlation between the factorial scores (quartiles) in each pattern and blood glucose levels. Estimates were measured by points and intervals with 95% confidence and at a 5% significance level.
R E S U L T S
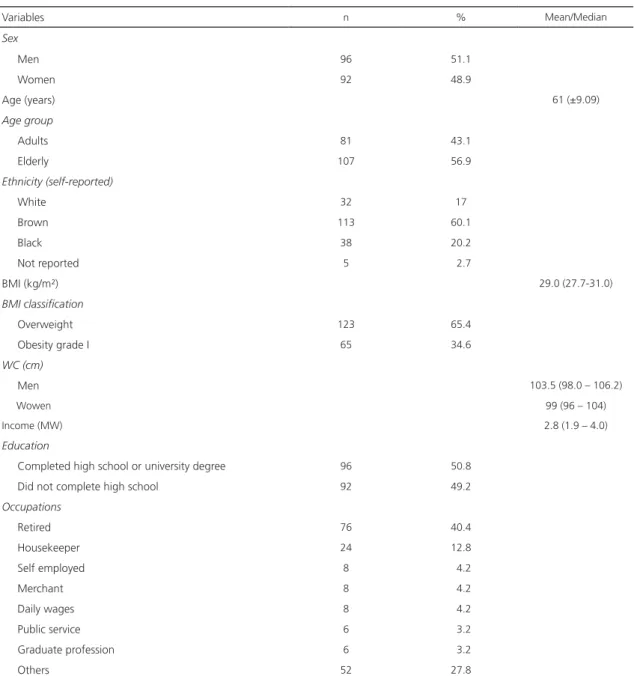
The study sample consisted of 188 diabetics, of which 56.9% were elderly and 51.1% were men. The mean age of the individuals was 61 years (±9.09), with a median income of 2.8 minimum wages (1.9-4.0) and 49.2% of them had not completed high school.
were found. The median Waist Circumference (WC) for men was 103.5cm (98-106.3) and for women 99 cm (96-104) of the diabetics studied, 76.5% presented waist circumference above the normality parameters (Table 1).
In addition to diabetes, other pathologies diagnosed were: hypertension, Cardiovascular Disease (CVD), dyslipidemia, hypothyroidism, arthrosis, neuropathy, depression, fibromyalgia, gastritis, glaucoma, labyrinthitis, diverticulitis,
and renal failure. The most common drugs administered were hypoglycemic agents (glibenclamide, gliclazide, metformin, glifage, glimepiride, diamicron, galvus), antihypertensives (atenolol, enalapril, ramipril, captopril, losartan, amlodipine, natrilix), statins (atorvastatin, simvastatin), diuretics (hydrochlorothiazide, furosemide), among others such as aspirin and omeprazole.
After confirming the adequacy of the
data by the KMO coefficient (0.5) and Bartlett’s
Table 1. Anthropometric and socioeconomic characteristics of the type 2 diabetic patients interviewed. Fortaleza (CE), Brazil, 2017.
Variables n % Mean/Median
Sex
Men 96 51.1
Women 92 48.9
Age (years) 61 (±9.09)
Age group
Adults 81 43.1
Elderly 107 56.9
Ethnicity (self-reported)
White 32 17
Brown 113 60.1
Black 38 20.2
Not reported 5 02.7
BMI (kg/m²) 29.0 (27.7-31.0)
BMI classification
Overweight 123 65.4
Obesity grade I 65 34.6
WC (cm)
Men 103.5 (98.0 – 106.2)
Wowen 99 (96 – 104)
Income (MW) 2.8 (1.9 – 4.0)
Education
Completed high school or university degree 96 50.8
Did not complete high school 92 49.2
Occupations
Retired 76 40.4
Housekeeper 24 12.8
Self employed 8 04.2
Merchant 8 04.2
Daily wages 8 04.2
Public service 6 03.2
Graduate profession 6 03.2
Others 52 27.8
Chart 1. Food distribution in each group. Fortaleza (CE), Brazil, 2017.
Food groups Food
Sweetening Sweeteners
Rice White rice, rice with milk, parboiled rice. Poultry Chicken, roasted turkey, chicken, vatapá. Oils and oilseeds Olive oil, peanuts, nuts.
Industrialized beverages Soft drinks, industrialized juices.
Biscuits and cakes Sweet biscuits, salty biscuits, fried cake, cake without filling, broccoli, arrowroot biscuit, cake Coffee and infusions Coffee, tea.
Beef and pork Beef, pork, viscera.
Whole grains Barley, brown rice, oats, cereal bar, chia, granola, flaxseed, whole wheat bread.
Regional Foods Beans and rice, couscous, flour, corn on the cob, mungunzá, paçoca, pamonha, pirão, tapioca,
canjica, popcorn.
Sweets Chocolate powder, sugar, filled biscuits, cake with filling, chocolate, churros, jam, gelatin, ice cream. Beans Feijoada, beans.
Fruits and natural juices Avocado, pineapple, açaí, plum, banana, cashew, kaki, guava, kiwi, orange, lemon, apple, papaya, mango, watermelon, melon, strawberry, noni, pear, sapoti, tangerine, grape, water coconut, and natural juices.
Fats Sauce, mayonnaise, butter, margarine, pate.
Dairy products and porridge Skim curd, skimmed yogurt, soymilk, skim milk, white cheese, light curd cheese, whole curd, yogurt, whole milk, cream, cheese, traditional curd, sour cream, porridge.
Pasta Macaroni, pasta, fried pasta, pizza, salted snacks, sandwich, natural sandwich. Egg Egg, omelet, eggnogg.
White bread Toast, bread. Fish and seafood Shrimp, fish, seafood.
Roots and tubers Potato, sweet potato, beetroot, carrot, manioc, potato chips. Soups and broths Risotto, soups, and broths.
Ultra-processed Canned olive, processed meat, sausages, canned corn, canned peas, coconut milk, 3-minute pasta, canned fish, microwave popcorn, ketchup, industrialized snacks.
Vegetables Garlic, vinaigrette, zucchini, broccoli, onion, green odor, chuchu, gherkin, cucumber, chili, okra, pumpkin, tomato, chard, lettuce, cauliflower, cabbage butter, spinach, cabbage, arugula.
Fruit smoothy Smoothies.
sphericity test (p<0.001), the 24 food groups
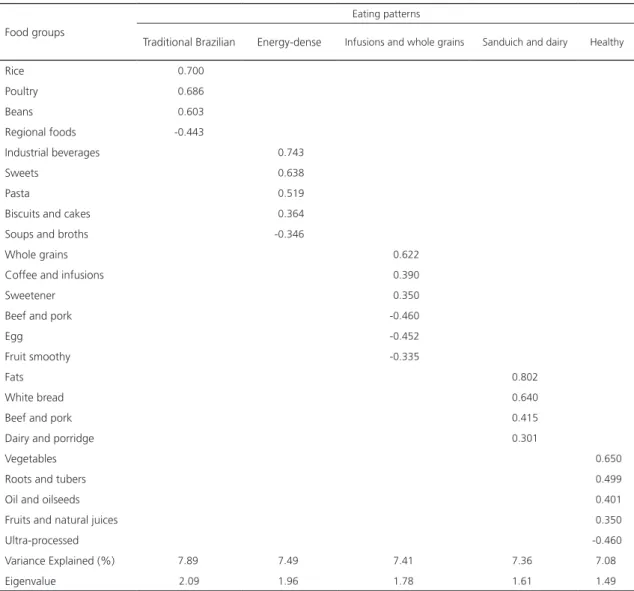
that were included in the analysis (Chart 1) resulted in five identified eating patterns, which were denominated as follows: traditional Brazilian, energy-dense, infusion and whole grain cereal, sandwich and dairy, and healthy dietary patterns, which together explained 37.2% of the total variance in intake.
Foods in the traditional Brazilian pattern were those that are most commonly consumed by the Brazilian population, such as rice, beans and poultry (with negative load for regional foods in the northeast). The energy-dense pattern was
composed of processed beverages, biscuits and cakes, sweets and pasta with a negative load for soups and broths. The infusion and whole grain pattern included sweetener, coffee and infusions and whole grain cereals with a negative load for bovine and pork, eggs and smoothies. The sandwich and dairy pattern consisted of beef and pork, dairy and porridges, white bread and fats. The healthy pattern was composed of foods such as oil and oilseeds, fruits and natural juices, roots and tubers and vegetables with a negative load for ultra-processed foods (Table 2).
131mg/dL (109.5-152.5). The glycemic values were negatively correlated only with the traditional
Brazilian pattern (p=0.018; r=-0.173) (Table 3).
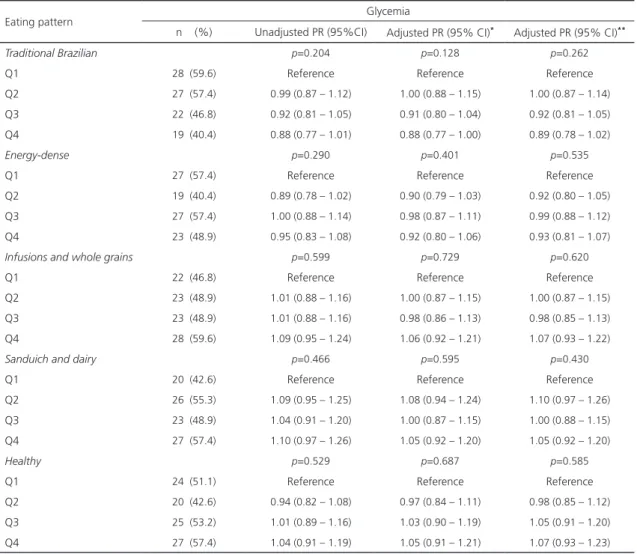
No associations between adherence to dietary patterns and the glycemic level category were observed in the bivariate and multivariate association analyses, and adjustment models I and II (Table 4).
D I S C U S S I O N
In the present study, five main eating patterns of the diabetics (traditional Brazilian,
Table 2. Distribution of the factorial load of main eating patterns identified in type 2 diabetics. Fortaleza (CE), Brazil, 2017.
Food groups
Eating patterns
Traditional Brazilian Energy-dense Infusions and whole grains Sanduich and dairy Healthy
Rice -0.700
Poultry -0.686
Beans -0.603
Regional foods -0.443
Industrial beverages -0.743
Sweets -0.638
Pasta -0.519
Biscuits and cakes -0.364
Soups and broths -0.346
Whole grains -0.622
Coffee and infusions -0.390
Sweetener -0.350
Beef and pork -0.460
Egg -0.452
Fruit smoothy -0.335
Fats 0.802
White bread 0.640
Beef and pork 0.415
Dairy and porridge 0.301
Vegetables -0.650
Roots and tubers -0.499
Oil and oilseeds -0.401
Fruits and natural juices -0.350
Ultra-processed -0.460
Variance Explained (%) -7.890 -7.490 -7.410 7.360 -7.080
Eigenvalue -2.09- -1.960 -1.780 1.610 -1.490
Note: Foods with factorial load ≥0.3 and ≤-0.3; Total variance: 37.2%.
Table 3. Correlation between glycemic levels and dietary patterns of type 2 diabetic patients. Fortaleza (CE), Brazil, 2017.
Patterns r p
Traditional Brazilian -0.173 0.018
Energy-dense -0.028 0.704
Infusions and whole grains 0.018 0.810 Sandwich and Dairy 0.125 0.087
Healthy 0.105 0.151
Note: r: Spearman’s correlation coefficient.
Table 4. Unadjusted and adjusted Prevalence Ratio (PR) and Confidence Interval (95% CI) for the association between glycemia and eating patterns in type 2 diabetic patients. Fortaleza (CE), Brazil, 2017.
Eating pattern Glycemia
n (%) Unadjusted PR (95%CI) Adjusted PR (95% CI)* Adjusted PR (95% CI)**
Traditional Brazilian p=0.204 p=0.128 p=0.262
Q1 28 (59.6) Reference Reference Reference
Q2 27 (57.4) 0.99 (0.87 – 1.12) 1.00 (0.88 – 1.15) 1.00 (0.87 – 1.14) Q3 22 (46.8) 0.92 (0.81 – 1.05) 0.91 (0.80 – 1.04) 0.92 (0.81 – 1.05) Q4 19 (40.4) 0.88 (0.77 – 1.01) 0.88 (0.77 – 1.00) 0.89 (0.78 – 1.02)
Energy-dense p=0.290 p=0.401 p=0.535
Q1 27 (57.4) Reference Reference Reference
Q2 19 (40.4) 0.89 (0.78 – 1.02) 0.90 (0.79 – 1.03) 0.92 (0.80 – 1.05) Q3 27 (57.4) 1.00 (0.88 – 1.14) 0.98 (0.87 – 1.11) 0.99 (0.88 – 1.12) Q4 23 (48.9) 0.95 (0.83 – 1.08) 0.92 (0.80 – 1.06) 0.93 (0.81 – 1.07)
Infusions and whole grains p=0.599 p=0.729 p=0.620
Q1 22 (46.8) Reference Reference Reference
Q2 23 (48.9) 1.01 (0.88 – 1.16) 1.00 (0.87 – 1.15) 1.00 (0.87 – 1.15) Q3 23 (48.9) 1.01 (0.88 – 1.16) 0.98 (0.86 – 1.13) 0.98 (0.85 – 1.13) Q4 28 (59.6) 1.09 (0.95 – 1.24) 1.06 (0.92 – 1.21) 1.07 (0.93 – 1.22)
Sanduich and dairy p=0.466 p=0.595 p=0.430
Q1 20 (42.6) Reference Reference Reference
Q2 26 (55.3) 1.09 (0.95 – 1.25) 1.08 (0.94 – 1.24) 1.10 (0.97 – 1.26) Q3 23 (48.9) 1.04 (0.91 – 1.20) 1.00 (0.87 – 1.15) 1.00 (0.88 – 1.15) Q4 27 (57.4) 1.10 (0.97 – 1.26) 1.05 (0.92 – 1.20) 1.05 (0.92 – 1.20)
Healthy p=0.529 p=0.687 p=0.585
Q1 24 (51.1) Reference Reference Reference
Q2 20 (42.6) 0.94 (0.82 – 1.08) 0.97 (0.84 – 1.11) 0.98 (0.85 – 1.12) Q3 25 (53.2) 1.01 (0.89 – 1.16) 1.03 (0.90 – 1.19) 1.05 (0.91 – 1.20) Q4 27 (57.4) 1.04 (0.91 – 1.19) 1.05 (0.91 – 1.21) 1.07 (0.93 – 1.23)
Note: *Prevalence ratio adjusted for sociodemographic factors (education, income, age group and sex); **Prevalence ratio adjusted for
demographic factors (education, income, age and sex) and nutritional status (BMI). Poisson analysis with robust variance estimation; P:trend value.
identified and an inverse correlation between glycemia and the traditional Brazilian pattern was observed, indicating that the higher the adherence to this dietary pattern, the lower the blood glucose values.
The so-called traditional Brazilian pattern was characterized by higher consumption of rice, poultry, and beans. In the literature researched no studies on the dietary patterns of type 2 diabetic patients. However, in a study of black
and Hispanic American diabetics, the ‘Caribbean’
pattern was identified, which is characterized by
the consumption of rice and Rioja beans, the one closest to the Brazilian diet [18]. Similar dietary patterns were found in Brazilian adults who consume rice and beans [14] along with other foods such as meat and margarine [19], but no association with glycemic levels was investigated.
The consumption of pasta and sweets, as found in the energy-dense dietary pattern (industrialized beverages, sweets, pastas, biscuits, and cakes), was also observed in the study of
sweet” pattern that also included other foods
such as bread, pizza, and fried chicken. In
another study with Australian individuals with and without diabetes, a pattern called “sweet” dietary pattern (consumption of cake, biscuits, chocolate, ice cream, and sweets) was found [20].
In Brazil, a study with elderly people with hypertension discussed a similar denomination and diet composition that included sweets, soft drinks, and pasta, but also meat and viscera, which differ from the findings of the present study [15].
No studies with a pattern similar to the infusion and whole grain dietary pattern that included whole grains, coffee and infusions, or sweeteners in the same eating pattern were found. The presence of whole grains in eating patterns known as ‘healthy’ are usually mentioned [19,21], as well as coffee belonging to the so-called ‘traditional’ eating pattern [14,15]. These foods, particularly whole grains and sweeteners, are commonly recommended for diabetic patients, since their consumption contributes to the treatment of the disease due to the metabolic advantages of slow release of glycogen during the digestive process [22].
One study with Japanese diabetics
determined a eating pattern called ‘meat, fats
and oils, seasonings and eggs’ [23] and one
with Korean diabetics identified as ‘bread, meat
and alcohol’ pattern [21] were the ones that
most resembled the sandwich and dairy dietary pattern including the consumption of fats, meats and bread in the same factor.
The so-called healthy pattern was composed of vegetables, roots and tubers, olive oil and oilseeds, fruits, and natural juices. In the literature, patterns with this same denomination are quite frequent. The food consumption of diabetic patients in Iran [24], the United States [18], and Australia [20] was similar to the healthy pattern in the present study, as they consumed fruits and vegetables within the same factor,
as well as oilseeds and fish, which was also
classified as a ‘healthy’ dietary pattern.
In other studies with the Brazilian
population, we also found ‘healthy’ eating
patterns similar to the ones in the present study, but they included more foods in the same pattern [14,15,19].
Foods that are generally called ‘healthy’
patterns positively affect glucose metabolism, reduce insulin resistance, even in patients with type 2 diabetes, since they have been confirmed in other studies, and they are inversely associated with the incidence of type 2 diabetes [25,26].
The explanation can be given through the beneficial effects of some nutrients widely found in healthy diets called plant-rich fruits such as fiber, antioxidants, unsaturated fatty acids and micronutrients, such as magnesium, in addition to the low saturated fat content has shown a direct improvement in postprandial glycemia as well as in long-term glucose metabolism [27].
A study in an Eastern Chinese cohort with a sample of type 2 diabetic individuals or those who presented altered fasting glycemia found an association only between the so-called
pattern ‘rich in vegetables’ with diabetes and
glycemic control. Thus, those who adhered to this dietary pattern presented improved fasting glucose control and lower risk of diabetes [28].
The epidemiological study with Japanese individuals, which also found an association
between the adherence to a ‘healthy’ pattern
in the group, while the healthy pattern was the one that least explained variation.
Thus, among the patterns identified in the present study, only the traditional Brazilian pattern was related to glycemic levels, and the higher the factorial score (greater adhesion) to this pattern, the lower the glycemia values. Although this pattern does not include foods identified as protectors, such as fruits and vegetables, it does contain low-fat foods, such as white meat, and bean fibers and essential amino acids found in beans and rice.
Thus, it may be assumed that individuals who follow more traditional habits consume less industrialized foods, rich in sugars and fats, which are usually associated with greater health hazards, and consequently diabetes. The highly industrialized diet is a trend in the Brazilian population [29], but we found that diabetic patients have a greater adherence to the more traditional dietary pattern.
Although it is recommended to adhere to a diet rich in vegetables and other protective foods for diabetes, the greater adherence to the traditional Brazilian pattern may have been influenced by the socioeconomic status of the individuals, since the food does not contain an excess of carbohydrates and fats and it is less expensive when compared to the so-called healthy pattern.
It is evident, therefore, that nutritional practice does not always follow the knowledge and nutritional guidelines of diabetic patients. There is often a gap between knowledge and practice [30].
The present study has some limitations. The cross-sectional design, which does not establish cause and effect; the use of the 24-hour food recall method to investigate consumption, which may be biased memory, in addition to leading patients to underestimate or overestimate consumption; and the identification method of eating patterns used in this study due to the subjectivity inherent to the process. Thus,
it may not be concluded that the data can be generalized to a wide range of the population, even in patients with type 2 diabetes.
However, all measures to mitigate the impact of such limitations were taken, such as the detailed training of the interviewers and the detailed description, based on the literature, of the stages of analysis of the factorial components. The present study investigated the main dietary patterns in a group of type 2 diabetics in Brazil and its association with glycemic levels, which may contribute to explain the gaps in the research on the diet-diabetes relationship, a disease with a significant prevalence all around the world.
C O N C L U S I O N
Five main eating patterns were identified among the type 2 diabetics studied (traditional Brazilian, energy-dense, infusion and whole grain, sandwich and dairy, and healthy diets). The traditional Brazilian pattern was inversely correlated with the glycemic levels, indicating that it can also be used as a protection standard for diabetics.
C O N T R I B U T I O N S
EPM STUDART Main author; conception; data collection, data interpretation and review. SPM ARRUDA data analysis and interpretation; review and approval of the final version. HAC SAMPAIO Review and approval of the final version of the article. TU PASSOS Data collection. AAF CARIOCA Data analysis and interpretation.
R E F E R E N C E S
1. Oggioni C, Lara J, Wells JCK, Soroka K, Siervo M. Shifts in population dietary patterns and physical inactivity as determinants of global trends in the prevalence of diabetes: An ecological analysis. Nutr Metab Cardiovasc Dis. 2014;24(10):1105-11. 2. Schmidt MI, Duncan BB, Mill JG, Lotufo PA, Chor
Study of Adult Health (ELSA-Brasil). J Epidemiol. 2015;44:66-75.
3. International Diabetes Federation. Diabetes atlas. Brussels: IDF; 2013.
4. Sociedade Brasileira de Diabetes. Diretrizes da Sociedade Brasileira de Diabetes: 2014-2015. Rio de Janeiro: Sociedade Brasileira de Diabetes; 2015.
5. Associação Brasileira para o Estudo da Obesidade e da Síndrome Metabólica. Diretrizes Brasileira de Obesidade. São Paulo: ABESO; 2016.
6. Alhazmi A, Stojanovski E, McEvoy M, Garg ML. The association between dietary patterns and type 2 diabetes: A systematic review and meta-analysis of cohort studies. J Hum Nutr Diet. 2013;27(3):251-60.
7. Frank LK, Kroger J, Schulze MB, Bedu-Addo G, Mockenhaupt FP, Danquah I. Dietary patterns in urban Ghana and risk of type 2 diabetes. Br J Nutr. 2014;112:89-98.
8. Colles SL, Singh S, Kohli C, Mithal A. Dietary beliefs and eating patterns influence metabolic health in type 2 diabetes: A clinic-based study in urban North India. Indian J Endocr Metab. 2013;17(6):1066-72.
9. Castro MBT, Sichieri S, Brito FSB, Nascimento S, Kac G. Mixed dietary pattern is associated with a slower decline of body weight change during postpartum in a cohort of Brazilian women. Nutr Hosp. 2014;29(3):519-25.
10. Molina MCB, Benseñor IM, Cardoso LO, Velasquez-Melendez G, Drehmer M, Pereira TSS. Reprodutibilidade e validade relativa do Questionário de Frequência Alimentar do ELSA-Brasil. Cad Saúde Pública. 2013;9(2):379-89. 11. American Diabetes Association. Standards of
Medical Care in Diabetes: 2016. Diabetes Care: ADA; 2016.
12. Pinheiro ABV, Lacerda EMA, Benzecry, EH, Gomes MCS, Costa VM. Tabela para avaliação de consumo alimentar em medidas caseiras. 5a ed. São Paulo: Atheneu; 2005.
13. Newby PK, Tucker KL. Empirically derived eating patterns using factor or cluster analysis: A review. Nutr Rev. 2004;62(5):177-203.
14. Matos SMA, Barreto ML, Rodrigues LC, Oliveira VA, Oliveira LPM, D’Innocenzo S, et al. Padrões alimentares de crianças menores de cinco anos de idade residentes na capital e em municípios da Bahia, Brasil, 1996 e 1999/2000. Cad Saúde Pública. 2014;30:44-54.
15. Santos RO, Fisberg RM, Marchioni DM, Baltar VT. Dietary patterns for meals of Brazilian adults. Br J Nutr. 2015;114(5):822-8.
16. Adriano LS, Sampaio HAC, Arruda SPM, Portela CLM, Melo MLP, Carioca AAF, et al. Healthy dietary pattern is inversely associated with non-alcoholic fatty liver disease in elderly. Br J Nutr. 2016;115(12):2189-95.
17. Hearty AP, Gibney MJ. Comparison of cluster and principal component analysis techniques to derive dietary patterns in Irish adults. Br J Nutr. 2008;101(4):598-608.
18. Davis NJ, Schechter CB, Wylie-Rosett J, Walker EA, Ortega F, Rosen R, et al. Dietary patterns in blacks and Hispanics with diagnosed diabetes in New York City’s South Bronx. Am J Clin Nutr. 2013;97(4):878-85.
19. Arruda SPM, Silva AAM, Kac G, Goldani MZ, Bettiol H, Barbieri MA. Socioeconomic and demographic factors are associated with dietary patterns in a cohort of young Brazilian adults. BMC Public Health. 2014; 14:654-67.
20. Dipnall JF, Pasco JA, Meyer D, Berk M, Williams LJ, Dodd S, et al. The association between dietary patterns, diabetes and depression. J Affect Disord. 2015;174:215-24.
21. Lim JH, Lee YS, Chang HC, Moon MK, Song Y. Association between dietary patterns and blood lipid profiles in Korean adults with type 2 diabetes. J Korean Med Sci. 2011;26(9):1201-8.
22. Mello VD, Laaksonen DE. Fibras na dieta: tendências atuais e benefícios à saúde na síndrome metabólica e no diabetes Mellitus tipo 2. Arq Bras Endocrinol Metabol. 2009;53(5):509-18.
23. Osonoi Y, Mita T, Osonoi T, Saito M, Tamasawa A, Nakayama S, et al. Relationship between dietary patterns and risk factors for cardiovascular disease in patients with type 2 diabetes Mellitus: A cross-sectional study. Nutr J. 2016;15(15):15-11. 24. Noorshahi N, Sotoudeh G, Djalali M, Eshraghian
MR, Karimi Z, Mirzaei K, et al. Healthy and unhealthy dietary patterns are related to lipid parameters in patients with type 2 diabetes Mellitus. J Nutr Health Sci. 2016;3:1-9.
25. Odegaard AO, Koh WP, Butler LM, Duval S, Gross MD, Yu MC, et al. Dietary patterns and incident type 2 diabetes in chinese men and women: The Singapore Chinese Health Study. Diabetes Care. 2011;34(4):880-5.
26. Morimoto A, Ohno Y, Tatsumi Y, Mizuno S, Watanabe S. Effects of healthy dietary pattern and other lifestyle factors on incidence of diabetes in a rural Japanese population. Asia Pac J Clin Nutr. 2012;21(4):601-8.
patterns and incidence of type 2 diabetes in US men and women: Results from three prospective cohort studies. PLoS Med. 2016;13(6):1-18. 28. Shi Z, Zhen S, Zimmet PZZ, Zhou Y, Zhou Y,
Magliano DJ, et al. Association of impaired fasting glucose, diabetes and dietary patterns with mortality: A 10-year follow-up cohort in Eastern China. Acta Diabetol. 2016;53(5):799-806. 29. Instituto Brasileiro de Geografia e Estatística.
Pes-quisa de Orçamentos Familiares (POF 2008-2009):
análise do consumo alimentar pessoal no Brasil. Rio de Janeiro: IBGE; 2011.
30. Zad ND, Yusof RM, Mohseni F, Jamaluddin R, Esmaili H. Socio-demographic and lifestyle factors associated with dietary patterns among adults with type 2 diabetes Mellitus in Tehran, Iran. Int J Diabetes Dev Ctries. 2015;35(4):540-5.