Factors associated with dietary
patterns in adolescents: A
school-based study in Cuiabá,
Mato Grosso
Fatores associados a padrões
alimentares em adolescentes: um
estudo de base escolar em Cuiabá,
Mato Grosso
Paulo Rogério Melo Rodrigues
IRosangela Alves Pereira
IIDiana Barbosa Cunha
IIIRosely Sichieri
IIIMárcia Gonçalves Ferreira
IAna Amélia Freitas Vilela
IRegina Maria Veras Gonçalves-Silva
II Faculdade de Nutrição da Universidade Federal de Mato Grosso, MT. II Instituto de Nutrição Josué de Castro da Universidade Federal do Rio de Janeiro, RJ.
III Instituto de Medicina Social da Universidade do Estado do Rio de Janeiro, RJ.
Correspondência: Regina Maria Veras Gonçalves da Silva. Rua 27, nº 207 Bairro Boa Esperança, CEP 78068-595 Cuiabá, MT. E-mail: [email protected]
Abstract
Objective: To identify dietary patterns among adolescents and to assess their association with socioeconomic and life-style characteristics and nutritional sta-tus. Methods: A probabilistic clustered two-stage sample of students between 14 and 19 years old from public and private high schools from Cuiabá, Mato Grosso, Brazil, was investigated (n = 1.139). A self-administered food frequency questionnaire was used to obtain information on food intake. Nutritional status was classified according to the Body Mass Index (BMI = weight/height2) z-score. Socioeconomic
status was inferred by the education level of head of household and by the presence of electrical appliances in the household. Dietary patterns were identified by apply-ing exploratory factor analysis (extraction method: principal component analysis) and their relationship with socioeconomic con-ditions, lifestyle variables, and nutritional status was estimated by mutually adjusted multilinear regression models. Results: “Western”, “traditional” and “mixed” dietary patterns were identified. Studying in the morning hours and reporting the intake of alcoholic beverages were associated with greater adherence to the “Western” pattern. Male low-income students from public schools who have a BMI in the normal range preferred the “traditional” pattern. The “mixed” pattern was adopted by boys from public schools reporting physical activity. Conclusion: Several factors were associated with dietary patterns of adolescents and the Brazilian traditional diet was associated with normal weight.
Resumo
Objetivo: Identificar padrões alimentares de adolescentes e sua associação com carac-terísticas socioeconômicas, estilo de vida e estado nutricional. Métodos: Investigou-se amostra probabilística de estudantes entre 14 a 19 anos de idade do ensino médio público e privado de Cuiabá/Mato Grosso (n = 1.139). Os dados foram coletados em sala de aula utilizando-se questionário autoaplicado. Para a obtenção de dados de consumo alimentar, aplicou-se question-ário de frequência alimentar semiquanti-tativo. O estado nutricional foi classificado pelo escore z do Índice de Massa Corporal (IMC = peso/estatura2). Para a classificação
socioeconômica considerou-se a esco-laridade do chefe da família e a presença de bens e equipamentos no domicílio. Os padrões alimentares foram identificados por meio da análise fatorial exploratória (método de extração: análise de compo-nentes principais) e sua associação com as características socioeconômicas, estilo de vida e estado nutricional foi estimada por modelos de regressão linear múltipla mutuamente ajustados para os outros pa-drões. Resultados: Foram identificados três padrões alimentares: “ocidental”, “tradicio-nal” e “misto”. Estudar no turno vespertino e consumir bebidas alcoólicas foram associa-dos (p < 0,05) a maior aderência ao padrão “ocidental”. Meninos de escolas públicas, com menor poder aquisitivo e IMC na faixa de normalidade aderiam ao padrão “tradi-cional”. O padrão “misto” foi adotado pelos meninos, estudantes de escolas públicas e que relataram prática de atividade física. Conclusão: Em adolescentes, vários fatores se associam aos padrões alimentares, mas destacamos que o consumo dos alimentos tradicionais da dieta brasileira associou-se ao IMC na faixa de normalidade.
Palavras-chaves:Padrões alimentares. Análise fatorial. Nível socioeconômi-co. Estilo de vida. Estado nutricional. Adolescentes.
Introduction
The traditional approach to food intake assessment for investigating the isolated effect of nutrients or foods prevents a good understanding of the relationship between dietary intake and health outcomes.1 People
usually do not eat isolated foods or nutri-ents2 but combinations of several foods,
nutrients and other components that can interact with each other,3 making human
diet a complex and dynamic exposure factor.4
Dietary patterns has been a focus of studies that aimed to explore the complex relationship between diet and health out-comes.5,6 This alternative approach helps
overcome the limitations in the analysis of diet-disease3 as it seeks to examine food
intake globally.6-8
Cutler et al.9 have suggested that dietary
pattern analysis can provide results that are more relevant to public health actions, especially in the formulation of dietary recommendations and guidelines.
Dietary patterns among adolescents have been assessed in several coun-tries.4-6,8,9,16-18 In Brazil dietary patterns have
been identified in adults 10-15 but there are
few studies approaching adolescents dietary patterns.
The current study aimed to identify di-etary patterns among adolescents of Cuiabá, Mato Grosso, Brazil and to assess their as-sociation with socioeconomic and lifestyle characteristics and nutritional status.
Methods
To estimate the sample size, we used a 95% confidence level, sampling error of 3% and an expected eating disorders prevalence of 0.50, totaling 1.067 adolescents. There was an addition of 20% to the sample size given the likelihood of losses and/or refus-als, totaling 1.280 adolescents.
A two-stage cluster sampling design was applied. In the first stage every one of the 62 high schools of Cuiabá was considered a cluster to guarantee the representative-ness of each type of school. Based on the total number of adolescents attending each school, 10 schools were selected: seven state public schools, one federal public school and two private schools. In the second stage, the classes were randomly drawn up until to complete a minimum of 128 students per school. Pregnant or breast-feeding adolescents and those with any physical or mental condition that could prevent them from completing data collection were not eligible for the study.
An informed consent form was signed by all adolescents over 18 or parents / legal guardians of those under 18. Permission for data collection was also obtained from all school principals. The study was approved by the Research Ethics Committee from Júlio Muller University Hospital, Federal University of Mato Grosso (protocol no. 459/ CEP-HUJM/07).
The study was conducted by a trained team of nutritionists. The students in the classroom were given a self-administered questionnaire comprising standard ques-tions about demographic, socioeco-nomic and lifestyle characteristics and a semi-quantitative Food Frequency Questionnaire (FFQ). The questionnaire was previously tested in a similar group of adolescents from a school not included in this study in order to evaluate whether the questions were easily understood, correct possible mistakes and standardize the instrument for data collection. To reduce the non-response rate, all schools were visited at least three times in an attempt to meet students who have been absent in previous visits.
Self-reported weight and height in ado-lescents have been validated by Brener et al.19 and Farias-Júnior20 for epidemiological
studies. Brener et al.19 found correlations
coefficients of 0.90 and 0.93 between self-reported and measured weight and height, respectively, and an intraclass correlation coefficients over 0.90 for female and male adolescents (between 15 to 18 years old).20
Body Mass Index (BMI = kg/m2) was
es-timated to classify the nutritional status of adolescents according to the World Health Organization (WHO) recommendations.21
Adolescents with BMI/age ≤ +1 z-score were classified as normal weight; those with BMI/age > +1 z-score were classified as excess body weight including overweight and obesity.
Information on type, frequency and duration of physical activity practiced in a typical week was gathered. The time (in minutes) of each physical activity was mul-tiplied by the weekly frequency and total activity time was then assessed by adding up time spent on each activity. Adolescents were classified according to the level of physical activity as proposed by Currie et al.22 in: (a) sedentary (lack of physical
activity); (b) insufficiently active (up to 299 minutes of physical activity per week); and (c) active (≥300 minutes of physical activity per week).
Information on alcoholic beverages in-take (beer, wine and/or spirits) was obtained from the FFQ for the six months preceding the study. Adolescents were classified as alcoholic beverage reporters (regardless of the amount, frequency and type) and non-reporters. Smoking was assessed according to WHO criteria,23 and smokers were those
who reported having smoked at least one day in the last 30 days.
The families’ socioeconomic level was categorized according to the Brazilian Marketing Research Association (Associação Brasileira de Empresas de Pesquisa, ABEP) criteria.24 These criteria include the number
scores, from grade A (highest) to E (lowest). Food consumption was assessed using a modified version of the FFQ that was de-veloped and validated for adults in Cuiabá.25
The modifications were based on a FFQ developed and validated for adolescents in the city of Rio de Janeiro26 to include food
items commonly consumed by adolescents. The original FFQ consisted of 81 food items, eight were excluded and three were included (cereal-based foods and breakfast cereals, omelet, and wine). The final FFQ used in this study included 76 food items. The FFQ provides eight response options (from more than 3 times a day to never or almost never) for reporting frequency of consumption and up to three choices of servings for 72 food items. The options of frequency consump-tion were defined based on a FFQ developed for adults27 and adolescents,26 both in Rio de
Janeiro. Only the frequency of consumption was recorded for garlic, onions, peppers and guarana powder.
Identification of dietary patterns
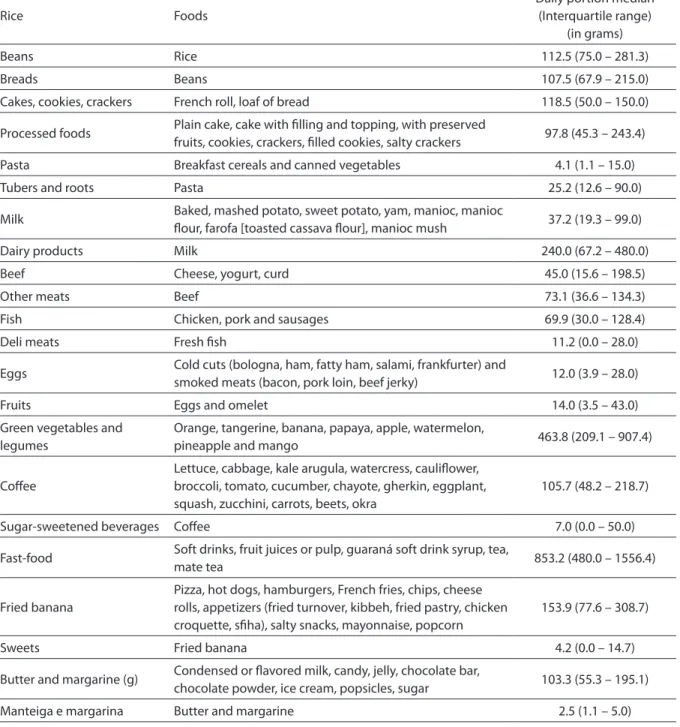
Food items listed in the FFQ were grouped into 22 food groups (Table 1) ac-cording to their nutritional characteristics and frequency of consumption. The four items for which the amount consumed was not reported were not included in this analysis. Some food items were analyzed separately because they were either rep-resentative of some dietary patterns (e.g., milk and coffee) or were regional traditional foods (rice, beans, bread, fish and fried banana).
Dietary patterns were identified based on the frequency of consumption of each of the 22 food groups using exploratory factor analysis. First, the Bartlett Test of Sphericity (BTS) and the Kaiser-Meyer-Olkin Measure of Sampling Adequacy (KMO) were used to assess data adequacy for factor analysis. The factor analysis model was appropriate as KMO was greater than 0.6 and the BTS showed a p< 0.05.2 A correlation matrix was
then constructed.
For extraction of factors a principal
component analysis with orthogonal (Varimax method) rotation (orthogonal transformation of factors) was used for creating independence between factors and thus enhancement of data interpretability.2
The Cattell’s scree plot was used to deter-mine the number of factors to be extracted. It is derived by plotting the eigenvalues against the number of factors in their order of extraction. Any values to the left of the inflection point were retained.28 The first
model was test without setting the number of factors (patterns); the number of retain-able factors was determined by the Cattel’s Scree Plot method. Then, a second a second model was tested setting the number of patterns to be retained according to that indicated in the plot.
Food groups with factor loadings greater than 0.30 and communality over 0.20 were retained in the patterns identified. The in-ternal consistency of extracted factors was assessed using Cronbach alpha index, and values above 0.60 were considered accept-able.29 Dietary patterns were named based
on interpretability and characteristics of the items retained in each pattern.
Data analysis
Continuous variables were tested using the Kolgomorov-Smirnov to assess sym-metry of distributions. In the univariate analysis, the chi-square test was used as-sess the association between independent variables and dietary patterns. The factor scores of each pattern were categorized into quartiles, and the intermediate quartiles were combined to facilitate the interpreta-tion of associainterpreta-tions.
Results
Of all adolescents eligible to partici-pate in the study (n=1.344), a total of 1.296 (96.4%) were examined. Eighty-seven
students with missing information on de-mographic characteristics, date of birth or socioeconomic classification as well as 70 who reported an implausible energy intake (above or below 2 standard deviations [SD]
Table 1 – Food groups from the Food Frequency Questionnaire (FFQ) used in factor analysis. with respective medians and interquartile range of servings consumed (g or mL) by adolescents (n=1.139) from Cuiabá. Mato Grosso. 2008.
Tabela 1 – Agrupamentos dos alimentos do Questionário de Frequência Alimentar (QFA) utilizados na análise fatorial. com
respectivas medianas e intervalos interquartílicos das porções diárias consumidas (g ou mL) por adolescentes (n = 1.139) de Cuiabá. Mato Grosso. 2008.
Rice Foods
Daily portion median (Interquartile range)
(in grams)
Beans Rice 112.5 (75.0 – 281.3)
Breads Beans 107.5 (67.9 – 215.0)
Cakes, cookies, crackers French roll, loaf of bread 118.5 (50.0 – 150.0)
Processed foods Plain cake, cake with illing and topping, with preserved
fruits, cookies, crackers, illed cookies, salty crackers 97.8 (45.3 – 243.4)
Pasta Breakfast cereals and canned vegetables 4.1 (1.1 – 15.0)
Tubers and roots Pasta 25.2 (12.6 – 90.0)
Milk Baked, mashed potato, sweet potato, yam, manioc, manioc
lour, farofa [toasted cassava lour], manioc mush 37.2 (19.3 – 99.0)
Dairy products Milk 240.0 (67.2 – 480.0)
Beef Cheese, yogurt, curd 45.0 (15.6 – 198.5)
Other meats Beef 73.1 (36.6 – 134.3)
Fish Chicken, pork and sausages 69.9 (30.0 – 128.4)
Deli meats Fresh ish 11.2 (0.0 – 28.0)
Eggs Cold cuts (bologna, ham, fatty ham, salami, frankfurter) and
smoked meats (bacon, pork loin, beef jerky) 12.0 (3.9 – 28.0)
Fruits Eggs and omelet 14.0 (3.5 – 43.0)
Green vegetables and legumes
Orange, tangerine, banana, papaya, apple, watermelon,
pineapple and mango 463.8 (209.1 – 907.4)
Cofee
Lettuce, cabbage, kale arugula, watercress, caulilower, broccoli, tomato, cucumber, chayote, gherkin, eggplant, squash, zucchini, carrots, beets, okra
105.7 (48.2 – 218.7)
Sugar-sweetened beverages Cofee 7.0 (0.0 – 50.0)
Fast-food Soft drinks, fruit juices or pulp, guaraná soft drink syrup, tea,
mate tea 853.2 (480.0 – 1556.4)
Fried banana
Pizza, hot dogs, hamburgers, French fries, chips, cheese rolls, appetizers (fried turnover, kibbeh, fried pastry, chicken croquette, siha), salty snacks, mayonnaise, popcorn
153.9 (77.6 – 308.7)
Sweets Fried banana 4.2 (0.0 – 14.7)
Butter and margarine (g) Condensed or lavored milk, candy, jelly, chocolate bar,
chocolate powder, ice cream, popsicles, sugar 103.3 (55.3 – 195.1)
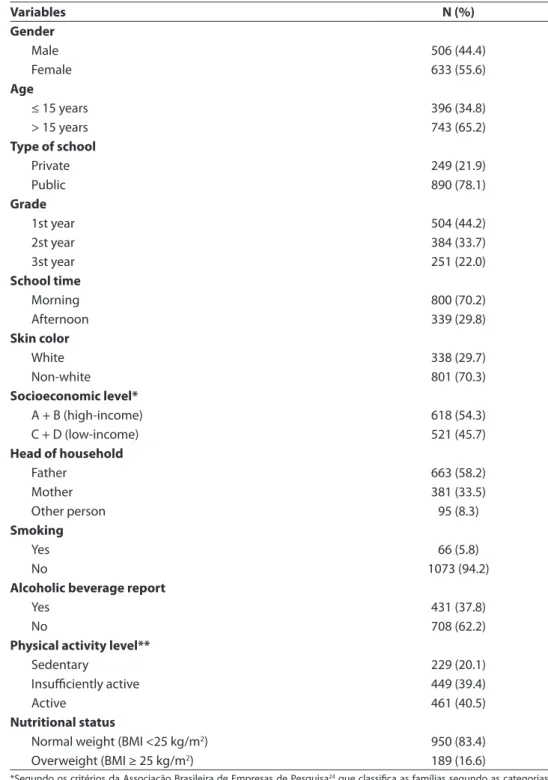
of the mean energy intake) were not in-cluded in the analysis. Thus, the final sample comprised 1.139 adolescents (84.7% of all eligible). Table 2 shows the characteristics of the sample studied. Nearly 78% were public school students, 46% belonged to lower social classes (C and D), the mother was head of household in 34%, and 17% were overweight.
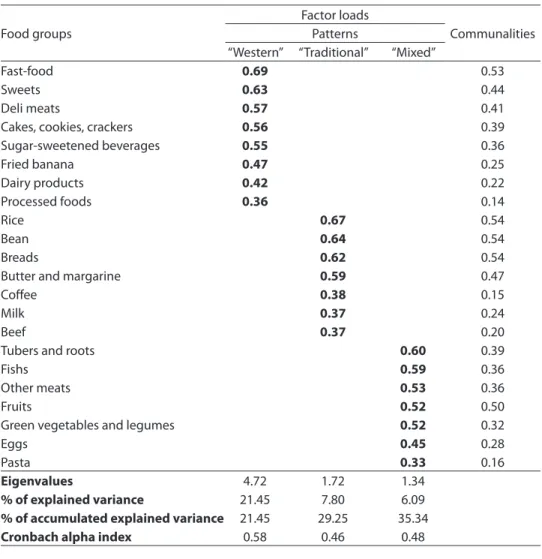
The KMO (0.86) and BTS tests (p<0.01) showed that the data was adequate for factor analysis. The Cattell’s scree plot indicated the retention of three factors (patterns). The three identified patterns were named as “Western”, “traditional”, and “mixed”; together they explained 35.3% of the dietary intake variance (Table 3). The “Western” pat-tern explained 21.5% of the model variance and was characterized by high intakes of cakes and cookies, processed foods, dairy products, deli meats, sugar-sweetened bev-erages, fast foods, fried banana and sweets; the “traditional” pattern explained 7.8% of the model variance and was characterized by high intakes of rice, beans, bread, milk, beef, coffee, butter and margarine; finally, the “mixed” pattern was characterized by the consumption of pasta, tubers and roots, other meats, fish, eggs, fruits and green veg-etables and legumes and explained 6.1% of the model variance.
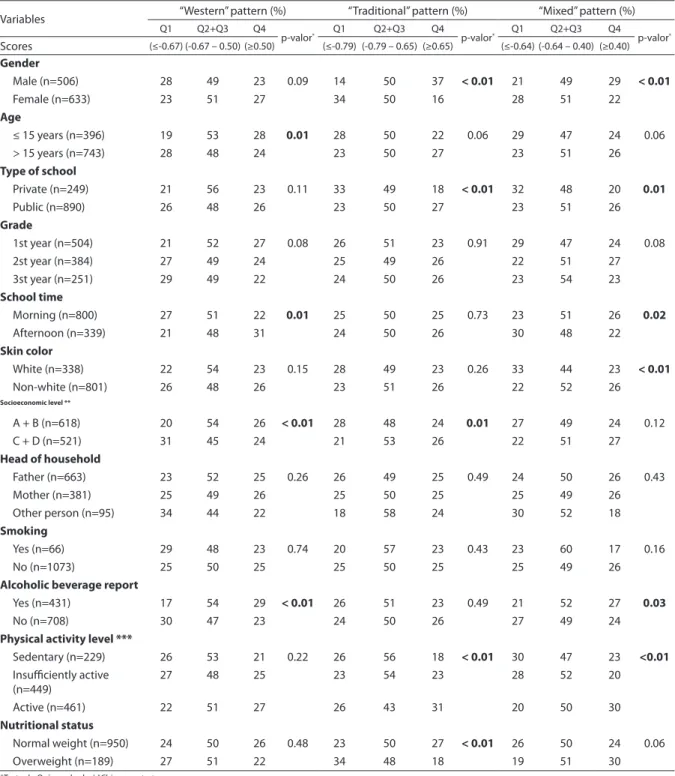
All food groups had positive saturation in at least one of the three dietary patterns retained and only three groups had commu-nalities below 0.20 (processed foods, pasta and coffee). However, it was decided that these items should remain in the model as they were representative of the local culture and allowed to differentiate the dietary pat-terns identified. The internal consistency values of the factors (Cronbach’s alpha in-dex) were acceptable (close to 0.6) (Table 3). Table 4 presents the factors associ-ated with the quartiles of factor scores of “Western,” “traditional,” and “mixed” dietary patterns in the univariate analysis. The “Western” pattern was associated to adolescents under 15 years-old, going to the school in the afternoon shift, being from higher socioeconomic category, and
reporting the intake of alcoholic beverages. The “traditional” pattern was chosen by males, from public schools, low socioeco-nomic level, physically actives, and with normal weight. The “mixed” pattern was associated to males, from public schools, going to the school in the morning shift, non whites, reporting alcoholic beverages intake, which were physically actives.
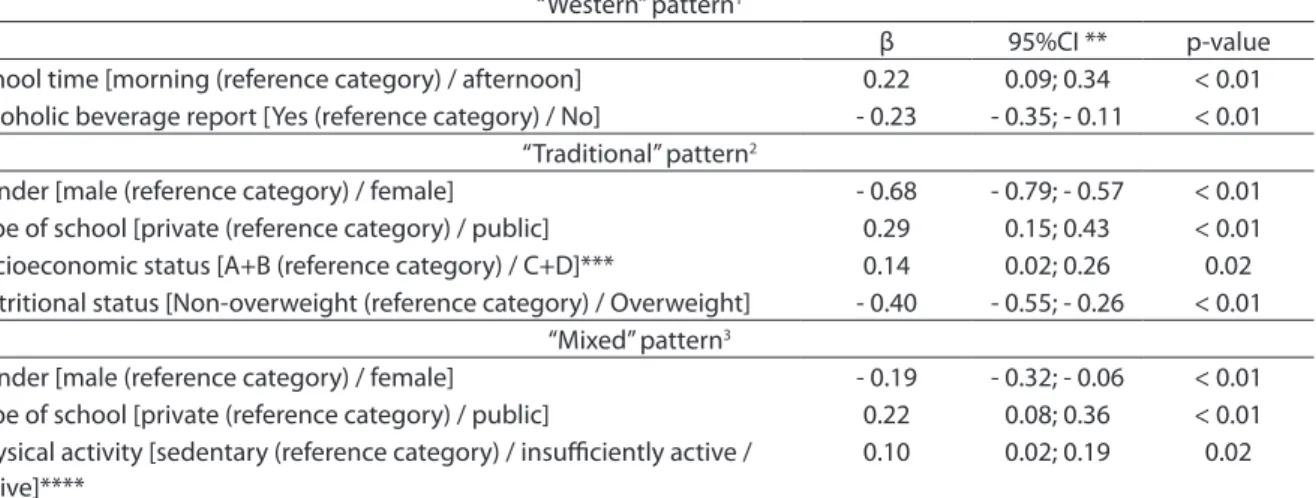
In the multiple linear regression analy-sis, the “Western” pattern was associated to the afternoon school shift and to the report of alcoholic beverages intake. Male low-income students from public school whit normal weight showed greater adherence to the “traditional” dietary pattern. Also the “mixed” pattern was associated with physically active male adolescents from public schools. Increasing levels of physi-cal activity, from sedentary to insufficiently active and then to active, was associated with a 10% increase in the “mixed” pattern scores (Table 5).
Discussion
The principal component analysis iden-tified three dietary patterns among adoles-cents living in the city of Cuiabá, namely: “Western,” “traditional,” and “mixed.” The “Western” pattern, characterized by high consumption of energy-dense foods such as fast foods, sweets and sugar-sweetened bev-erages, was associated with the afternoon school shift and to the report of alcoholic beverages intake. The “traditional pattern,” mainly consisting of typical Brazilian foods including rice and beans, had greater adher-ence among normal weight adolescents. In contrast, the “mixed” dietary pattern, char-acterized by high intake of roots and tubers, meat, and fish, was positively associated with the increase in physical activity.
Table 2 -Distribution of adolescents according to socio-economic, demographic, and lifestyle variables and nutritional status, Cuiabá, Mato Grosso, 2008 (n = 1,139).
Tabela 2 – Distribuição dos adolescentes segundo as variáveis socioeconômicas e demográicas,
estilo de vida e estado nutricional, Cuiabá, Mato Grosso, 2008 (n = 1.139).
Variables N (%)
Gender
Male 506 (44.4)
Female 633 (55.6)
Age
≤ 15 years 396 (34.8)
> 15 years 743 (65.2)
Type of school
Private 249 (21.9)
Public 890 (78.1)
Grade
1st year 504 (44.2)
2st year 384 (33.7)
3st year 251 (22.0)
School time
Morning 800 (70.2)
Afternoon 339 (29.8)
Skin color
White 338 (29.7)
Non-white 801 (70.3)
Socioeconomic level*
A + B (high-income) 618 (54.3)
C + D (low-income) 521 (45.7)
Head of household
Father 663 (58.2)
Mother 381 (33.5)
Other person 95 (8.3)
Smoking
Yes 66 (5.8)
No 1073 (94.2)
Alcoholic beverage report
Yes 431 (37.8)
No 708 (62.2)
Physical activity level**
Sedentary 229 (20.1)
Insuiciently active 449 (39.4)
Active 461 (40.5)
Nutritional status
Normal weight (BMI <25 kg/m2) 950 (83.4)
Overweight (BMI ≥ 25 kg/m2) 189 (16.6)
*Segundo os critérios da Associação Brasileira de Empresas de Pesquisa24 que classifica as famílias segundo as categorias
econômicas, A e B são os grupos com maior poder aquisitivo, C e D incluem classe média e classe média baixa.
* According to criteria of the Brazilian Association of Research Companies24 which classifies households according to economic
categories, A and B are groups with high purchasing power, C and D include the middle class and lower middle class.
**A atividade física foi avaliada combinando o tempo e a frequência com que foram realizadas tais atividades, sendo que o tempo de atividade acumulada foi quantificado somando-se o tempo gasto com essas atividades nos últimos sete dias.22
Table 3 - Rotated factorial matrix, factor loads and communalities (h2) estimated for the three dietary patterns identiied among adolescents, Cuiaba, Mato Grosso, 2008 (n = 1,139).
Tabela 3 – Matriz fatorial rotada, cargas fatoriais e comunalidades (h2) estimadas para os três
padrões alimentares identiicados em adolescentes, Cuiabá, Mato Grosso, 2008 (n = 1.139).
Food groups
Factor loads
Communalities Patterns
“Western” “Traditional” “Mixed”
Fast-food 0.69 0.53
Sweets 0.63 0.44
Deli meats 0.57 0.41
Cakes, cookies, crackers 0.56 0.39
Sugar-sweetened beverages 0.55 0.36
Fried banana 0.47 0.25
Dairy products 0.42 0.22
Processed foods 0.36 0.14
Rice 0.67 0.54
Bean 0.64 0.54
Breads 0.62 0.54
Butter and margarine 0.59 0.47
Cofee 0.38 0.15
Milk 0.37 0.24
Beef 0.37 0.20
Tubers and roots 0.60 0.39
Fishs 0.59 0.36
Other meats 0.53 0.36
Fruits 0.52 0.50
Green vegetables and legumes 0.52 0.32
Eggs 0.45 0.28
Pasta 0.33 0.16
Eigenvalues 4.72 1.72 1.34
% of explained variance 21.45 7.80 6.09
% of accumulated explained variance 21.45 29.25 35.34
Cronbach alpha index 0.58 0.46 0.48
associated with sedentarism6,increased risk
of metabolic disorders,8,18 increased weight
gain8,18 in both male and female
adoles-cents, as well as high waist circumference among female18 and smoking among male
adolescents.6
The association of the “Western” pat-tern with the afpat-ternoon school shift may be reflecting the influence of social and cultural factors on eating habits. Possibly, adolescents attending the school in the afternoon are likely to have more opportuni-ties to have out-of-home eating, favoring the choice of the convenience foods included in the “Western” pattern. This assumption is supported by Bezerra and Sichieri30 who
found that in Brazil out-of-home eating is strongly associated with the consumption of soft drinks, fried snacks, and sweets (POF 2002-2003).
The current study found that normal weight adolescents had greater adherence to the “traditional” dietary pattern. These results are consistent with other studies on dietary patterns among Brazilian adults that also observed a protective effect on body weight related to the “traditional” pattern.10,14 Since this dietary pattern was
Table 4 – Distribution (%) of adolescents according to the scores of dietary patterns classiied in quartiles and to socio-demographic and lifestyle characteristics, and nutritional status, Cuiabá, Mato Grosso, 2008 (n = 1,139).
Tabela 4 – Distribuição (%) dos adolescentes segundo os escores dos padrões de consumo alimentar categorizados em quartis
e as características sociodemográicas, de estilo de vida e estado nutricional, Cuiabá, Mato Grosso, 2008 (n = 1.139).
Variables “Western” pattern (%) “Traditional” pattern (%) “Mixed” pattern (%)
Q1 Q2+Q3 Q4
p-valor* Q1 Q2+Q3 Q4 p-valor* Q1 Q2+Q3 Q4 p-valor*
Scores (≤-0.67) (-0.67 – 0.50) (≥0.50) (≤-0.79) (-0.79 – 0.65) (≥0.65) (≤-0.64) (-0.64 – 0.40) (≥0.40) Gender
Male (n=506) 28 49 23 0.09 14 50 37 < 0.01 21 49 29 < 0.01
Female (n=633) 23 51 27 34 50 16 28 51 22
Age
≤ 15 years (n=396) 19 53 28 0.01 28 50 22 0.06 29 47 24 0.06
> 15 years (n=743) 28 48 24 23 50 27 23 51 26
Type of school
Private (n=249) 21 56 23 0.11 33 49 18 < 0.01 32 48 20 0.01
Public (n=890) 26 48 26 23 50 27 23 51 26
Grade
1st year (n=504) 21 52 27 0.08 26 51 23 0.91 29 47 24 0.08
2st year (n=384) 27 49 24 25 49 26 22 51 27
3st year (n=251) 29 49 22 24 50 26 23 54 23
School time
Morning (n=800) 27 51 22 0.01 25 50 25 0.73 23 51 26 0.02
Afternoon (n=339) 21 48 31 24 50 26 30 48 22
Skin color
White (n=338) 22 54 23 0.15 28 49 23 0.26 33 44 23 < 0.01
Non-white (n=801) 26 48 26 23 51 26 22 52 26
Socioeconomic level **
A + B (n=618) 20 54 26 < 0.01 28 48 24 0.01 27 49 24 0.12
C + D (n=521) 31 45 24 21 53 26 22 51 27
Head of household
Father (n=663) 23 52 25 0.26 26 49 25 0.49 24 50 26 0.43
Mother (n=381) 25 49 26 25 50 25 25 49 26
Other person (n=95) 34 44 22 18 58 24 30 52 18
Smoking
Yes (n=66) 29 48 23 0.74 20 57 23 0.43 23 60 17 0.16
No (n=1073) 25 50 25 25 50 25 25 49 26
Alcoholic beverage report
Yes (n=431) 17 54 29 < 0.01 26 51 23 0.49 21 52 27 0.03
No (n=708) 30 47 23 24 50 26 27 49 24
Physical activity level ***
Sedentary (n=229) 26 53 21 0.22 26 56 18 < 0.01 30 47 23 <0.01
Insuiciently active (n=449)
27 48 25 23 54 23 28 52 20
Active (n=461) 22 51 27 26 43 31 20 50 30
Nutritional status
Normal weight (n=950) 24 50 26 0.48 23 50 27 < 0.01 26 50 24 0.06
Overweight (n=189) 27 51 22 34 48 18 19 51 30
*Teste do Qui-quadrado / *Chi-square test.
**Segundo os critérios da Associação Brasileira de Empresas de Pesquisa24 que classifica as famílias segundo as categorias econômicas, A e B são os grupos com maior poder aquisitivo,
C e D incluem classe média e classe média baixa.
**According to the criteria of the Brazilian Association of Opinion Poll Companies24 which classifies households according to economic categories, A and B are groups with high purchasing power, C and D include the middle class and lower middle class.
***A atividade física foi avaliada combinando o tempo e a freqüência com que foram realizadas tais atividades, sendo que o tempo de atividade acumulada foi quantificado somando--se o tempo gasto com essas atividades nos últimos sete dias.22
high-energy density foods. This pattern in-cluded cheaper foods contrasting with the “Western” pattern that included more ex-pensive processed foods. Although this pat-tern also included butter and margarine and beef, these foods had smaller factor loadings (0.59 and 0.37, respectively) compared to rice and beans (0.67 and 0.64, respectively). Story et al.31 have claimed that differences
in food consumption between social classes can be explained by several interacting fac-tors, for example, the availability and access to a larger variety of foods 4.
Our study also found that the dietary pattern including healthy foods, such as fruits, vegetables and fish, also included pork, sausage and pasta; therefore, it was
named as a “mixed” pattern. Nevertheless, the association between the “mixed” dietary pattern and increased levels of physical ac-tivity may be reflecting healthy food choices. While no other studies have identified a “mixed” dietary pattern among adolescents, other studies with adults have also identi-fied dietary patterns similar to the “mixed” pattern described in this study, which were commonly characterized by high consump-tion of cereals, meat, eggs, fruit, fish, caf-feinated beverages and vegetables.10,14,32,33
They also found an inverse association of the “mixed” pattern with the body mass index (BMI),32,33 blood pressure, and waist
and abdominal circumference.33
The current study was limited by the
Table 5 - Multiple linear regression models for factors associated with dietary patterns scores in adolescents, Cuiabá, Mato Grosso, 2008 (n = 1,139).
Tabela 5 – Modelos de regressão linear múltipla* para fatores associados aos escores dos padrões alimentares de
adolescentes, Cuiabá, Mato Grosso, 2008 (n = 1.139).
“Western” pattern1
β 95%CI ** p-value
School time [morning (reference category) / afternoon] 0.22 0.09; 0.34 < 0.01 Alcoholic beverage report [Yes (reference category) / No] - 0.23 - 0.35; - 0.11 < 0.01
“Traditional” pattern2
Gender [male (reference category) / female] - 0.68 - 0.79; - 0.57 < 0.01
Type of school [private (reference category) / public] 0.29 0.15; 0.43 < 0.01
Socioeconomic status [A+B (reference category) / C+D]*** 0.14 0.02; 0.26 0.02
Nutritional status [Non-overweight (reference category) / Overweight] - 0.40 - 0.55; - 0.26 < 0.01 “Mixed” pattern3
Gender [male (reference category) / female] - 0.19 - 0.32; - 0.06 < 0.01
Type of school [private (reference category) / public] 0.22 0.08; 0.36 < 0.01 Physical activity [sedentary (reference category) / insuiciently active /
active]****
0.10 0.02; 0.19 0.02
*Os modelos multilineares foram desenvolvidos como: escore do padrão alimentar (variável contínua) = intercepto + (coeficiente) * variáveis explanatórias.
*The multilinear models were developed as: dietary pattern scores (continuous variables) = intercept + (coefficients)* explanatory variables.
**Intervalo de Confiança de 95% / **95% Confidence Interval.
***Segundo os critérios da Associação Brasileira de Empresas de Pesquisa24, que classifica as famílias segundo as categorias econômicas, A e B são os grupos
com maior poder aquisitivo; C e D incluem classe média e classe média baixa.
***According to the criteria of the Brazilian Association of Opinion Poll Companies24 which classifies the families according to economic categories, A and B are
groups with high purchasing power; C and D include the middle class and lower middle class.
****A atividade física foi avaliada combinando o tempo e a frequência em que foram realizadas tais atividades, sendo que o tempo de atividade acumulada foi quantificado somando-se o tempo gasto com essas atividades nos últimos sete dias.22
****Physical activity was assessed by combining the time and frequency of exercising practices, and the accrued physical activity time was calculated by summing the time spent on these activities in the past seven days.22
1Ajustado por sexo, idade, tipo de escola, série, turno, cor da pele, categoria socioeconômica, consumo de bebidas alcoólicas, padrão misto e padrão
tradi-cional.
1Adjusted by sex, age, type of school, grade, shift, ethnicity, social class, alcohol consumption, mixed pattern and traditional pattern.
2Ajustado por sexo, idade, tipo de escola, categoria socioeconômica, atividade física, estado nutricional, padrão ocidental e padrão misto.
2Adjusted by sex, age, type of school, social class, physical activity, nutritional status, western pattern and mixed pattern.
3Ajustado por sexo, idade, tipo de escola, série, turno, cor da pele, categoria socioeconômica, tabagismo, consumo de bebidas alcoólicas, atividade física,
estado nutricional, padrão ocidental e padrão tradicional.
3Adjusted by sex, age, type of school, grade, shift, ethnicity, social class, smoking, alcohol consumption, physical activity, n utritional status, western pattern and
use of a cross-sectional design, the use of self-reported weight and height, and by the constraints observed in the methods used for food intake assessment and in the analysis of dietary data.
The purpose of a cross-sectional design study is to examine associations between variables, but it does not allow to making inferences on causal relationships. Thus, the apparent protective effect against excess weight of the “traditional” pattern needs to be further explored in longitudinal studies. The use of self-reported weight and height has been validated in adolescents, includ-ing in Brazil20. This alternative can be used
to estimate BMI in epidemiological stud-ies when these measures cannot be easily taken34. However, some differences between
self-reported and measured weights and heights still can be observed34.
The FFQ is a largely used method de-signed to estimate usual food intake, but it has some limitations, including the fact that its understanding and interpretability. In addition, individual food preferences and availability can affect the retrospec-tive report of food consumption.35 On the
other hand, the FFQ is a useful tool in epi-demiological studies, as it is a low-cost field method and allows an easy data analysis process; moreover, it is not subject to the within-subject variability.
Factor analysis have been the most widely used technique to identify dietary patterns.36 However, its application requires
making arbitrary decisions, though based on scientific knowledge on nutrition and
diet, such as grouping food items, deter-mining retention patterns, and interpreting results. Thus, the comparison of dietary patterns of different populations is limited because the patterns identified are specific to the population studied.
Final considerations
The three dietary patterns identified in adolescents of the city of Cuiabá were internally consistent and comparable to those identified in similar studies con-ducted in Brazil. This study showed that the “Western” pattern, characterized by high intake of energy-dense foods, fats, sugars and sodium, explained in most the variation in food consumption among adolescents. These findings point out to the need for healthy life style promotion actions targeted to Brazilian adolescents, including healthy eating, since these foods are associated with adverse outcomes such as metabolic disorders, hypertension, diabetes and car-diovascular disease.
The main finding of this study was the protective effect against excess weight of the “traditional” dietary pattern characterized mainly by high intake of a combination of rice and beans, which are typical Brazilian staple foods. This same effect was previ-ously seen in adults, and it stresses the im-portance of actions aimed at encouraging Brazilians to maintain traditional healthy eating habits, which has been being re-placed by globalized dietary habits, espe-cially among adolescents.
Referências
1. Nicklas TA, Baranowski T, Cullen KW, Berenson G. Eating patterns, dietary quality and obesity. J Am Coll Nutr
2001; 20(6): 599-608.
2. Olinto MTA, Padrões alimentares: análise de
componentes principais. In: Kac G, Sichieri R, Gigante DP (Org,). Epidemiologia Nutricional. Rio de Janeiro: FIOCRUZ e ATHENEU; 2007. p. 213-25.
3. Hu FB. Dietary pattern analysis: a new direction in nutritional epidemiology. Curr Opin Lipidol 2002; 13(1): 3-9.
5. McNaughton AS, Ball K, Mishra GD, Crawford DA. Dietary patterns of adolescents and risk of obesity and hypertension. J Nutr 2008; 138(2): 364-70.
6. Kourlaba G, Panagiotakos DB, Mihas K, Alevizos A, Marayiannis K, Mariolis A et al. Dietary patterns in relation to socio-economic and lifestyle characteristics among Greek adolescents: a multivariate analysis. Public Health Nutr 2008; 12(9): 1366-72.
7. Kant AK. Dietary patterns and health outcomes. J Am Diet Assoc 2004; 104(4): 615-35.
8. Song Y, Park MJ, Paik H-Y, Joung H. Secular trends in dietary patterns and obesity-related risk factors in Korean adolescents aged 10-19 years. Int J Obes 2010; 34(1): 48-56.
9. Cutler GJ, Flood A, Hannan P, Neumark-Sztainer D. Major patterns of dietary intake in adolescents and their stability over time. J Nutr 2009; 139(2): 323-8.
10. Sichieri R. Dietary patterns and their associations with obesity in the Brazilian city of Rio de Janeiro. Obes Res
2002; 10(1): 42-8.
11. Sichieri R, Castro JFG, Moura AS. Factors associated with dietary patterns in the urban Brazilian population. Cad Saúde Pública 2003; 19 (S1): 47-53.
12. Marchioni DML, Latorre MRDO, Eluf-Neto J, Wünsch-Filho V, Fisberg RM. Identification of dietary patterns using factor analysis in an epidemiological study in São Paulo. São Paulo Med J 2005; 123(3): 124-7.
13. Alves ALS, Olinto MTA, Costa JSD, Bairros FS, Balbinotti MAA. Dietary patterns of adult women living in an urban area of Southern Brazil. Rev Saúde Pública 2006; 40(5): 865-73.
14. Cunha DB, Almeida RMVR, Sichieri R, Pereira RA. Association of dietary patterns with BMI and waist circumference in a low-income neighbourhood in Brazil. Br J Nutr 2010; 27: 1-6.
15. Olinto MTA, Willett WC, Gigante DP, Victora CG. Sociodemographic and lifestyle characteristic in relation to dietary patterns among young Brazilian adults. Public Health Nutr 2011; 14 (1): 150-9
16. Li J, Wang Y. Tracking of dietary intake patterns is associated with baseline characteristics of urban low-income African-American adolescents. J Nutr 2008; 138(1): 94-100.
17. Ambrosini GL, Oddy WH, Robinson M, O’Sullivan TA, Hands BP, Klerk NH et al. Adolescent dietary patterns are associated with lifestyle and family psycho-social factors. Public Health Nutr 2009; 12(10): 1807-15.
18. Ambrosini GL, Huang R-C, Mori TA, Hands BP, O’Sullivan TA, Klerk NH et al. Dietary patterns and markers for the metabolic syndrome in Australian adolescents. Nutr Metab Cardiovasc Dis 2010; 20: 274-83.
19. Brener ND, McManus T, Galuska DA, Lowry R, Wechsler H. Reliability and validity of self-reported height and
weight among high school students. J Adolesc Health
2003; 32(4): 281-7.
20. Farias-Júnior JC. Validity of self-reported weight and height for adolescent nutritional status diagnosis. Rev Bras Saúde Matern Infant 2007; 7(2): 167-74.
21. Onis M, Onyango AW, Borghi E, Siyam A, Nishida C, Siekmanna J. Development of a WHO growth reference for school-aged children and adolescents. Bull World Health Organ 2007; 85: 660-7.
22. Currie C, Roberts C, Morgan A, Smith R, Settertobulte W, Samdal O, et al. Young people’s health in context: Health Behaviour in Schoolaged Children (HBSC) study: international report from the 2001/2002 survey.
Copenhagen: World Health Organization; 2004. 237p.
23. World Health Organization. Guidelines for controlling and monitoring the tobacco epidemic. Geneva; 1998.
24. Associação Brasileira de Empresas de Pesquisa – ABEP: Critério de Classificação Econômica Brasil; 2008. Disponível em http:// www.abep.org/codigosguias/ critério_Brasil_2008.pdf [Acessado em 10 de fevereiro de 2011]
25. Ferreira MG, Silva NF, Schmidt FD, Gonçalves-Silva RMV, Sichieri R, Guimarães LV, et al. Development of a food frequency questionnaire for adults in a population-based sample in Cuiabá, mid-western region of Brazil.
Rev Bras Epidemiol 2010; 13(3): 1-11.
26. Araújo MC, Yokoo EM, Pereira RA. Validation and calibration of a semiquantitative food frequency questionnaire designed for adolescents. J Am Diet Assoc
2010; 110: 1170-7.
27. Sichieri R, Everhart JE. Validity of a Brazilian food frequency questionnaire against dietary recalls and estimated energy intake. Nutr Res 1998; 18(10): 1649-59.
28. Cattel RB. The screen test for the number of factors.
Multivariate Behavioral Research 1966; 1: 245-76.
29. Basilevsky AT. Statistical Factor Analysis and Related Methods – Theory and Application. New York: Wiley Interscience; 1994.
30. Bezerra IN, Sichieri R. Eating out of home and obesity: a Brazilian nationwide survey. Public Health Nutr 2009; 12(11): 2037-43.
31. Story M, Neumark-Sztainer D, French S. Individual and environmental influences on adolescent eating behaviors. J Am Diet Assoc 2002; 102 (S3): 40-51.
33. McNaughton SA, Mishra GD, Stephen AM, Wadsworth MEJ. Dietary patterns throughout adult life are associated with body mass index, waist circumference, blood pressure, and red cell folate. J Nutr 2007; 137: 99-105.
34. Fonseca H, Silva AM, Matos MG, Esteves I, Costa P, Guerra A et al. Validity of BMI based on self-reported weight and height in adolescents. Acta Paediatr 2010; 99(1): 83-8.
35. Drewnovski A. Diet image: a new perspective on the food-frequency questionnaire. Nutr Rev 2001; 59(11): 370-2.
36. Newby PK, Tucker KL. Empirically derived eating patterns using factor or cluster analysis: A review. Nutr Rev 2004; 62(5): 177-203.