1
Article based on the doctoral thesis of the JMO MASCARENHAS intitled “Padrão do consumo alimentar, sintomas de asma e fatores associados em adolescentes de Salvador, Bahia”. Universidade Federal da Bahia; 2013.
2
Universidade Federal da Bahia, Instituto de Saúde Coletiva,Programa de Pós-Graduação em Saúde Coletiva. R. Basílio da Gama, s/n., Campus Universitário Canela, 40110-040, Salvador, Bahia, Brasil. Correspondência para/Correspondence to: JMO MASCARENHAS. E-mail: <[email protected]>.
3
Universidade Federal da Bahia, Escola de Nutrição, Departamento Ciência da Nutrição. Salvador, Bahia, Brasil. 4
Universidade Federal da Bahia, Instituto de Matemática, Departamento Estatística. Salvador, Bahia, Brasil.
Support: This work partially funded by the Fundação de Amparo à Pesquisa do Estado da Bahia (nº 1431040053551), Projeto Scaala-Instituto de Ciência Coletiva/Universidade Federal da Bahia (nº 10/0102) and Universidade Estadual de Feira de Santana.
Identification of food intake patterns and
associated factors in teenagers
1Identificação dos padrões de consumo alimentar
e fatores associados em adolescentes
Jean Márcia Oliveira MASCARENHAS2
Rita de Cássia Ribeiro SILVA3
Ana Marlúcia Oliveira de ASSIS3
Mônica Leila Portela de SANTANA3
Lia Terezinha Lana Pimenta de MORAES4
Maurício Lima BARRETO2
A B S T R A C T
Objective
To identify schoolchildren«s dietary patterns and investigate the demographic, social, and economic determinants of the differences found between patterns.
Methods
The sample consisted of 1,330 students aged 11 to 17 years attending the public schools of Salvador, Bahia, Brazil. The subjects’ food intake data were collected by a semiquantitative Food Frequency Questionnaire comprising 97 food items. All information was collected during a single interview. The exposure variables were gender, age, and socioeconomic class, and the outcome variables were categorized food consumption pattern in “mixed pattern”, “traditional pattern”, and “healthy pattern”. The data were treated by simple and multiple linear regression analyses and the dietary patterns determined by factor analysis.
Results
D, C, and B (β=-0.149, p<0.007), and the “healthy pattern” was negatively associated with females (β=-0.200,
p>0.0001) and classes D, C, and B (β=-0.125, p<0.023). Conclusion
Three dietary patterns were identified among the adolescents, namely mixed, traditional, and healthy. Gender and socioeconomic class were associated with dietary patterns. Male teenagers and those in the lower socioeconomic classes had a healthier dietary pattern than their peers of higher socioeconomic classes and females.
Indexing terms: Adolescent. Food consumption. Socioeconomic factors. Linear models.
R E S U M O
Objetivo
Identificar os padrões de consumo alimentar entre escolares e investigar os determinantes demográficos, sociais e econômicos dos diferentes padrões encontrados.
Métodos
Foi estudada uma amostra de 1.330 indivíduos entre 11 e 17 anos, estudantes da rede pública de ensino, em Salvador, Bahia. A avaliação do consumo alimentar dos adolescentes foi obtida por meio de Questionário da Frequência Alimentar semiquantitativo, com 97 itens alimentares, sendo as informações coletadas em uma única entrevista com os estudantes. As variáveis de exposição foram sexo, idade e o indicador econômico; a variável desfecho foi padrão de consumo alimentar categorizada em misto, tradicional e saudável. Os dados foram analisados pela regressão linear simples e múltipla, e os padrões alimentares foram obtidos a partir da análise fatorial.
Resultados
A partir da análise das características da população, observou-se o predomínio do sexo feminino (56,9%), e idade maior que 13 anos (79,2%).A adoção do padrão alimentar misto esteve associada positivamente ao sexo feminino (β= 0,181), p<0,001. O padrão tradicional associou-se negativamente às classes D, C, B (β=-0,149), p<0,007, enquanto o padrão alimentar saudável esteve associado negativamente ao sexo feminino (β=-0,200), p<0,0001 e às classes D, C, B (β=-0,125), p<0,023.
Conclusão
Foram identificados, entre os adolescente, três padrões alimentares: misto, tradicional e saudável. Observou--se que o sexo e o indicador da condição econômica estiveram associados aos padrões alimentares. Os adolescentes da classe econômica mais baixa e do sexo masculino adotam consumo alimentar mais saudável em relação àqueles das classes econômicas mais altas e do sexo feminino.
Termos de indexação: Adolescente. Consumo alimentar. Fatores socioeconômicos. Modelo linear.
I N T R O D U C T I O N
Food is a human need that encompasses a multiplicity of aspects that influence quality of life. In this context dietary patterns emerge as a strategy to characterize population food intake trends, which contain multiple meanings, including cultural, social, and economic aspects1,2.
Dietary patterns can be defined as a set or group of foods consumed by a given population3. Thus, analysis of dietary patterns
could better predict the risk of diseases than analysis of individual nutrients or foods2,4-7.
Many studies have found an association between dietary patterns and socioeconomic class. However, their results indicate that the relationship between socioeconomic factors and dietary patterns is controversial and varies among populations, suggesting the pertinence of investigating these relationships in other contexts and different population groups8,9.
For Sichieri et al.8, the factors income and
adolescents of higher-income families. In
Diamantina (MG) people with higher income had unhealthier dietary patterns than those with lower income4. Nevertheless, other studies reported that
higher socioeconomic status encourages children and adolescents to adopt healthier diets, as seen in Salvador (BA)10. Likewise, higher-income
adolescents from São Paulo consume more produce11.
Adolescence encompasses the period from ages 10 to 19 years12. This period is biologically
important because this is when most psychological and cognitive development and physical growth occur after early childhood13. In
Brazil 20% of the population is in this phase of life, adolescence. Adolescents are considered a low-risk segment for morbidity and mortality from many diseases, so they have received little attention from public policies, especially with respect to health care14.
Few studies have investigated the association between the dietary patterns of adolescents attending public schools and social and environmental factors15. Knowing the effects
of dietary patterns on disease promotion and prevention and understanding their relationship with socioeconomic factors are important aspects for developing intervention programs and health-promoting measures8,16. Hence, the objective of
this study is to identify the dietary patterns of adolescents attending the public schools of
Salvador (BA) and determine the demographic, social, and economic factors associated with each dietary pattern.
M E T H O D S
This cross-sectional study was conducted in the urban area of Salvador (BA), from June to December 2009, and involved 207 public schools included in the 2009 school list provided by the Department of Education and Culture of Bahia
State. Students aged 11 to 17 years enrolled in the sixth, seventh, and eighth grades of the selected schools were eligible to participate in the
study. This study is part of a broader study investigating the risk factors for asthma whose sample size is based on a 24.6% prevalence of asthma symptoms17, a confidence level of 95.0%,
and a maximum allowable error of 3.0%. The final sample size was 1,027 students, but 1,330 students were interviewed.
The sampling strategy used by the present study is complex because selection of the grades and finally, the classes that encompassed this population group required taking into account both the age bracket of adolescents, which, according to the World Health Organization (WHO), ranges from 10 to 19 years, and the schools listed in the state network. Students aged 10, 18, and 19 were excluded from this population group because very few students in the study grades were that old. Therefore, the sampling calculation used Simple Random Sampling Without Replacement (SRSWOR); schoolchildren selection relied on a two-stage cluster sampling: the first stage consisted of selecting the schools, and the second stage of selecting the classes. Twenty-one schools were selected from the 207 state schools, and three classes were selected from each school and in each, given that each class had approximately 30 students. All students who agreed to participate in the study and obtained their guardians’ consent were interviewed. The study was approved by the Research Ethics Committee of Universidade Federal da Bahia (UFBA) Institute of Collective Health under Protocol number 002/08 CEP/ISC. The students’ guardians who agreed with their children’s participation in the study signed a free and informed consent form or provided their fingerprints if they were illiterate.
Adolescents who were pregnant, breastfeeding, or wearing casts were excluded.
≥4 times a week=4; and the number of times the food was consumed during the day. The interviews were conducted by trained dieticians and dietary technicians from July to December 2009 using a standardized and validated questionnaire. All data were collected during a single interview. The FFQ was administered directly to the students who informed the foods consumed at and away from home.
Social and economic information regarding the ownership of goods, home appliances, and education level of the family head (incomplete elementary school, elementary school, high school, and higher education) were provided by the adolescent’s guardian and noted in a standardized questionnaire. Their socioeconomic class was given by the Critério de Classificação Econômica Brasil (CEEB, Brazilian Economic Classification Criterion) created by the Associação Brasileira de Empresas de Pesquisas18 (Brazilian
Association of Market Research Companies), which classifies the Brazilian population into the following socioeconomic classes: A1, A2, B1, B2, C1, C2, D, and E. Nobody in the study population represented the A strata. The strata were associated with the following incomes: A (A1/A2): more than 30 minimum salaries (m.s); B (B1/B2): 15 to 30 m.s; C (C1/C2): 6 to 15 m.s; D: 2 to 6 m.s; and E: up to 2 m.s The minimum salary per month in 2009 corresponded to R$465,00. The CEEB indicator uses the following information to determine socioeconomic class: ownership of goods and home appliances, and education level of the family head (incomplete elementary school, elementary school, high school, and higher education). In the present study, the families were categorized as having better socioeconomic status (classes B, C, and D) or worse socioeconomic status (class E). Age was categorized as <13, 13-15, and >15 years.
Dietary patterns were identified by factor analysis using Principal Component Analysis (PCA)6,18. First, the number of factors was given
by values greater than one for variance and the
number of components that remained in the screen plot whose points of maximum slope indicated the most appropriate number of retained components that would define the dietary patterns4,6,9. Many authors find factor
analysis suitable for determining dietary patterns2,19.
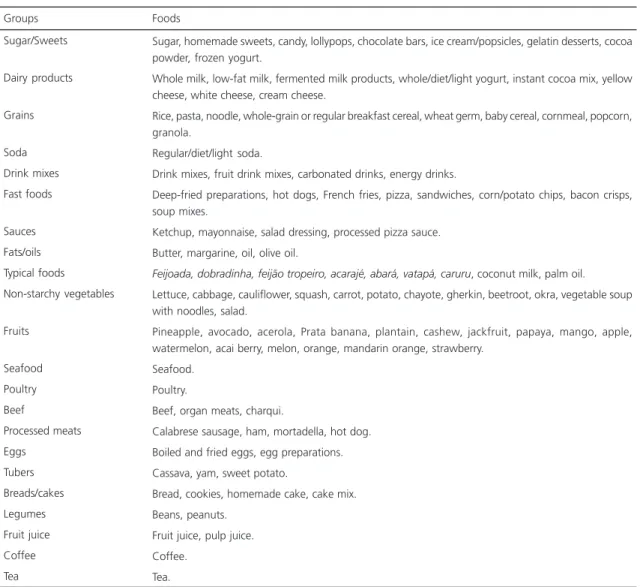
For factor analysis, the foods were grouped according to their nutritional characteristics, the intake habits of this population, and the study objectives (Table 1). Next, the frequencies of the foods consumed from each food group were added, constituting the numerator of the summary measurement. The denominator corresponded to the maximum number of foods that an individual could consume per food group multiplied by five7. A score was generated for each
food group. Factor analysis was performed after this procedure.
Factor analysis requires meeting some prerequisites. The first regards the ratio between the number of individuals and the number of foods (variables in the FFQ). The Kaiser-Meyer-Olkin (KMO) measure of sampling adequacy tested the appropriateness of the data for factor analysis4,5,7,9. Varimax rotation examined the
exploratory factor structure (pattern) of the FFQ, considering factor loadings greater than 0.307.
Factor analysis groups the foods listed in the FFQ according to the degree of correlation between them and creates new variables called factors or principal components to represent these groups. The total variance explained by the three generated factors identified the number of factors retained by factor analysis, in addition to those given by the screen plot.
(SVY). The database was created and processed by the software Epi Info version 6.04, and analyzed by the software Stata version 10.
R E S U L T S
Most of the study sample were females (56.9%) older than 13 years. Approximately half the sample was from class E and the other half from classes B, C, and D.
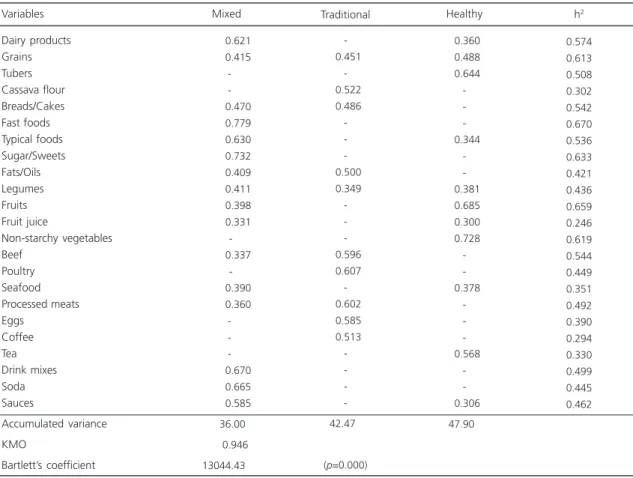
Food Frequency Questionnaire analysis resulted in three dietary patterns named “mixed”, “traditional”, and “healthy” (Table 1). Although all foods occur in each of these three patterns,
the “mixed” pattern had a prevalence of fast foods, sugar, sweets, processed beverages, dairy products, soda, and typical foods; the “traditional” pattern had a prevalence of poultry, processed meats, beef, eggs, coffee, breads/ cakes, and cassava flour; and the “healthy” pattern had a prevalence of fruits, vegetables, and grains.
For testing the appropriateness of using factor analysis, the first criterion to be met was determining the ratio between the number of individuals and the number of foods listed in the FFQ, which was 14:1. For PCA, the KMO was 0.946, and Bartlett’s test of sphericity was
Table 1. Grouping of foods used in factor analysis according to their nutritional characteristics. Salvador (BA), Brazil, 2009-2010.
Sugar/Sweets
Dairy products
Grains
Soda Drink mixes Fast foods
Sauces Fats/oils Typical foods Non-starchy vegetables
Fruits
Seafood Poultry Beef
Processed meats Eggs
Tubers Breads/cakes Legumes Fruit juice Coffee Tea Groups
Sugar, homemade sweets, candy, lollypops, chocolate bars, ice cream/popsicles, gelatin desserts, cocoa powder, frozen yogurt.
Whole milk, low-fat milk, fermented milk products, whole/diet/light yogurt, instant cocoa mix, yellow cheese, white cheese, cream cheese.
Rice, pasta, noodle, whole-grain or regular breakfast cereal, wheat germ, baby cereal, cornmeal, popcorn, granola.
Regular/diet/light soda.
Drink mixes, fruit drink mixes, carbonated drinks, energy drinks.
Deep-fried preparations, hot dogs, French fries, pizza, sandwiches, corn/potato chips, bacon crisps, soup mixes.
Ketchup, mayonnaise, salad dressing, processed pizza sauce. Butter, margarine, oil, olive oil.
Feijoada, dobradinha, feijão tropeiro, acarajé, abará, vatapá, caruru, coconut milk, palm oil. Lettuce, cabbage, cauliflower, squash, carrot, potato, chayote, gherkin, beetroot, okra, vegetable soup with noodles, salad.
Pineapple, avocado, acerola, Prata banana, plantain, cashew, jackfruit, papaya, mango, apple, watermelon, acai berry, melon, orange, mandarin orange, strawberry.
Seafood. Poultry.
Beef, organ meats, charqui.
Calabrese sausage, ham, mortadella, hot dog. Boiled and fried eggs, egg preparations. Cassava, yam, sweet potato.
Bread, cookies, homemade cake, cake mix. Beans, peanuts.
Fruit juice, pulp juice. Coffee.
13044.43 (p=0.000). These results indicate that the method is appropriate for this analysis. PCA resulted in three factors with a root greater than 1 that explained 47.9% of the total variance. Foods from each group with loadings below 0.30 were excluded to simplify the analysis. Also, these food items contributed little to the dietary patterns (Table 2).
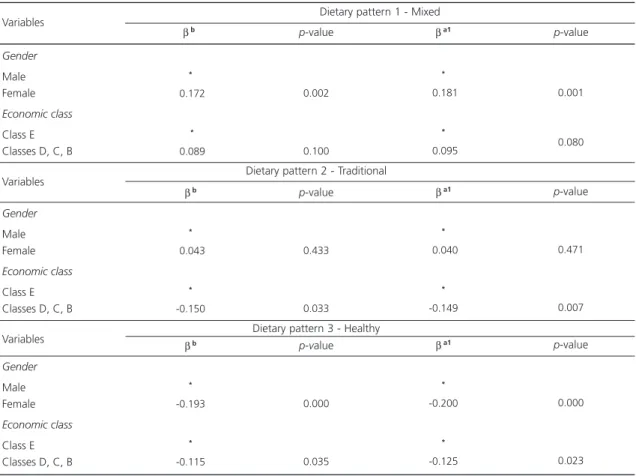
The factors gender and socioeconomic class were associated with the three dietary patterns identified in this study (Table 3). The “mixed” pattern was positively associated with being female (β=0.181, p<0.001); the “traditional” pattern was negatively associated with classes D, C, and B (β=-0.149, p<0.007); and the “healthy” pattern was negatively associated with being female (β=-0.200, p<0.000) and the classes D, C, and B (β=-0.125, p<0.023).
D I S C U S S I O N
Analysis of the dietary patterns of the study adolescents identified three dietary patterns named “mixed,” “traditional,” and “healthy.” The “mixed” pattern contained a prevalence of fast foods, sugar and sweets, processed beverages, soda, and some seafood, fruits, and legumes; the “traditional” pattern contained a prevalence of poultry, processed meats, beef, eggs, coffee, and manioc flour; and the “healthy” pattern contained a prevalence of produce and grains.
The dietary pattern of the study adolescents was associated with gender. Females prefer the “mixed” pattern and males, the “healthy” pattern. Gender did not influence adherence to the “traditional” pattern. Therefore,
Table 2.Distribution of the factor loadings of the dietary patterns of the study population. Salvador (BA), Brazil, 2009-2010.
Dairy products Grains Tubers Cassava flour Breads/Cakes Fast foods Typical foods Sugar/Sweets Fats/Oils Legumes Fruits Fruit juice Non-starchy vegetables Beef Poultry Seafood Processed meats Eggs Coffee Tea Drink mixes Soda Sauces Accumulated variance KMO Bartlett’scoefficient Variables 00000.621 00000.415 -00000.470 00000.779 00000.630 00000.732 00000.409 00000.411 00000.398 00000.331 -00000.337 -00000.390 00000.360 -00000.670 00000.665 00000.585
00036.000 0000.946 13044.430 -00.451 -00.522 00.486 -00.500 00.349 -00.596 00.607 -00.602 00.585 00.513 -42.470
(p=0.000)
00.360 00.488 00.644 -00.344 -00.381 00.685 00.300 00.728 -00.378 -00.568 -00.306 47.900 0.574 0.613 0.508 0.302 0.542 0.670 0.536 0.633 0.421 0.436 0.659 0.246 0.619 0.544 0.449 0.351 0.492 0.390 0.294 0.330 0.499 0.445 0.462
Mixed Traditional Healthy h2
males have healthier dietary patterns than females.
These results are in agreement with those of other studies on this subject. Bigio et al.11
conducted a study with 812 adolescents aged 12 to 19 years in São Paulo (SP) and found that males consumed more fruits and non-starchy vegetables than females. In South Africa a study found that females consume fast foods more often than males20. This behavior may result in higher calorie
intake and stem from the fact that females stay at home more and are more inactive than males. In João Pessoa (PB) Farias Junior et al.21 found
that males were more physically active than females. This may be explained by biological, sociocultural, and body image differences and different gender attributes. Gender differences with respect to healthy food habits were also
found in Pelotas (RS) since male adolescents followed the recommendations of consuming healthy foods (grains and milk, for example) more often than female adolescents9.
However, some studies show opposite results, such as a study conducted in the Balearic Islands in the Mediterranean Sea that found that boys adhered more to the Western diet while girls, to the Mediterranean diet, a diet high in healthy foods22. In the United States of America, a study
conducted from 1977 and 2006 with 31,337 children and adolescents found that males consumed larger portions than females23.
In the present study, the “traditional” and “healthy” dietary patterns were associated with low socioeconomic class. Adolescents from higher socioeconomic classes adhere less to healthier patterns and more to the Western diet. These
Table 3. Factors associated with the dietary patterns of the study population.Salvador (BA), Brazil,2009-2010.
Gender
Male Female Economic class
Class E Classes D, C, B
Gender
Male Female Economic class
Class E Classes D, C, B
Gender
Male Female Economic class
Class E Classes D, C, B Variables
*
-0.172
*
-0.089
βb
*
-0.043
*
-0.150
βb
*
-0.193
*
-0.115 βb
Dietary pattern 2 - Traditional
Dietary pattern 3 - Healthy
0.002
0.100
p-value
0.433
0.033
p-value
0.000
0.035
p-value βa1
*
-0.181
*
-0.095
βa1
*
-0.040
*
-0.149
βa1
*
-0.200
*
-0.125
0.001
0.080
p-value
0.471
0.007
p-value
0.000
0.023 p-value Dietary pattern 1 - Mixed
Note: βb: Unadjusted coefficient;βa1: Coefficient adjusted for gender, age, and patterns 2 and 3; βa2: Coefficient adjusted for gender, age, and
patterns 1 and 3; βa3: Coefficient adjusted for gender, age, and patterns 1 and 2. Variables
findings corroborate those of Olinto et al.19 who
found that individuals from Pelotas (RS) of lower socioeconomic classes adhered more to the traditional Brazilian dietary pattern than those of higher socioeconomic classes, who consumed more ready-to-eat processed foods typical of the Western diet. In Brazil, Silva et al.24 and Levy-Costa
et al.25 found a direct relationship between higher
socioeconomic class and consumption of diets with high fat and simple sugar contents. Better socioeconomic status has been associated with consumption of unhealthy foods because unlike individuals of low socioeconomic classes who can only afford staple foods, such as rice, beans, bread, milk, and coffee (regardless of low produce intake), those of higher socioeconomic classes can afford ready-to-eat processed foods.
In Western Australia, Ambrosini et al.15
found that low income was associated with the Western diet in 14-year-old adolescents. Low food availability is often due to low income, which usually has a negative impact on the amount and quality of the foods consumed by poor families26.
This situation frequently leads to compensatory eating practices, such as higher intake of fast foods, soda, canned foods, sweets, or candy27,
as seen in some of our study participants. A study in Spain showed that the intake of sweets, pastry (a source of fat), sugar, and savory snacks was higher among adolescents from lower income families28. In Salvador (BA) D’Innocenzo et al.10
found that children aged 4 to 11 years of higher socioeconomic classes consumed a higher amount of healthy foods than those of low socioeconomic classes. However, the sample of the said study consisted mostly of children, not adolescents, and D’Innocenzo et al.10 included children from
higher-income neighborhoods whose characteristics differ from those of the present study population, probably contributing to the different results.
Food intake expresses food availability in regional contexts and in contexts related not only to local cultural aspects but also to the conditions of different social strata, which will influence the
acquisition of different types of food9. These
specificities explain the diversity of dietary patterns since each population and region have their own characteristics. These characteristics will impact the formation of each dietary pattern differently and hinder the comparison of dietary pattern studies in different contexts.
The association between better income and foods in the “mixed” pattern seems to be mediated by changes imposed especially by the modern lifestyle adopted by Brazilian families in the last decades. For some authors, food away from home and a greater availability of fast and processed foods are directly associated with family income29, education level11,and food availability.
Although food intake studies have limitations, such as memory bias, classification, and quantification, and because the present study is cross-sectional, thereby preventing: the establishment of causal relationships; the contemplation of the temporal sequence of exposure and effect; and the subjectivity associated with factor analysis and the number of study factors9,19; the results confirm that
socioeconomic conditions determine dietary patterns15,18,25.
C O N C L U S I O N
A C K N O W L E D G M E N T S
We thank all those involved in the development of this study, the Universidade Federal da Bahia, and the Universidade do Estado de Feira de Santana.
C O N T R I B U T O R S
JMO MASCARENHAS and ML BARRETO helped to conceive the study, analyze the data, interpret the results, and write the manuscript. RCR SILVA, AMO ASSIS, and MLP SANTANA helped to interpret the results and write the manuscript. LTLP MORAES analyzed the data.
R E F E R E N C E S
1. Zancul MS. Hábitos alimentares e seus aspectos sociais, comportamentais e culturais. Rev Inst Ciênc Saúde. 2004; 22(3):195-9.
2. Hu FB. Dietary pattern analysis: A new direction in nutritional epidemiology. Curr Opin Lipidol. 2002; 13(1):3-9.
3. Garcia I. Reflexos da globalização na cultura tar: considerações sobre as mudanças na alimen-tação urbana. R Nutr. 2003; 16(4):483-92. doi: 10.1590/S1415-52732003000400011
4. Nobre LN, Lamounier JA, Franceschini SCC. Padrão alimentar de pré-escolares e fatores associados. J Pediatr. 2012; 88(2):129-36.
5. Hearty AP, Michael J. Gibney MJ. Comparison of cluster and principal component analysis techniques to derive dietary patterns in Irish adults.Br J Nutr. 2009; 101(4):598-608.
6. Neumann AICP, Martins IS, Marcopito LF, Araujo EAC. Padrões alimentares associados a fatores de risco para doenças cardiovasculares entre residentes de um município brasileiro. Rev Panam Salud Publica. 2007; 22(5):329-39.
7. Newby PK, Tucker KL. Empirically derived eating patterns using factor or cluster analysis: A review. Nutr Rev. 2004; 62(5):177-203.
8. Sichieri R, Castro, JFG, Moura, AS. Fatores as-sociados ao padrão de consumo alimentar da popu-lação brasileira urbana. Cad Saúde Pública. 2003; 19(Supl 1):S47-S53.
9. Neutzling MB, Assunção MCF, Malcon MC, Hallal PC, Menezes AMB. Food habits of adolescent students from Pelotas, Brazil. Rev Nutr. 2010; 23(3):379-88. doi: 10.1590/S1415-52732010000 300006
10. D’Innocenzo S, MarchioniML, Matildes S, Prado MS, Sheila MA, MatosSMA, et al. The socio-economic conditions and patterns of food intake in children aged between 4 and 11 years: The SCAALA study - Salvador/Bahia.Rev Bras Saúde Mater Infant. 2011; 11(1):41-9.
11. Bigio RS, Verly JE, Castro MA, César CLG, Fisberg RM, Marchioni DML. Determinants of fruit and vegetable intake in adolescents using quantile regression. Rev Saúde Pública. 2011; 45(3):448-56. 12. World Health Organization. Young people´s health: A challenge for society. Report of a WHO Study Group on Young People and Health for all. Geneva: WHO; 1986. Technical Report Series, n. 731. 13. Cordeiro LS, Lamstein S, Mahmud Z, Levinson FJ.
Adolescent malnutrition in developing countries: A close look at the problem and at two national experiences. SCN News. 2006; (31):6-13.
15. Ambrosini GL, Oddy WH, Robinson M, O’Sullivan TA, Hands BP, Klerk NH, et al. Adolescent dietary patterns are associated with lifestyle and family psycho-social factors. Public Health Nutr. 2009; 12(10):1807-15.
16. Lahelma E, Martikainen P, Laaksonen ML, Aittomäki A. Pathways beteween socioeconomic determinants of health. J Epidemiol Comm Health. 2004; 58(4):327-32.
17. Solé D, WandalsenGF, Camelo-NunesIC, Naspitz CKN, ISAAC - Grupo Brasileiro.Prevalência de sinto-mas de asma, rinite e eczema atópico entre crianças e adolescentes brasileiros identificados pelo International Study of Asthma and Allergies (ISAAC) - Fase 3. J Pediatr. 2006; 82(5):341-6.
18. Associação Brasileira de Empresas de Pesquisa. Cri-tério de Classificação Economica Brasil. São Paulo: Abep; 2008 [acesso 2008 jun 15]. Disponível em: <http://www.abep.org>.
19. Olinto MTA. Dietary patterns: Principal component analysis. In: Kac G, Editor. Nutritional epidemiology. Rio de Janeiro: Fiocruz; 2007. p.213-62.
20. Feeley A, Musenge E, Pettifor JM, Norris SA. Changes in dietary habits and eating practices in adolescents living in urban South Africa: The birth to twenty cohort. Nutrition. 2012; 28(7):1-6.
21. Farias JJC, Lopes ADS, Mota J, Hallal PC. Physical activity practice and associated factors in adolescents in Northeastern Brazil.Rev Saúde Pública. 2012; 46(3):505-15.
23. Piernas C, Popkin BM. Increased portion sizes from energy-dense foods affect total energy intake at eating occasions in US children and adolescents: Patterns and trends by age group and sociodemographic characteristics, 1977-2006.Am J Clin Nutr. 2011; 94(5):1324-32.
24. Silva RCR, Assis AMO, Szarfarc SC, Pinto EJ, Costa LCCC, Rodrigues LC. Iniquidades socioeconômicas na conformação dos padrões alimentares de crian-ças e adolescentes.Rev Nutr. 2012, 25(4):451-61. doi: 10.1590/S1415-52732012000400003 25. Levy-Costa RB, Sichieri R, Pontes NS, Monteiro CA.
Disponibilidade domiciliar de alimentos no Brasil: distribuição e evolução (1974-2003). Rev Saúde Pública. 2005; 39(4):530-40.
26. Kaiser LL, Melgar-Quinonez HR, Lamp CL, Johns MC, Sutherlin JM, Harwood JO. Food security and nutritional outcomes of preschool-age
Mexican-American children. J Am Diet Assoc. 2002; 102(7): 924-9.
27. Feinberg E, Kavanagh PL, Young RL, Prudent N. Food insecurity and compensatory feeding practices among urban black families. Pediatrics. 2008; 122(4):e854-60.
28. Aranceta J, Pérez-Rodrigo C, Ribas L, Serra-Majem L. Sociodemographic and lifestyle determinants of food patterns in Spanish children and adolescents: The enkid study. Eur J Clin Nutr. 2003; 57(Suppl 1):S40-S4.
29. Chaud DMA, Marchioni DML. Nutrição e mídia: uma combinação às vezes indigesta. Hig Alimentar. 2004; 18(116-117):18-22.