Article
Printed in Brazil - ©2018 Sociedade Brasileira de Química
*e-mail: [email protected]
Development of a Method Based on DLLME and UFLC-DAD for the Determination
of Antibiotics in Honey Samples and the Study of Their Degradation Kinetics
Ana C. B. A. Santana,a,b Marta V. A. Santanac and Pedro A. P. Pereira*,a,d,e
aInstituto de Química, Universidade Federal da Bahia, 40170-115 Salvador-BA, Brazil
bInstituto Federal da Bahia (IFBA), Campus Barreiras, 47808-006 Barreiras-BA, Brazil
cDepartamento de Ciências Exatas e da Terra, Universidade do Estado da Bahia, Campus Salvador,
41150-000 Salvador-BA, Brazil
dCentro Interdisciplinar de Energia e Ambiente (CIEnAm), Universidade Federal da Bahia,
40170-290 Salvador-BA, Brazil
eInstituto Nacional de Ciência e Tecnologia de Energia e Ambiente (INCT E&A),
Universidade Federal da Bahia, 40170-115 Salvador-BA, Brazil
In this work, a method was developed, based on dispersive liquid-liquid microextraction (DLLME) and analysis by ultra-fast liquid chromatography coupled to diode array detector (UFLC-DAD), to simultaneously determine ten antibiotics of two different classes in honey, as well as to evaluate their degradation kinetics in this matrix. The extraction was optimized by a Box-Behnken design and the method provided good linearity and precision, limits of detection (LODs) in the range of 3.1-6.8 µg kg-1 and recoveries between 82.9 and 105.7%. The decay
velocities along the storage period have followed a first order model for nine antibiotics, while one has fitted a zero order model. In the analysis of 33 samples, sulfadimethoxine and tetracycline were found in four samples of the same year and type of blooming, freshly produced in different places, at concentrations, respectively, below and 79% higher than the established by the Brazilian legislation. This suggests an application of those drugs to the beehives, probably shortly before the samples were taken.
Keywords: honey, sulfonamide and tetracycline residues, degradation kinetics, DLLME, UFLC-DAD
Introduction
Honey is a natural and healthy product, whose major composition is based on carbohydrates, with fructose and glucose being the main sugars, although it also contains small amounts of saccharides, oligosaccharides, minerals and other metabolites.1-3 Honey is widely consumed by people around
the world, due to its several therapeutic effects and also antimicrobial, antioxidant and anti-inflammatory properties.4
The beekeeping activity in Brazil has been growing, with an annual production over 30,000 ton. According to the Instituto Brasileiro de Geografia e Estatística (Brazilian Institute of Geography and Statistics, IBGE), the amount of honey produced in 2015 was 37,800 ton.5 However, a
persistent problem for beekeepers is the infections due to
the American foulbrood and the European foulbrood, two kinds of bacterial diseases caused by Paenibacillus larvae and Melissococcus pluton, which seriously affect their larvae.6,7 In order to treat these infections, antibiotics belonging to the classes of the sulfonamides, tetracyclines and amphenicols are frequently used.6
The sulfonamides and tetracyclines are broad-spectrum antibiotics which show activity against Gram-negative and Gram-positive bacteria, including species of the genera Streptococcus, Staphylococcus, Escherichia, Neisseria, Shigella, Salmonella, Nocardia, Chlamydia and Clostridium.2,8-10 These antibiotics have been widely used
for prophylactic and therapeutic purposes, to treat bacterial infections, as well as used in the veterinary practice to promote animal growth.10-17
the honey commercialization, may result in drug residues and, therefore, making their consumption inappropriate for humans.13 The presence of such residues in honey entails
risks to the consumer’s health, may cause depreciation of the product in the international market, gives rise to adverse effects in hypersensitive individuals, such as allergic reactions, as well as carcinogenicity and development of resistance in pathogenic bacteria.10,13,18
The European regulations 2377/90/EEC19 and (EU)
37/2010,20 have not fixed maximum residue limits for
sulfonamides and tetracyclines in honey and these compounds are therefore considered as substances for which the “zero tolerance” concept is applied.21 On the
other hand, some countries, such as Switzerland, Belgium and the United Kingdom, have established maximum residue limits for each class of antibiotics in honey ranging from 20 to 50 µg kg-1.6,11,13,22,23
Brazil, through the Plano Nacional de Controle de Resíduos e Contaminantes (National Program for the Control of Residues and Contaminants, PNCRC), recommends reference limits (limits of quantification) of 20 µg kg-1 for tetracycline (TC), oxytetracycline (OTC),
chlortetracycline (CTC) and doxycycline (DXC), and 50 µg kg-1 for sulfadimethoxine (SDM), sulfamethazine
(SMTZ) and sulfathiazole (STZ), although they do not mean maximum permissible values, since these substances are considered prohibited for use in honey.24
One important issue regarding antibiotics in honey is their degradation.25,26 Once used by beekeepers in the apiary,
they may remain in honey as contaminants,13 or undergo a
degradation process during the steps of production, storage, transportation and commercialization in the markets.26
In this way, kinetic studies are important tools to reduce risks and prevent harmful effects for consumers, providing ways for establishing the shelf life for foodstuffs of animal origin.26,27
There are several works in the literature reporting studies on the degradation kinetics of antibiotics in foods.25 Prediction models based on kinetic parameters
can be developed to estimate the decay of the antibiotic concentrations as a function of time.26
Several analytical methods have been developed for the determination of tetracyclines and sulfonamides in honey samples. They are, in general, based on liquid chromatography (LC), coupled with ultraviolet absorbance (UV) detection,28,29 gas chromatography (GC),30
LC with fluorescence detection (FD)23,31 and LC or GC
coupled to mass spectrometry (MS).30,32 However, the
extraction and pre-concentration steps of samples, such as in liquid-liquid extraction (LLE),17 usually require
long times of sample preparation and large amounts of
sample and solvents, as well as present limitations for obtaining high enrichment factor and recovery.12,33 On the
other way, the solid phase extraction, which was used in several works,6,7,13,14,16,21,23 despite its advantages demands in
general long times of sample preparation, brings high costs of commercially available cartridges and manifolds and, eventually, difficulties for selecting the more appropriate solvent for the desired preparation.34 In recent years,
microextraction techniques have been successfully applied to the analysis of antibiotics and other types of analytes in honey.33,35-45
The dispersive liquid-liquid microextraction (DLLME) was first introduced by Rezaee et al.,46 in 2006, as a new microextraction technique. The conventional DLLME can be described as a ternary system, which consists of an aqueous solution containing the analytes, an extractant solvent immiscible with water and a water miscible dispersant solvent.47 DLLME’s advantages are its
simplicity of operation, speed, low cost, high recoveries and enrichment factors, besides fulfilling some requirements established in the green chemistry principles, such as the employment of very small volumes of solvents and minimum waste generation.35,44,46 On the other hand, most of
the analytical methods which are described in the literature are, in general, applied for a single class of antibacterial agents in honey,48 thus leading to a need for the development
and validation of methods which may, simultaneously, determine different classes, such as sulfonamides and tetracyclines.
The aim of this work was to develop and validate a method, based on DLLME and analysis by ultra-fast liquid chromatography coupled to diode array detector (UFLC-DAD), to determine, simultaneously, residues of ten antibiotics from two different classes, namely sulfonamides and tetracyclines, in honey samples. The method was then applied to study their decay velocity during the storage period, as well as in the analysis of real samples.
Experimental
Chemicals and reagents
Standard solutions
Individual stock solutions of standards (100,000 µg L-1)
of all veterinary drugs were prepared in methanol and stored in refrigerator at –10 oC. Multicomponent
stock solutions of the tetracyclines and sulfonamides were obtained by mixing and diluting the individual stock solutions in methanol, to a final concentration of 1,000 µg L-1. These intermediate solutions were further
diluted to prepare working solutions with concentrations of 100 µg L-1. The matrix-based standards were
prepared at concentrations of 20, 40, 60, 80, 100 and 200 µg kg-1 for tetracyclines and 10, 20, 30, 40, 50 and
100 µg kg-1 for sulfonamides, by spiking 1.0 g aliquots
of blank honey with appropriate volumes of the working solutions.
Samples
A total of 33 samples of honey, from different Brazilian states and regions of the State of Bahia, were acquired in local markets or donated by apiarists, between 2012 and 2014. Of these, 30 were of the multifloral type, while the other three were of the unifloral type. The samples were stored under artificial lighting and at room temperature, similar to store shelves, and were analyzed within their period of validity, up to 12 months after their acquisition. A more detailed description of samples is done in Table S1, in the Supplementary Information (SI) section.
Extraction of samples
For the preparation of honey samples, 1.0 g of each one was quantitatively transferred to a 10 mL volumetric flask, which was filled to the mark with a 0.01% aqueous solution of formic acid (pH 4.0) while 0.4 g of sodium chloride was added to it. The solution was then filtered through a 0.45 µm pore size membrane (Sartorius, Germany), directly to a 15 mL centrifuge tube, and 500 µL of acetonitrile and 200 µL of chloroform were quickly injected in it with a 1000 µL microsyringe (Hamilton, USA). The mixture was then manually shaken for 1 min in order to disperse the extractant solvent, containing the analytes as fine droplets.
After centrifugation for 10 min at 3,000 rpm, 70 µL of the organic extract was settled in the bottom of the flask and quantitatively transferred to a sample vial. The solvent was evaporated to dryness under a gentle nitrogen stream and the extract reconstituted in 50 µL of a 0.2% aqueous solution of formic acid.
Sample analysis
The analyses were done in an LC-20AD Series Shimadzu Prominence liquid chromatograph (Japan), equipped with a Shimadzu SPD-M20A photodiode-array detector (Japan). The chromatographic separation of the analytes was carried out on a Waters X-Terra® MS C18 column (5 µm, 2.1 × 250 mm; USA), under the following chromatographic conditions: flow rate, 0.4 mL min-1;
injection volume, 5 µL; and column temperature, 35 oC. The
mobile phase was composed of an aqueous solution of 0.5% (v/v) formic acid (solvent A) and acetonitrile (solvent B); the gradient program was: 1 to 20% B in 6 min, then 25% B at 8.5 min, then 50% B at 12.5 min, then returning to 1% B at 16 min and hold in 1% B till 19 min. The total run time was 19 min. The quantification was done with external standards and the detector signal measured at 265 nm for SDZ, STZ, SMRZ, SMTZ, SMX and SDM, and 360 nm for TC, CTC, OTC, and DXC.
The use of matrix-matched calibration standards was done, in order to compensate for the matrix effect. In this way, different concentrations of the antibiotic standards were added to the honey samples, free of the analytes, and then extracted as described in the Experimental section. An LC-electrospray ionization mass spectrometry (ESI-MS) system (Shimadzu LCMS-2020; Japan) was used to confirm the identity of the analytes in the extract. The chromatographic conditions were the same used for the DAD analysis, while for ESI-MS, they were based on a study by Dasenaki and Thomaidis,12 as follows: positive ESI
mode; interface temperature, 350 oC; heat block, 200 oC;
desolvation line (DL) temperature, 250 oC; nebulizing gas
flow, 1.5 L min-1; drying gas flow, 15 L min-1; and capillary
voltage, 4500 V.
Optimization of the extraction method
In order to obtain high recoveries and enrichment factors, the effect of different factors were examined and optimal conditions were selected.
The optimal performance was determined by applying the Box-Behnken design to the four independent variables, namely volumes of the extractant and dispersant solvents (ESV and DSV, respectively), pH and NaCl concentration (SO). This design required twenty seven experiments, which were randomly performed in order to avoid any systematic error. To determine the experimental domain of the pH factor, the pKa values of sulfonamides and
tetracyclines were considered.13,49 On the other hand, the
done by the sum of the peak areas of the tetracyclines and sulfonamides. Table 1 shows the factors and levels of the Box-Behnken design.
Equation 1 was applied for calculating the enrichment factor (EF):34
(1)
where Csed and C0 are the analyte concentrations in the
sediment phase and in the initial solution, respectively.
Method validation
The parameters evaluated in the validation study were: selectivity, linearity, limit of detection (LOD), limit of quantification (LOQ), precision (intraday and interday precision) and recovery.50
The LOD and LOQ for the analytes were calculated, respectively, as three and ten times the standard deviation (n = 7), calculated for the peak areas obtained at the lower concentration levels still observed for each analyte. However, in the analyses, the LOQs were assumed as the first point of the analytical curves, since they were in close relation with the calculated values.
The linearity of the method was evaluated through the fortification of blank honey samples with the analytes at concentrations of 10, 20, 30, 40, 50 and 100 µg kg-1 for
sulfonamides and 20, 40, 60, 80, 100 and 200 µg kg-1
for tetracyclines. The solutions, in triplicate, were then extracted as described previously. From the peak areas determined for each one of the analytes and the constructed curves, the linearity was determined empirically.
Recovery and precision were calculated at three different concentration levels, namely 20, 40 and 60 µg kg-1 for sulfonamides and 40, 60 and 100 µg kg-1 for
tetracyclines. The recoveries were calculated in terms of relative recoveries; the intraday precision was determined by analyzing three replicates for each level in the same day, while the interday precision was achieved by analyzing
three replicates for each level in three consecutive days. To evaluate the selectivity of the method, a blank sample without spike and a sample enriched with sulfonamides and tetracyclines, at 100 µg kg-1, were analyzed and the
chromatograms compared.
Sample degradation study
To perform the kinetic study of antibiotics degradation in honey, triplicate aliquots of 1.0 g of honey were directly weighed in 22 mL glass bottles and fortified at three concentration levels, namely 20, 40 and 60 µg kg-1 for
sulfonamides and 20, 60 and 100 µg kg-1 for tetracyclines.
The antibiotic concentrations were determined in samples at the intervals of 1, 2, 5, 10, 15, 20, 25, 30, 35, 40, 45, 60, 90, 120 and 150 days, according to the extraction and analysis procedures described previously. Samples, totaling 135, were stored under similar conditions to those of shelves in supermarkets, under electric light and at room temperature.
Results and Discussion
Optimization of the extraction method
In order to perform a multivariate optimization with a multi-response treatment, a Box-Behnken design was applied using a mathematical-statistical tool developed by Derringer, namely the desirability function. In this case, an individual desirability is assigned to the response (peak area) obtained for each one of the determined analytes, as a scale-free value di, where 0 ≤ di ≤ 1, with 0 for an unacceptable response and 1 for a desirable response.51
The overall desirability is then calculated as the geometric mean of the individual desirabilities.
Figure 1 shows the predicted values and desirabilities for the nine antibiotics, as a function of the evaluated parameters. The data was processed by the Statistica software52 at a confidence level of 95%.53 The desirability
value after optimization was 1.0, which is considered, according to Derringer,51 an acceptable response.
The value selection, for each factor, was done from the analysis of the global responses (global desirabilities), which are shown in the last lines of Figure 1, where vertical dashed lines point to the maximum desirability condition for each factor.
By analyzing the graphs of the first column in Figure 1, regarding the volume of the extractant solvent (VSE), and the desirability function in the last line, the overall desirability is attained for the level (+1), which means 200 µL of the extractant solvent. On the other hand, in the case of the dispersant solvent (VSD) the overall desirability
Table 1. Factors and levels of the Box-Behnken design
Factor Low (–1) Mean (0) High (+1)
ESV / µL 100 150 200
DSV / µL 500 750 1000
SO / g 0.3 0.55 0.8
pH 3.0 4.0 5.0
is attained for the level (–1), which means in this case the use of 500 µL of the dispersant solvent. For the pH and salt addition factors, the overall desirabilities have attained their maxima for the central point (0).
The final values assumed for each factor were as follows: volume of the extractant solvent (chloroform), 200 µL; volume of the dispersant solvent (acetonitrile),
500 µL; sample pH 4.0; and NaCl concentration, 4% (m/v). It is noteworthy that the nature of the extractant and dispersant solvents were preliminarily determined through the fractional factorial design. In the selection of the extractant solvent, the maximum desirability was observed for the level (+1) (Table S2 and Figure S1, SI section), which means chloroform as the extractant solvent.
According to Mashayekhi and Rezaee,54 the extractant
solvent should be slightly miscible with water and denser than it, besides presenting the ability to extract the analytes. On the other hand, for selection of the dispersant solvent the overall desirability should be maximum for the level (–1) (Table S2 and Figure S1, SI section), meaning acetonitrile as the dispersant solvent. The nature of the dispersant solvent directly affects the degree of dispersion of the extractant solvent in the aqueous phase and, consequently, the efficiency of the extraction.46
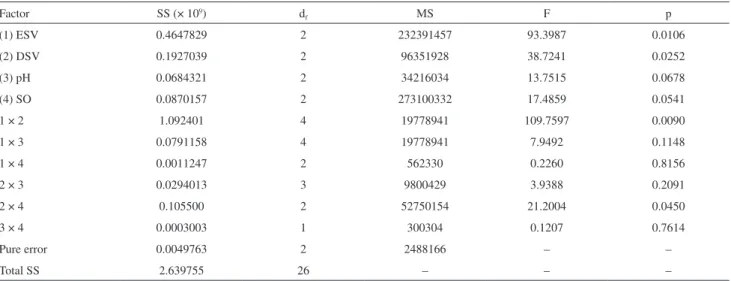
The prediction capacity of the mathematical function, fitted to the overall desirability, was evaluated by analysis of variance (ANOVA) according to Table 2, which shows that data behavior can be explained by the mathematical model adopted, since there is no lack of a fit value, at a confidence level of 95%.
When the optimal conditions were applied to the sample extractions, the enrichment factors obtained were in the range between 100 and 128.
Method validation
Selectivity
The method was evaluated for its selectivity for sulfonamides and tetracyclines. This was accomplished by the analysis of honey samples free of sulfonamides and tetracyclines, followed by the analysis of a sample, spiked with the target compounds. No interferences were observed in the chromatograms of the spiked sample, in the retention times of the analytes, as shown in Figure 2.
The selectivity was also evaluated by the purity of the chromatographic peaks, obtained through the analysis by
LC-ESI-MS. The mass spectra of pure standards, directly injected as pure solutions, were compared with those obtained for the same standards, after extraction from the matrix. Figures S2 to S11 (SI section) show spectra of standards and extracts for all the analytes, highlighting the peak purity and the absence of interferences from other components in the matrix.
Linearity and limits of detection and quantification
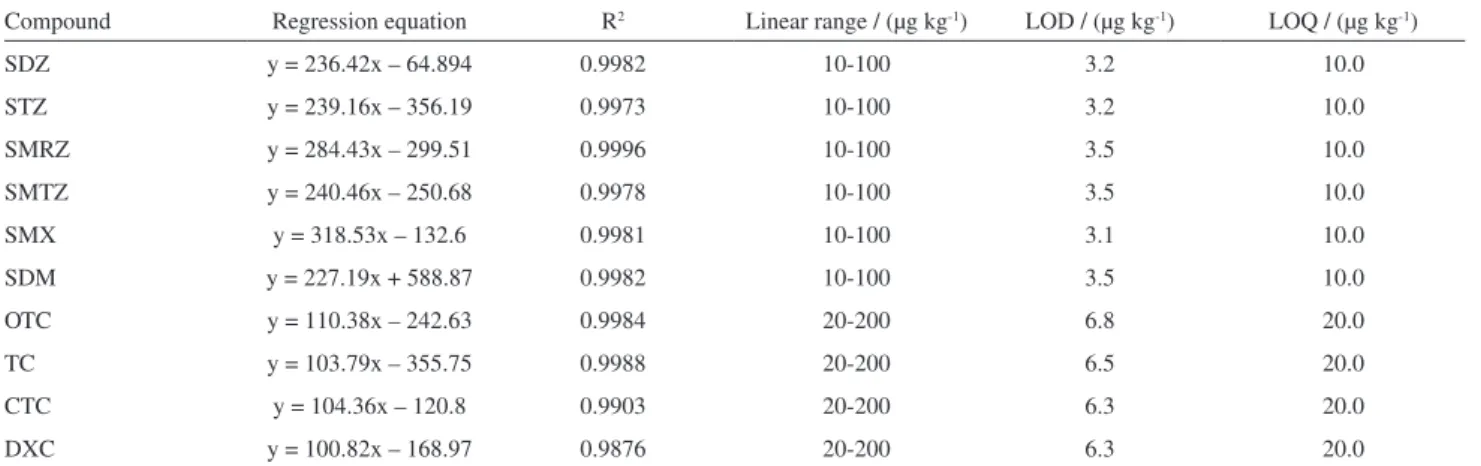
Table 3 shows the linear regression equations and the correlation coefficients (R2) calculated for the 10 antibiotics
determined.
The calibration curves were constructed by plotting the measured peak areas against the analyte concentrations. In all cases, R2 values were greater than 0.99, pointing for a
good linearity in the concentration ranges studied. The LODs and LOQs listed in Table 3 were determined as described previously in the Experimental section. According to the results, the method is able to be applied for samples of sulfonamides and tetracyclines, even at low concentrations. The obtained LODs and LOQs in this study are considerably lower than that of most of the other methods. Viñas et al.2 developed a method for the determination of tetracyclines with LODs in the range of 15-30 µg kg-1. Also
for tetracyclines, Li et al.6 obtained LODs in the range 7-12 µg kg-1, while for Pena et al.15 they were in the range
of 20-21 µg kg-1. On the other hand, Guillén et al.22 obtained
for sulfathiazole a LOD of 15 µg kg-1.
Besides, it becomes clear that the LODs and LOQs obtained with the proposed method are suitable for the quantification of the studied antibiotics in honey, since the Brazilian legislation does not establish maximum
Table 2. ANOVA evaluation of the overall desirability (D) of the response
Factor SS (× 109) d
f MS F p
(1) ESV 0.4647829 2 232391457 93.3987 0.0106
(2) DSV 0.1927039 2 96351928 38.7241 0.0252
(3) pH 0.0684321 2 34216034 13.7515 0.0678
(4) SO 0.0870157 2 273100332 17.4859 0.0541
1 × 2 1.092401 4 19778941 109.7597 0.0090
1 × 3 0.0791158 4 19778941 7.9492 0.1148
1 × 4 0.0011247 2 562330 0.2260 0.8156
2 × 3 0.0294013 3 9800429 3.9388 0.2091
2 × 4 0.105500 2 52750154 21.2004 0.0450
3 × 4 0.0003003 1 300304 0.1207 0.7614
Pure error 0.0049763 2 2488166 – –
Total SS 2.639755 26 – – –
SS: quadratic sum; df: degrees of freedom; MS: quadratic mean; F: ratio between MS and pure error; p: level of probability; ESV: volume of the extractant
allowable values for these compounds, but only reference values, namely 20 µg kg-1 for tetracyclines and 50 µg kg-1
for sulfonamides. These reference values are defined as the LOQs that any method, developed for analyzing the antibiotics in honey and using instrumental techniques, must comply with.24
It is worth mentioning that the LOQs obtained for sulfonamides are five times smaller than the reference values established by the Brazilian legislation.
Precision and accuracy
These parameters were determined at three concentration
Figure 2. Chromatograms obtained in the analysis of honey samples by DLLME-UFLC-DAD: (a) sample blank at λ = 265 nm; (b) sample spiked with the antibiotics mixture at λ = 265 nm; (c) sample blank at λ = 360 nm; (d) sample spiked with the antibiotics mixture at λ = 360 nm. (1) Sulfadiazine; (2) sulfathiazole; (3) sulfamerazine; (4) oxytetracycline; (5) tetracycline; (6) sulfamethazine; (7) chlortetracycline; (8) sulfamethoxazole; (9) doxycycline; (10) sulfadimethoxine.
Table 3. Linear regression equations, correlation coefficients (R2), LODs and LOQs for the developed method
Compound Regression equation R2 Linear range / (µg kg-1) LOD / (µg kg-1) LOQ / (µg kg-1)
SDZ y = 236.42x – 64.894 0.9982 10-100 3.2 10.0
STZ y = 239.16x – 356.19 0.9973 10-100 3.2 10.0
SMRZ y = 284.43x – 299.51 0.9996 10-100 3.5 10.0
SMTZ y = 240.46x – 250.68 0.9978 10-100 3.5 10.0
SMX y = 318.53x – 132.6 0.9981 10-100 3.1 10.0
SDM y = 227.19x + 588.87 0.9982 10-100 3.5 10.0
OTC y = 110.38x – 242.63 0.9984 20-200 6.8 20.0
TC y = 103.79x – 355.75 0.9988 20-200 6.5 20.0
CTC y = 104.36x – 120.8 0.9903 20-200 6.3 20.0
DXC y = 100.82x – 168.97 0.9876 20-200 6.3 20.0
R2: correlation coefficient; LOD: limit of detection; LOQ: limit of quantification; SDZ: sulfadiazine; STZ: sulfathiazole; SMRZ: sulfamerazine; SMTZ:
levels for each sulfonamide and tetracycline. The results are presented in Tables 4 and 5. The obtained values for recoveries (82.9-105.7%) were in the accepted range defined by the European Commission (EC) 2002/657/EC regulation for recovery: 80-110%.55 Besides, the precisions
were always lower than 20% for all the antibiotics, once again in the accepted range defined by the EC, pointing out the good performance of the developed method.
Comparison of methods
Several analytical methods for the determination of sulfonamides and tetracyclines in honey have been published, although, at our present knowledge, none of them have shown this done simultaneously. Table 6 shows a comparison among different methods and the proposed method in this work.
Despite the listed methods presenting suitable quantification limits, although in general higher than those of this work, they in general require long sample preparation times or expensive materials, such as solid-phase extraction (SPE) cartridges and commercially available collectors.34
An exception was the method by Chen et al.,56 which reports higher sensibility and lower extraction times. Nevertheless, it was applied only for two drugs of a same class.
Furthermore, the method developed in this work is simple and fast, with a single extraction step and consuming
low volumes of solvent (200 µL chloroform and 500 µL acetonitrile), thus reducing reagent consumption and minimizing waste disposal.
Method application
Degradation study of the antibiotics in honey samples
There is a great concern about the indiscriminate use of antibiotics in apiculture, since their presence in honey imposes risks to consumer’s health and product losses in the international market.13,15
The great discussion about presence of antibiotic residues in food from animal origin, is due to the fact that they can promote bacterial resistance. According to Le et al.,57 although present at low concentration levels, antibiotic residues may contribute to the development of more resistant pathogenic organisms.
In this way, the security gap could be defined as the time period that must be awaited, between the last administration of the veterinary drug to the animal and the food production, in order to ensure that it does not contain any residues, in quantities exceeding the maximum limits allowed by the current legislation.19 The security gap depends on the
velocity that each applied drug undergoes degradation, reaching levels that no longer may offer a risk to the consumers, and this process varies among different types of drugs and food.58
Table 4. Recovery percentage, intraday and interday precisions for the studied tetracyclines
Compound 40 µg kg
-1 60 µg kg-1 100 µg kg-1
Rm / % RSDr / % RSDR / % Rm / % RSDr / % RSDR / % Rm / % RSDr / % RSDR / %
OTC 92.8 6.3 6.8 95.4 4.5 6.0 94.6 5.4 4.8
TC 91.4 11.5 13.2 97.9 6.6 7.1 101.9 3.6 5.4
CTC 83.5 5.3 14.7 96.8 5.3 7.9 101.3 3.1 5.3
DXC 83.3 9.5 13.7 89.9 8.7 8.6 91.4 7.8 7.8
Rm: recovery percentage; RSDr: intraday precision; RSDR: interday precision; OTC: oxytetracycline; TC: tetracycline; CTC: chlortetracycline; DXC:
doxycycline.
Table 5. Recovery percentage, intraday and interday precisions for the studied sulfonamides
Compound 20 µg kg
-1 40 µg kg-1 60 µg kg-1
Rm / % RSDr / % RSDR / % Rm / % RSDr / % RSDR / % Rm / % RSDr / % RSDR / %
SDZ 98.3 4.0 10.2 104.9 3.1 7.3 105.6 5.2 7.9
STZ 87.4 6.9 6.3 101.8 3.8 7.1 99.6 4.4 6.5
SMRZ 93.8 4.6 13.3 99.1 6.7 6.1 94.9 2.4 6.5
SMTZ 98.6 8.8 7.8 105.0 4.6 7.4 104.7 4.4 6.5
SMX 87.8 3.1 7.9 82.9 3.6 7.0 95.3 5.8 8.8
SDM 95.8 4.2 16.1 99.9 3.0 6.5 105.7 4.9 8.1
Rm: recovery percentage; RSDr: intraday precision; RSDR: interday precision; SDZ: sulfadiazine; STZ: sulfathiazole; SMRZ: sulfamerazine; SMTZ:
Despite the great number of chemical reactions which can occur with veterinary drugs and lead to their degradation, most comprise hydrolysis and/or oxidation reactions. In part this is due to the nature of the functional groups, which are more commonly present in compounds with pharmacological activity, as well as the ubiquity of water and oxygen in the reaction media.59 Different kinetic
models have been proposed for studying the degradation of antibiotics and pesticides, either in foodstuffs of animal origin26 or honey.25,60
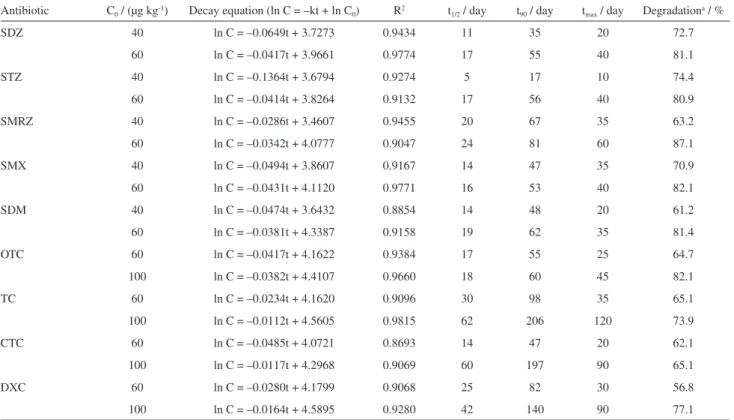
Figures 3 and 4 and Tables 7 and 8 present data related to the decay, as a function of time, of the studied antibiotics in honey, determined from experiments performed in accordance with procedures described previously. It is worth mentioning that for the initial concentration of 20 µg kg-1 it was not possible to establish the decay function
of most of the antibiotics, due to their rapid degradation in the honey samples.
It is observed from the Figures that the degradation process for the antibiotics SDZ, STZ, SMRZ, SMX, SDM, TC, OTC, CTC and DXC has followed a first order kinetic model, at the evaluated concentrations. On the other hand, SMTZ has fitted well with a zero order kinetic model, where the decay velocity does not depend on the concentration. The coefficients of determination of the curves were in large majority greater than 0.90, thus showing that models fit properly for studying the degradation of sulfonamides and tetracyclines in honey. This is due to the fact that, in food, most of the degradation reactions follow kinetic models of zero or first order.61,62 There are also studies which
report these same type of kinetic models for the reaction of sulfonamides and tetracyclines in water and soil.63,64
According to Tables 7 and 8, for each one of the evaluated concentrations, the half-life (t1/2) was calculated,
as the time required for a concentration decrease to half its initial value. The t1/2 values ranged between 5 days (STZ)
and 38 days (SMTZ) in the lowest concentration levels and between 16 days (SMX) and 98 days (SMTZ) in the highest.
It was also possible to estimate the time required for a reduction of 90% in the initial concentrations of antibiotics in honey (t90). For the sulfonamides, at the
initial concentration of 40 µg kg-1, the t
90 ranged from
17 days (STZ) to 123 days (SMTZ), while for the initial concentration of 60 µg kg-1 it ranged from 53 days (SMX)
to 166 days (SMTZ). On the other hand, for tetracyclines it ranged from 47 days (CTC) and 98 days (TC) for the initial concentration of 60 µg kg-1 and 60 days (OTC) to
206 days (TC) for 100 µg kg-1.
In the same way, Tables 7 and 8 show the maximum time determined (tmax) for which the antibiotics could still
Table 6. Comparison among different methods employed in the analysis of antibiotics in honey samples
Antibiotic Extraction technique
Solvent type
(volume) Sample amount / g
Extraction
time / min LOQ / (µg kg-1) Reference Sulfonamide LLE acetonitrile (10 mL) and
dichloromethane (2.5 mL)
5.0 60 N.D. Verzegnassi et al.17
Tetracycline SPE 10% (v/v) methanol in ethyl acetate (5 mL)
3.0 10 15-30a Viñas et al.2
Tetracycline SPE online methanol (3 mL) 5.0 n.d. 23-40 Li et al.6
Sulfonamide SPE acetonitrile (10 mL) 5.0 60 1.5-15 Sheridan et al.7
Tetracycline SPE ethyl acetate:methanol 75:25 v/v (3 mL)
3.0 13 25 Peres et al.13
Chloramphenicol and thiamphenicolb
DLLME 1,1,2,2-tetrachloroethane (30 µL) and acetonitrile
(100 µL)
1.0 2 0.1-0.6a Chen et al.56
Sulfonamide and tetracyclinec
DLLME chloroform (200 µL) and acetonitrile (500 µL)
1.0 10 10-20 this method
aLimits of detection; btwo analytes; cten analytes. LOQ: limit of quantification; n.d.: not declared; LLE: liquid-liquid extraction; SPE: solid-phase extraction;
DLLME: dispersive liquid-liquid microextraction.
Figure 4. Decay curves for five sulfonamides and four tetracyclines, as function of their initial concentrations.
Table 7. Kinetic parameters for the decay of sulfonamides and tetracyclines in honey, at different initial concentrations
Antibiotic C0 / (µg kg-1) Decay equation (ln C = –kt + ln C0) R2 t1/2 / day t90 / day tmax / day Degradationa / %
SDZ 40 ln C = –0.0649t + 3.7273 0.9434 11 35 20 72.7
60 ln C = –0.0417t + 3.9661 0.9774 17 55 40 81.1
STZ 40 ln C = –0.1364t + 3.6794 0.9274 5 17 10 74.4
60 ln C = –0.0414t + 3.8264 0.9132 17 56 40 80.9
SMRZ 40 ln C = –0.0286t + 3.4607 0.9455 20 67 35 63.2
60 ln C = –0.0342t + 4.0777 0.9047 24 81 60 87.1
SMX 40 ln C = –0.0494t + 3.8607 0.9167 14 47 35 70.9
60 ln C = –0.0431t + 4.1120 0.9771 16 53 40 82.1
SDM 40 ln C = –0.0474t + 3.6432 0.8854 14 48 20 61.2
60 ln C = –0.0381t + 4.3387 0.9158 19 62 35 81.4
OTC 60 ln C = –0.0417t + 4.1622 0.9384 17 55 25 64.7
100 ln C = –0.0382t + 4.4107 0.9660 18 60 45 82.1
TC 60 ln C = –0.0234t + 4.1620 0.9096 30 98 35 65.1
100 ln C = –0.0112t + 4.5605 0.9815 62 206 120 73.9
CTC 60 ln C = –0.0485t + 4.0721 0.8693 14 47 20 62.1
100 ln C = –0.0117t + 4.2968 0.9069 60 197 90 65.1
DXC 60 ln C = –0.0280t + 4.1799 0.9068 25 82 30 56.8
100 ln C = –0.0164t + 4.5895 0.9280 42 140 90 77.1
aEstimated degradation of the antibiotic at t
max. C0: initial concentration; R2: correlation coefficient; t1/2: time calculated for a decay of 50% of the antibiotic,
relative to its initial concentration; t90: time calculated for a decay of 90% of the antibiotic, relative to its initial concentration; tmax: maximum time for which
be detected and quantified in the samples, according to the method developed in this work, as well as their estimated decay at that moment.
Considering the initial concentration of 60 µg kg-1, which
was used in all experiments with the studied antibiotics, the average values of tmax were 43 and 27.5 days for the
sulfonamides (except sulfamethazine) and tetracyclines, respectively, while the average decay rates were 82.5 and 62.2%, respectively. Thus, even undergoing a larger decay, the sulfonamides could in general be still detected and quantified in the samples for a longer period of time, since their limits of detection and quantification were smaller than those for the tetracyclines.
The exception was sulfamethazine, which has shown a smaller decay rate and, consequently, a tmax value far
superior than the others. A possible explanation for this would be its degradation kinetics, whose zero-order model differed from the others.
Analysis of samples
According to what was previously mentioned, the importance of assessing the presence of antibiotic residues in food of animal origin is due to the fact that they can promote bacterial resistance. Even when present at low concentration levels, antibiotic residues may contribute to the development of resistant pathogens, such as species of Salmonella that became multidrug-resistant.13,15,18
In this sense, the Joint Food and Agriculture Organization (FAO)/World Health Organization (WHO) Expert Committee on Food Additives (JECFA), when evaluating the toxicological data available for some veterinary drugs, has established an acceptable daily intake (ADI) limit of 0-0.03 mg kg-1 body weight for tetracyclines TC, OTC
and CTC, alone or in combination, and 0-0.05 mg kg-1
body weight for sulfamethazine, in order to mitigate the bioaccumulative effect and, consequently, bacterial resistance to these antibiotics.13,65,66
Taking into account the above, the developed method was applied in the analysis of 33 samples of honey, in order to determine, simultaneously, residues of sulfathiazole, sulfadiazine, sulfamerazine, sulfamethazine,
sulfamethoxazole, sulfadimethoxine, oxytetracycline, tetracycline, chlortetracycline and doxycycline.
Among the ten antibiotics studied, SDM residues were found in three samples, at concentrations between 21.2 and 38.5 µg kg-1, while TC was found in one sample, at a
concentration of 35.8 µg kg-1. For sulfadimethoxine, the
concentrations were below the reference limit established by the Brazilian legislation (50 µg kg-1). However, for
tetracycline, the value was 79% higher than the established (20 µg kg-1).25
According to the tmax values previously reported in Table 7
for tetracycline, of up to 120 days, there is a possibility this antibiotic could be detected in honey, even after a more significant time from its application to the beehive and the sample collection in the producer and further analysis in the laboratory. For sulfadimethoxine, however, the tmax were
between 20 and 35 days, thus signaling that this antibiotic could have been used recently by the producer, in the case of the honey samples where it was found.
This is reinforced by the fact that these two antibiotics were found in four samples freshly produced and analyzed up to two months after their acquisition. These samples were of the same type of blooming (wildflowers) and directly obtained with producers at the end of 2014, although from different cities of the State of Bahia (Jupaguá, Cotegipe, Muquem do São Francisco and Itaberaba). This suggests an application, by these producers, of those drugs to the beehives, probably shortly before the samples were taken.
It was also noticed that most of the samples (88%) were within an allowed result, being in principle in accordance with the concept of zero tolerance,21 since these substances
are prohibited in Brazil and in some countries.6,13,22 One
possibility is that in these cases honey was being produced in beehives where the application of antibiotics has not occurred.
On the other hand, taking into account this work, which has studied the kinetics of degradation of the ten evaluated antibiotics, it is also possible that they had suffered degradation, over the time elapsed from the application by the producer and the analysis of the sample in the lab.
Table 8. Kinetic parameters for the decay of sulfamethazine in honey, at different initial concentrations
Antibiotic C0 / (µg kg-1) Decay equation (C = –kt + C0) R2 t1/2 / day t90 / day tmax / day Degradationa / %
SMTZ
20 C = –0.2659t + 21.977 0.9392 38 68 45 59.8
40 C = –0.2928t + 41.247 0.9207 68 123 90 65.9
60 C = –0.3074t + 60.649 0.9567 98 166 120 61.5
aEstimated degradation of the antibiotic at t
max. C0: initial concentration; R2: correlation coefficient; t1/2: time calculated for a decay of 50% of the antibiotic,
relative to its initial concentration; t90: time calculated for a decay of 90% of the antibiotic, relative to its initial concentration; tmáx: maximum time for
Nevertheless, it should be noted that, although four samples have shown the presence of antibiotic residues among those evaluated in this study, the concentrations found could not represent values of concern.
According to the definition of ADI, which is the estimated amount of the food additive, expressed in milligrams per kilogram of body weight (mg kg-1 b.w.), which may be daily ingested without offering appreciable risks to the person’s health, an individual would only exceed the ADI value that was set for the studied drugs after consuming about 50 kg of honey in just one day, considering a body weight of 60 kg, taken as reference for clinical studies of evaluation.
Conclusions
The method developed for the simultaneous determination of residues of sulfonamides and tetracyclines in honey provides good precision, wide linear ranges and high enrichment factors, while the limits of detection and quantification were in accordance, or even better, than those specified by the Brazilian legislation.
The degradation study with the antibiotics in honey has shown that SDZ, STZ, SMRZ, SMX, SDM, TC, OTC, CTC and DXC has followed a first order kinetic model, while for SMTZ a zero order model was followed. These results were in accordance with other authors, who say that, in food, most of the degradation reactions follow zero or first order models.
In the analyses of 33 honey samples, residues of sulfadimethoxine and tetracycline were found in four of them, at concentrations below the reference limit pointed out by the Brazilian legislation, for sulfadimethoxine, but 79% higher for tetracycline. Nevertheless, based on the established ADI limits, it should be noted that they could not represent values of concern for persons. Since these samples were all from the same period of the year, although from producers of different cities of Bahia, some problem could possibly have occurred, in order to cause a preventive application of these drugs to the beehives.
Finally, since the presence of antibiotics in honey can represent a risk to human health and causes product depreciation in the market, measures may be suggested from this study, for adoption by the Brazilian government agencies.
Supplementary Information
Supplementary information (characteristics of the honey samples, fractional factorial design data and LC-MS spectra) is available free of charge at http://jbcs.sbq.org.br as PDF file.
Acknowledgments
The authors would like to thank CNPq, FAPESB, PRONEX, the INCT of Energy and Environment, FINEP and PETROBRAS-FAFEN for their financial support. The authors also thank Dr Robson Mota de Jesus for the helpful discussions in the statistical analysis.
References
1. Can, Z.; Yildiz, O.; Sahin, H.; Turumtay, E. A.; Silici, S.; Kolayli, S.; Food Chem. 2015, 180, 133.
2. Viñas, P.; Balsalobre, N.; López-Erroz, C.; Hernández-Córdoba, M.; J. Chromatogr. A2004, 1022, 125.
3. Isidorov, V. A.; Bagan, R.; Bakier, S.; Swiecicka, I.; Food Chem.
2015, 171, 84.
4. Du, B.; Wu, L.; Xue, X.; Chen, L.; Li, Y.; Zhao, J.; Cao, W.;
J. Agric. Food Chem. 2015, 63, 6614.
5. http://biblioteca.ibge.gov.br/visualizacao/periodicos/84/ ppm_2015_v43_br.pdf accessed in February 2018.
6. Li, J.; Chen, L.; Wang, X.; Jin, H.; Ding, L.; Zhang, K.; Zhang, H.; Talanta2008, 75, 1245.
7. Sheridan, R.; Policastro, B.; Thomas, S.; Rice, D.; J. Agric. Food Chem.2008, 56, 3509.
8. Baran, W.; Adamek, E.; Ziemiańska, J.; Sobczak, A.; J. Hazard. Mater.2011, 196, 1.
9. Xu, J. Z.; Ding, T.; Wu, B.; Yang, W. Q.; Zhang, X. Y.; Liu, Y.; Shen, C. Y.; Jiang, Y.; J. Chromatogr. B: Anal. Technol. Biomed. Life Sci.2008, 868, 42.
10. Stolker, A. A. M.; Brinkman, U. A. T.; J. Chromatogr. A2005,
1067, 15.
11. Bargaanska, Z.; Namiesnik, J.; Slebioda, M.; TrAC, Trends Anal. Chem.2011, 30, 1035.
12. Dasenaki, M. E.; Thomaidis, N. S.; Anal. Chim. Acta2010,
672, 93.
13. Peres, G. T.; Rath, S.; Reyes, F. G. R.; Food Control2010, 21,
620.
14. Carrasco-Pancorbo, A.; Casado-Terrones, S.; Segura-Carretero, A.; Fernández-Gutiérrez, A.; J. Chromatogr. A2008, 1195, 107. 15. Pena, A.; Pelantova, N.; Lino, C. M.; Silveira, M. I. N.; Solich,
P.; J. Agric. Food Chem.2005, 53, 3784.
16. Thompson, T. S.; Noot, D. K.; Anal. Chim. Acta2005, 551,
168.
17. Verzegnassi, L.; Savoy-Perroud, M.; J. Chromatogr.2002, 977,
77.
18. Maudens, K. E.; Zhang, G. F.; Lambert, W. E.; J. Chromatogr. A2004, 1047, 85
20. European Union (EU); OJ L2010, L15, 1; available at http:// eur-lex.europa.eu/legal-content/EN/TXT/PDF/?uri=CELEX:3 2010R0037&rid=12, accessed in February 2018.
21. Economou, A.; Petraki, O.; Tsipi, D.; Botitsi, E.; Talanta2012,
97, 32.
22. Guillén, I.; Gabaldón, J. A.; Núñez-Delicado, E.; Puchades, R.; Maquieira, A.; Morais, S.; Food Chem.2011, 129, 624. 23. Tsai, W. H.; Chuang, H. Y.; Chen, H. H.; Wu, Y. W.; Cheng, S.
H.; Huang, T. C.; J. Chromatogr. A2010, 1217, 7812. 24. Ministério da Agricultura, Pecuária e Abastecimento (MAPA),
Secretaria de Defesa Agropecuária (SDA); Instrução Normativa SDA No. 11, de 7 de maio de 2014; available at http://www.
agricultura.gov.br/assuntos/inspecao/produtos-animal/ plano-de-nacional-de-controle-de-residuos-e-contaminantes/ documentos-da-pncrc/pncrc-2014.pdf, accessed on February 2018.
25. Thompson, T. S.; Van Den Heever, J. P.; Food Chem.2012, 133, 1510.
26. Roca, M.; Althaus, R. L.; Molina, M. P.; Food Chem.2013, 136, 376.
27. László, N.; Lányi, K.; Laczay, P.; Food Chem., in press, DOI:10.1016/j.foodchem.2017.11.041.
28. Wen, Y.; Zhang, M.; Zhao, Q.; Feng, Y. Q.; J. Agric. Food Chem.
2005, 53, 8468.
29. Tao, Y.; Liu, J.-F.; Hu, X.-L.; Li, H.-C.; Wang, T.; Jiang, G.-B.;
J. Chromatogr. A2009, 1216, 6259.
30. Assassi, N.; Tazerouti, A.; Canselier, J. P.; J. Chromatogr. A
2005, 1071, 71.
31. Raich-Montiu, J.; Folch, J.; Compañó, R.; Granados, M.; Prat, M. D.; J. Chromatogr. A2007, 1172, 186.
32. Zheng, M. M.; Zhang, M. Y.; Peng, G. Y.; Feng, Y. Q.; Anal. Chim. Acta2008, 625, 160.
33. Wang, Y.; You, J.; Ren, R.; Xiao, Y.; Gao, S.; Zhang, H.; Yu, A.;
J. Chromatogr. A2010, 1217, 4241.
34. Jardim, I. C. S. F.; Sci. Chromatogr. 2010, 2, 13.
35. Xu, X.; Su, R.; Zhao, X.; Liu, Z.; Zhang, Y.; Li, D.; Li, X.; Zhang, H.; Wang, Z.; Anal. Chim. Acta2011, 707, 92. 36. Gao, S.; Jin, H.; You, J.; Ding, Y.; Zhang, N.; Wang, Y.; Ren,
R.; Zhang, R.; Zhang, H.; J. Chromatogr. A2011, 1218, 7254. 37. Wang, H.; Hu, L.; Li, W.; Lu, R.; Zhang, S.; Zhou, W.; Gao,
H.; J. Chromatogr. A2016, 1471, 60.
38. Campillo, N.; Viñas, P.; Férez-Melgarejo, G.; Hernández-Córdoba, M.; Talanta2015, 131, 185.
39. Fan, C.; Li, N.; Cao, X.; Food Chem. 2015, 174, 446
40. Jovanov, P.; Guzsvány, V.; Lazić, S.; Franko, M.; Sakač, M.; Šarić, L.; Kos, J.; J. Food Compos. Anal. 2015, 40, 106.
41. Rosa, F. C.; Duarte, F. A.; Paniz, J. N. G.; Heidrich, G. M.; Nunes, M. A. G.; Flores, E. M. M.; Dressler, V. L.; Microchem. J. 2015, 123, 211.
42. Farajzadeh, M. A.; Mogaddam, M. R. A.; Ghorbanpour, H.;
J. Chromatogr. A 2014, 1347, 8.
43. Campone, L.; Piccinelli, A. L.; Pagano, I.; Carabetta, S.; Di Sanzo, R.; Russo, M.; Rastrelli, L.; J. Chromatogr. A2014,
1334, 9.
44. Jovanov, P.; Guzsvány, V.; Franko, M.; Lazić, S.; Sakač, M.; Šarić, B.; Banjaca, V.; Talanta2013, 111, 125.
45. Zacharis, C. K.; Rotsias, I.; Zachariadis, P. G.; Zotos, A.; Food Chem.2012, 134, 1665.
46. Rezaee, M.; Yamini, Y.; Faraji, M.; J. Chromatogr. A2010, 1217,
2342.
47. Asensio-Ramos, M.; Ravelo-Pérez, L. M.; González-Curbelo, M. A.; Hernández-Borges, J.; J. Chromatogr. A2011, 1218, 7415. 48. Marazuela, M. D.; Bogialli, S.; Anal. Chim. Acta2009, 645, 5.
49. Balakrishnan, V. K.; Terry, K. A.; Toito, J.; J. Chromatogr. A
2006, 1131, 1.
50. Ribani, M.; Bottoli, C. B. G.; Collins, C. H.; Jardim, I. C. S. F.; Melo, L. F. C.; Quim. Nova2004, 27, 771.
51. Gomes, S. V. F.; Portugal, L. A.; dos Anjos, J. P.; de Jesus, O. N.; de Oliveira, E. J.; David, J. P.; David, J. M.; Microchem. J.
2017, 132, 28.
52. Statistica, v. 7.0, StatSoft, Inc.: Tulsa, OK, 2008.
53. Brandão, H. N.; Medrado, H. H. S.; David, J. P.; David, J. M.; Pastore, J. F. B.; Meira, M.; Microchem. J.2017, 130, 179.
54. Mashayekhi, H. A.; Rezaee, M.; J. Braz. Chem. Soc.2012, 23, 1698.
55. Tayeb-Cherif, K.; Peris-Vicente, J.; Carda-Broch, S.; Esteve-Romero, J.; Food Chem.2016, 202, 316.
56. Chen, H.; Chen, H.; Ying, J.; Huang, J.; Liao, L.; Anal. Chim. Acta2009, 632, 80.
57. Le, T. X.; Munekage, Y.; Kato, S. I.; Sci. Total Environ.2005,
349, 95.
58. Singh, S.; Junwal, M.; Modhe, G.; Tiwari, H.; Kurmi, M.; Parashar, N.; Sidduri, P.; TrAC, Trends Anal. Chem.2013, 49, 71.
59. Białk-Bielińska, A.; Stolte, S.; Matzke, M.; Fabiańska, A.; Maszkowska, J.; Kołodziejska, M.; Liberek, B.; Stepnowski, P.; Kumisrka, J.; J. Hazard. Mater.2012, 221-222, 264. 60. Yuan, Z.; Yao, J.; Liu, H.; Han, J.; Trebše, P.; Ecotoxicol.
Environ. Saf. 2014, 108, 84.
61. Jarén-Galán, M.; Pérez-Gálvez, A.; Mínguez-Mosquera, M. I.;
J. Agric. Food Chem.1999, 47, 945.
62. Garvín, A.; Ibarz, R.; Ibarz, A.; Food Res. Int.2017, 96, 132.
63. Srinivasan, P.; Sarmah, A. K.; Rohan, M.; Sci. Total Environ.
2014, 488-489, 146.
64. Pouliquen, H.; Delépée, R.; Larhantec-Verdier, M.; Morvan, M. L.; Le Bris, H.; Aquaculture2007, 262, 23.
65. http://apps.who.int/food-additives-contaminants-jecfa-database/search.aspx?fc=20, accessed in February 2018. 66. Masiá, A.; Suarez-Varela, M. M.; Llopis-Gonzalez, A.; Pic, Y.;
Anal. Chim. Acta2016, 936, 40.
Submitted: October 5, 2017
Published online: February 20, 2018