Article
Printed in Brazil - ©2019 Sociedade Brasileira de Química
*e-mail: [email protected]
Determination of Parabens in Breast Milk Samples by Dispersive Liquid-Liquid
Microextraction (DLLME) and Ultra-High-Performance Liquid Chromatography
Tandem Mass Spectrometry
CarolineF.Grecco,aIsraelD.Souza,aViniciusR.AcquaroJunioraand
MariaE.C.Queiroz *,a
aDepartamento de Química, Faculdade de Filosofia Ciências e Letras de Ribeirão Preto,
Universidade de São Paulo, Av. Bandeirantes, 3900, 14040-900 Ribeirão Preto-SP, Brazil
A reliable method was developed and validated based on dispersive liquid-liquid microextraction (DLLME) and ultra-high-performance liquid chromatography coupled to tandem mass spectrometry (UHPLC-MS/MS) to determine simultaneously methylparaben (MePB), ethylparaben (EtPB), propylparaben (PrPB), and butylparaben (BuPB) in breast milk samples. A central composite design 24 with four independent variables and five levels of variance was used to optimize the DLLME conditions. The DLLME/UHPLC-MS/MS method was linear from 5 (lower limit of quantification, LLOQ) to 100 ng mL-1 (upper limit of quantification, ULOQ). The inter-assay and intra-assay precision values presented coefficients of variation (CVs) lower than 15%, and the relative standard error of the inter- and intra-assay accuracy values was lower than 10.4%. The DLLME/UHPLC-MS/MS method was successfully applied to determine parabens in human milk samples obtained from sixteen volunteer lactating mothers.
Keywords: parabens, breast milk sample, dispersive liquid-liquid microextraction, ultra-high-performance liquid chromatography tandem mass spectrometry
Introduction
The alkyl esters of p-hydroxybenzoic acid known as parabens are widely used as antimicrobial preservatives, especially to prevent mold and yeast growth in cosmetic products and pharmaceuticals; they are also employed in food and beverage processing. Concerning their chemical structure, parabens contain different alkyl groups, including methylparaben (MePB), ethylparaben (EtPB), propylparaben (PrPB), isopropylparaben (iPrPB), butylparaben (BuPB), isobutylparaben (iBuPB), and
benzylparaben (BePB).1
Given the large use of parabens as preservatives, human exposure to these compounds is widespread. Once in contact with humans, parabens are absorbed through the skin or via the gastrointestinal tract after oral intake. Oral and dermal administration of these compounds leads to their hydrolysis into the harmless p-hydroxybenzoic acid and the respective glucuronic and sulfuric acid conjugates.2 Although parabens are still considered safe,
the potential endocrine disrupting effects of the exposure
to high levels of these compounds have raised health concerns.3 High concentrations of parabens in the breast
tissue might be associated with breast cancer. Parabens can mimic estrogen action stimulating the growth of MCF7 cells, which are related to the development of breast cancer.4,5
Parabens at trace levels have been determined in several biological matrices, such as urine,2,6 breast milk,7-11
plasma,12 serum,13 amniotic fluid,14 and placental tissue.15,16
As known, lipophilic substances are mainly excreted in breast milk, and consequently, that breast milk is the major way through which breastfed infants are exposed to environmental chemicals. Breastfeeding women may be exposing their children to harmful levels of parabens in the early stages of their life when the babies are particularly vulnerable. Therefore, analysis of parabens in breast milk samples has become a topic of great scientific interest.
Pretreatment of biological samples is an important step of bioanalysis, but it is also the most difficult aspect prior the liquid chromatography (LC) separation and tandem mass spectrometry (MS/MS) detection for the target analytes. Indeed, macromolecules present in the biological samples could co-elute with the target analytes,
Determination of Parabens in Breast Milk Samples by Dispersive Liquid-Liquid
Microextraction (DLLME) and Ultra-High-Performance Liquid Chromatography
Tandem Mass Spectrometry
CarolineF.Grecco,aIsraelD.Souza,aViniciusR.AcquaroJunioraand
to impair chromatographic performance, increase column backpressure,17 and suppress electrospray ionization (ESI)
during LC-MS/MS analysis.18
Different sample preparation techniques combined with LC-MS/MS have been used to determine parabens in breast milk samples, including conventional techniques like online solid-phase extraction (online SPE),10 molecularly
imprinted micro-disc solid-phase extraction (MISPE),11
stir-membrane solid-liquid-liquid microextraction
(SM-SLLME),8 in-tube solid-phase microextraction
(in-tube SPME),9 and quick, easy, cheap, effective, rugged
and safe extraction (QuEChERS).7
Rezaee et al.19 introduced the dispersive liquid-liquid
microextraction (DLLME) in 2006. DLLME is a powerful pre-concentration technique that uses a ternary solvent system. DLLME has received special attention because it is a simple and inexpensive procedure, provides high recovery and enrichment factors, requires short extraction time, and is compatible with various matrices.6,8,12,20-22 Several factors
such as the physical properties and volume of the extraction and the disperser solvents, extraction pH, and ionic strength, can influence DLLME efficiency.23
In the present study, a powerful, fast and reliable method was developed applying DLLME and ultra-high-performance liquid chromatography coupled to tandem mass spectrometry (UHLPC-MS/MS) to extract and determine simultaneously four parabens in breast milk sample. In addition, an experimental design was applied to optimize the extraction of parabens carried out through DLLME. Lastly, the method herein was successfully applied to determine parabens in real samples collected from volunteer lactating mothers.
Experimental
Reagents and analytical standards
The methylparaben, ethylparaben, propylparaben,
butylparaben, and propyl 4-hydroxybenzoate-ring-13C
6
(internal standard (IS)) analytical standards were acquired from Sigma-Aldrich (St. Louis, USA).
The standard working solutions of the four parabens and the internal standard were prepared by diluting stock solutions of the parabens (1 mg mL-1) in methanol. The
resulting solutions were stable at –4 °C for 45 days.
Breast milk samples
Breast milk samples were collected from volunteer lactating mothers assisted at the Reference Center for Women’s Health of the Nursing School of Ribeirão Preto, University of São Paulo (USP), Brazil. The protocol used to collect milk samples prevented sample contamination. Briefly, the breast was cleaned with deionized water, and the breast milk was hand expressed. Human milk samples were collected in glass jars with lids placed below the areola. Then, the milk samples were stored in a freezer at –20 °C until use. The Ethics Committee of the University of São Paulo in Ribeirão Preto, Brazil, approved this study (protocol No. 1397/2011).
Ultra-high-performance liquid chromatography coupled to tandem mass spectrometry (UHPLC-MS/MS) conditions
The UHPLC-MS/MS system consisted of a Waters ACQUITY UHPLC (Waters Corporation, Milford, MA, USA) equipped with an ACQUITY UHPLC binary solvent system and an ACQUITY UHPLC sample manager. The UHPLC was coupled to the XEVO TQD mass spectrometer (tandem triple quadrupole) with electrospray ionization (ESI).
Chromatographic separations were conducted on
a Kinetex C18 column (100 mm × 2.1 mm × 1.7 m,
Phenomenex, USA) at 40 °C. The mobile phase consisted of acetonitrile/water (40:60, v/v) at a flow rate of 0.2 mL min-1 in the isocratic mode. Data were acquired
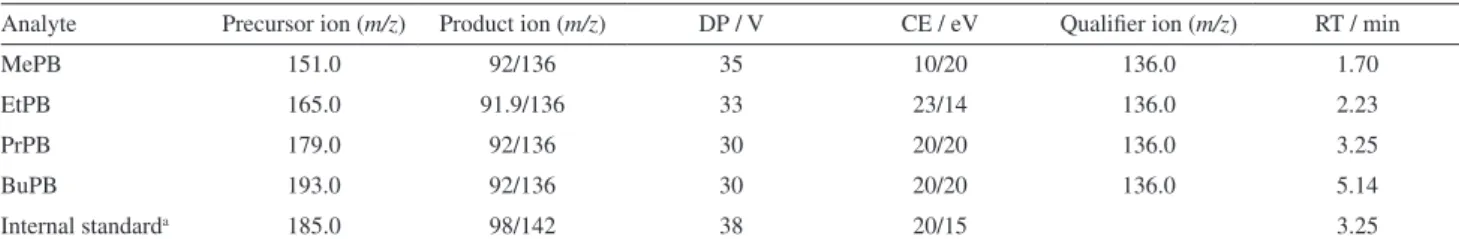
in the selected reaction monitoring (SRM) in the negative mode. Two specific transitions were optimized for each analyte, to increase the selectivity and the reliability of the method (Table 1). The first SRM transition was used for quantification, whereas the second was used for qualitative identification. The source and operating parameters were
Table1. MS/MS transition, optimal declustering potential (DP), optimal collision energy (CE), and retention time (RT) for the studied parabens Analyte Precursor ion (m/z) Product ion (m/z) DP / V CE / eV Qualifier ion (m/z) RT / min
MePB 151.0 92/136 35 10/20 136.0 1.70
EtPB 165.0 91.9/136 33 23/14 136.0 2.23
PrPB 179.0 92/136 30 20/20 136.0 3.25
BuPB 193.0 92/136 30 20/20 136.0 5.14
Internal standarda 185.0 98/142 38 20/15 3.25
aPropyl 4-hydroxybenzoate-ring-13C
optimized as follows: capillary voltage, 3.0 kV; ion source temperature, 150 °C; desolvation gas flow rate, 700 L h-1
(N2, 99.9%), at 500 °C; cone gas flow of 20 L h-1 (N2, 99.9%)
and argon as the collision gas.
Optimization of the DLLME/LC-MS/MS procedure
Commercial samples of liquid infant milk formula (NAN, 1 g) without parabens were used as blank samples. Before extraction, 1 g of the blank milk sample spiked with the IS (60 ng mL-1) and the standard solutions of the
parabens (50 µL of 100-2000 ng mL-1 solutions) was diluted
with acetonitrile (1 mL, disperser solvent) to precipitate the proteins. After centrifugation in a conic tube, 1700 µL of the supernatant was diluted with 10 mL of ammonium acetate solution (pH 6), to optimize the disperser (acetonitrile, methanol, ethanol, or acetone; 0.6 mL) and extraction solvents (dichloromethane, chlorobenzene, or trichloromethane; 500 µL).
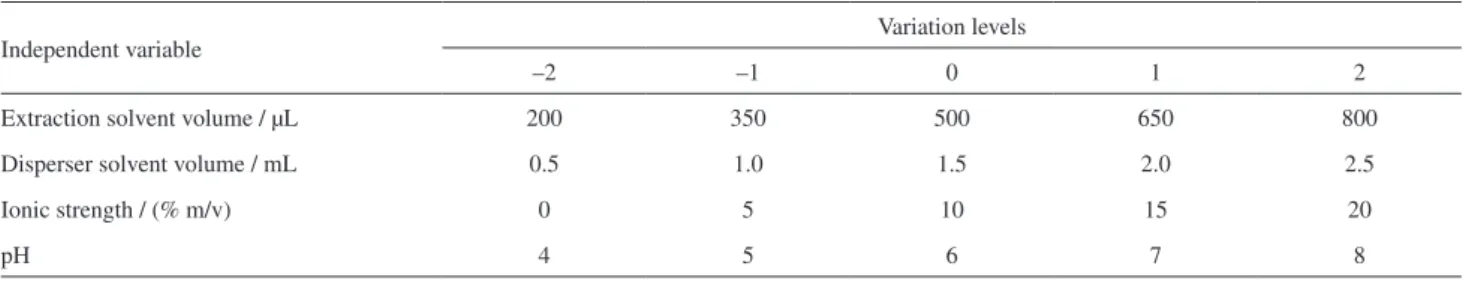
Afterward, the independent variables extraction solvent volume (dichloromethane, 200-800 µL), disperser solvent volume (acetonitrile, 0.5-2.5 mL), ionic strength (NaCl, 0-20% m/v), and pH (4-8) were optimized according to the central composite design 24 at 5 levels (Table 2). The
evaluated dependent variable (response) was the area of the target parabens. Twenty-eight randomized experiments were carried out; sixteen at the factorial points (–1, +1); eight at the axial points (–2, +2); and four at the central point (0, 0).
Analytical validation of the DLLME/UHPLC-MS/MS method
The DLLME/UHPLC-MS/MS method was fully validated in accordance with the requirements of
European Medicines Agency (EMA)24 and US Food and
Drug Administration (FDA)25 guidance documents for
bioanalytical method validation.
Additionally, the matrix effect was assessed by post-column infusion. For this assay, a standard solution containing the target parabens (100 ng mL-1 in methanol)
was continuously infused via mass spectrometer at a flow of 10 µL min-1. Then, 10 µL of a blank milk sample
(DLLME extracted) was injected into the LC, and the analytical signal of the analytes was monitored throughout the chromatographic run.
Results and Discussion
Optimization of the DLLME conditions
The appropriate mixture of extraction and disperser solvents can be considered as the most important parameter
for the DLLME procedure.26 Therefore, it is extremely
important to evaluate suitable solvents through screening tests prior to the optimization of other parameters.
All the combinations based on acetonitrile, methanol, ethanol, and acetone (disperser solvents), and dichloromethane, trichloromethane, and chlorobenzene (extraction solvents) were evaluated. Based on the experimental results, the highest recovery rates were obtained for acetonitrile as disperser solvent and dichloromethane as extraction solvent (data not shown).
Both acetonitrile (miscible with both aqueous solvents and extraction solvents) and dichloromethane (water-immiscible extraction solvent) were rapidly injected (in sequence) into an aqueous sample containing the analytes of interest. Therefore, a cloudy solution containing fine droplets of the extraction solvent was formed. Then, the analytes were extracted from the aqueous phase to the extraction phase due the high superficial area generated between the aqueous phase and the extraction solvent.
In general, chemometric techniques require fewer laboratory tests than univariate approaches and can provide the optimal conditions for a particular analytical procedure, considering the influence as well as the interaction among
the independent variables studied.27 Hence, a central
composite design 24 was performed in order to deeply
study the four independent variables: extraction solvent volume (dichloromethane, µL), disperser solvent volume (acetonitrile, mL), ionic strength (NaCl, % m/v), and pH on DLLME parabens extraction efficiency.
Through the 28 experiments performed, a predictive response model was obtained for each paraben under
Table2. Independent variables and central composite design of 24 varying levels
Independent variable Variation levels
–2 –1 0 1 2
Extraction solvent volume / µL 200 350 500 650 800
Disperser solvent volume / mL 0.5 1.0 1.5 2.0 2.5
Ionic strength / (% m/v) 0 5 10 15 20
study. The influence on the response (Y) of the independent variables (extraction solvent volume (x1), disperser solvent
volume (x2), ionic strength (x3), and pH (x4)) as well as their
interaction, were studied.
The model presented coefficient of determination (R2)
of 0.711, 0.651, 0.773, and 0.813 for MePB, EtPB, PrPB, and BuPB, respectively. These values implied that the mathematical models were able to explain 71.1, 65.1, 77.3, and 81.3% of the experimental variations that occurred throughout the analytical process, respectively.
Considering the complexity of the studied matrix (breast milk), and that the technical DLLME work involved micro volumes of solvents, the R2 values might
be considered satisfactory. Moreover, the lack-of-fit test was not significant at the 5% level (p < 0.05), indicating that the models were well adjusted.
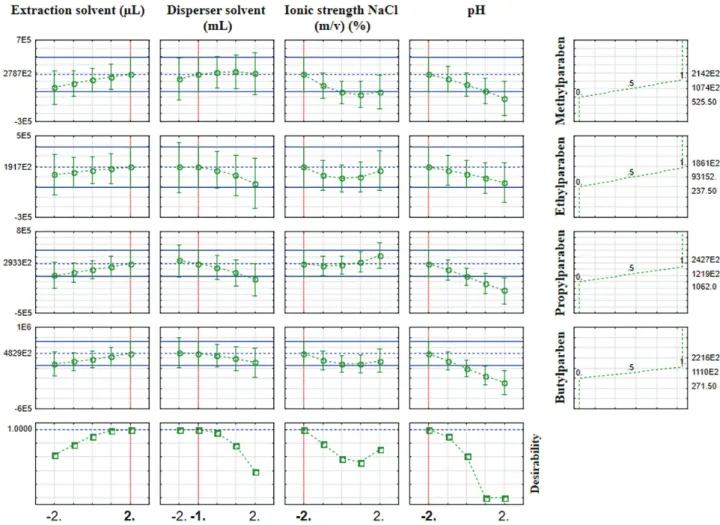
Using the Derringer and Suich’s desirability function approach that can maximize the overall desirability (multiple responses) based on the controllable factors, it was possible to obtain the best compromised condition for the simultaneous analysis of all the targeted parabens (Figure 1).28
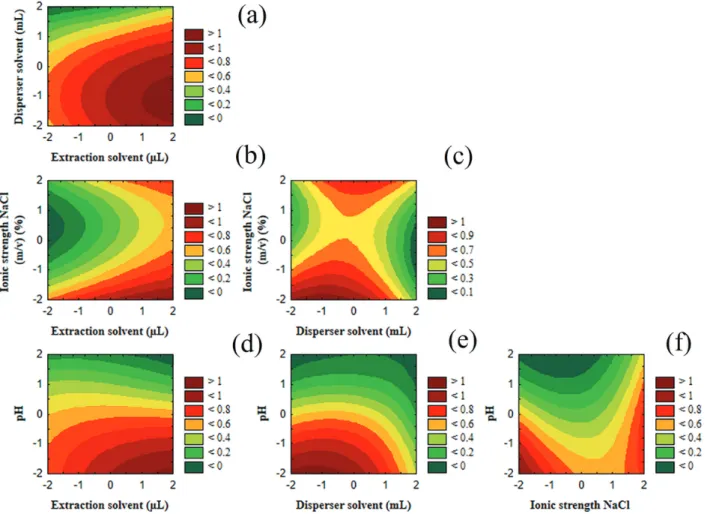
The desirability function indicated that the optimal extraction conditions were: (–2) 800 µL of dichloromethane; (–1) 1 mL of acetonitrile; (–2) 0% added with NaCl, and (–2) pH 4.0. The response surface plots obtained in the optimal conditions for all the parabens was displayed in Figure 2.
The extraction solvent volume is directly related to the extraction efficiency (Figures 2a, 2c and 2d). Based on the range estimated for the extraction solvent volume, the best extraction efficiency was obtained for 800 µL of dichloromethane.
The disperser solvent volume directly affects the formation of the cloudy solution (water/disperser solvent/ extracting solvent), the degree of extraction solvent
dispersion in the aqueous phase,29 and the extraction
efficiency.19 Large volumes of acetonitrile (1 mL) increased
the solubility of the parabens in water, thereby decreasing the extraction efficiency (Figures 2b, 2c and 2e). The extraction carried out with 1 mL of acetonitrile presented the highest signal for the analytes.
According to Figures 2a, 2b and 2f, the responses (areas of the parabens) decreased with increasing concentration
of NaCl. The salt concentration seems to decrease the solubility of acetonitrile in water phase impairing the cloudy state.30 Furthermore, the residual sodium might
provide ion suppression decreasing the analytical signal in MS/MS.17 Thus, no addition of NaCl was selected.
The evaluated pH ranged from 4.0 to 8.0. Values greater than 8.0 were not feasible because benzoic acid
esters underwent hydrolysis.31 Two processes occur
simultaneously in the parabens molecules. The first process refers to the protonation of oxygen atom in the ester group (C=O), whereas the second process concerns deprotonation of the hydroxyl group.31
Protonation is relatively slow and strongly depends on the size of the ester aliphatic chain. Longer aliphatic chains increase the strength of the positive inductive effect, thereby raising the electron density on oxygen (C=O). Protonation usually takes place at pH below 3.0; partial deprotonation occurs at pH between 3.5 and 6.5; and molecules are completely deprotonated and ionized with a negative net charge at pH above 6.5.31
In pH 4, more efficient extraction of the parabens was
obtained because the analytes were in their non-ionized form, and thus, increasing their solubility in the organic solvent (Figures 2d, 2e and 2f).
In summary, the conditions for the DLLME extraction for parabens from breast milk were optimized as follows: addition of 1 mL of acetonitrile to 1 g of breast milk sample to promote protein precipitation, followed by dilution of the supernatant with 10 mL of an ammonium acetate solution (pH 4 and 0% NaCl). Next, a mixture of acetonitrile (1 mL, disperser solvent) and dichloromethane (800 µL, extraction solvent) was used to extract the analytes from the aqueous phase.
Then, 750 µL of the organic phase was collected and transferred to an Eppendorf flask and dried. The dry extract was reconstituted in 80 µL of mobile phase (water/ acetonitrile, 60:40 v/v) and injected into the LC-MS/MS system.
Analytical validation
Based on our assays, the parabens were stable in bench
conditions (8 h) at controlled room temperature (25 °C). According to the literature,11 parabens are stable in milk
samples at –20 °C for 45 days.
The proposed method was linear with coefficient of determination higher than 0.99. In addition, all the analytical curves showed p-value greater than 0.05 for the lack-of-fit test, which indicated that the linear model for the analytical calibration curves were well adjusted. Table 3 presented the linear regression equations, R2 values, and
p-values obtained for each paraben.
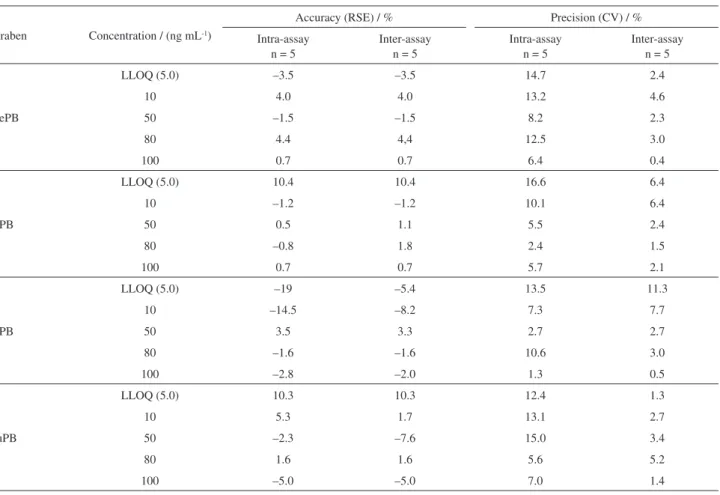
For the accuracy, the residual standard error (RSE) values ranged from –19 (lower limit of quantification (LLOQ)) to 10.4% (intra-assay accuracy), and from –8.2 to 10.4% (inter-assay accuracy), while for precision, the assays presented coefficient of variation (CV) values ranging from 1.3 to 16.6% (LLOQ) (intra-assay precision) and 0.4 to 11.3% (inter-assay precision) (Table 4).
The matrix effect was evaluated by comparing the angular coefficients of six calibration curves plotted with three blank milk samples and three breast milk samples obtained from volunteer lactating mothers. The
p-values obtained in these calibration curves were 0.2325, 0.1908, 0.1698, and 0.2079 for MePB, EtPB, PrPB, and BuPB, respectively. According to the t-test, there was no evidence (0.05 significance level) that the slopes were different.
Therefore, the results demonstrated that the calibration curves in commercial (blank) and breast (volunteers) milk
Table3. Linearity of the DLLME/UHPLC-MS/MS method for the determination of parabens in breast milk samples (n = 6)
Paraben Linear regression
[5.0(LLOQ) – 100 ng mL-1] R2
Lack-of-fit (p-value) MePB y = 0.0512x + 0.2058 0.9985 0.7904 EtPB y = 0.0532x + 0.0412 0.9947 0.9394
PrPB y = 0.0844x + 0.1046 0.9989 0.1476 BuPB y = 0.0782x + 0.7543 0.9974 0.3237
DLLME/UHPLC-MS/MS: dispersive liquid-liquid microextraction and ultra-high-performance liquid chromatography tandem mass spectrometry; LLOQ: lower limit of quantification; R2: coefficient of determination; MePB: methylparaben; EtPB: ethylparaben; PrPB: propylparaben; BuPB: butylparaben.
Table4. Precision and accuracy (intra- and inter-assay) of the DLLME/UHPLC-MS/MS method for determination of parabens in breast milk samples
Paraben Concentration / (ng mL-1)
Accuracy (RSE) / % Precision (CV) / %
Intra-assay n = 5
Inter-assay n = 5
Intra-assay n = 5
Inter-assay n = 5
MePB
LLOQ (5.0) –3.5 –3.5 14.7 2.4
10 4.0 4.0 13.2 4.6
50 –1.5 –1.5 8.2 2.3
80 4.4 4,4 12.5 3.0
100 0.7 0.7 6.4 0.4
EtPB
LLOQ (5.0) 10.4 10.4 16.6 6.4
10 –1.2 –1.2 10.1 6.4
50 0.5 1.1 5.5 2.4
80 –0.8 1.8 2.4 1.5
100 0.7 0.7 5.7 2.1
PrPB
LLOQ (5.0) –19 –5.4 13.5 11.3
10 –14.5 –8.2 7.3 7.7
50 3.5 3.3 2.7 2.7
80 –1.6 –1.6 10.6 3.0
100 –2.8 –2.0 1.3 0.5
BuPB
LLOQ (5.0) 10.3 10.3 12.4 1.3
10 5.3 1.7 13.1 2.7
50 –2.3 –7.6 15.0 3.4
80 1.6 1.6 5.6 5.2
100 –5.0 –5.0 7.0 1.4
samples were similar. Moreover, the similarities among the angular coefficients confirmed the minimum matrix effect of breast milk and the reliability of the proposed method. The post-column infusion also demonstrated that the biological matrix did not affect the ionization of the analytes significantly.
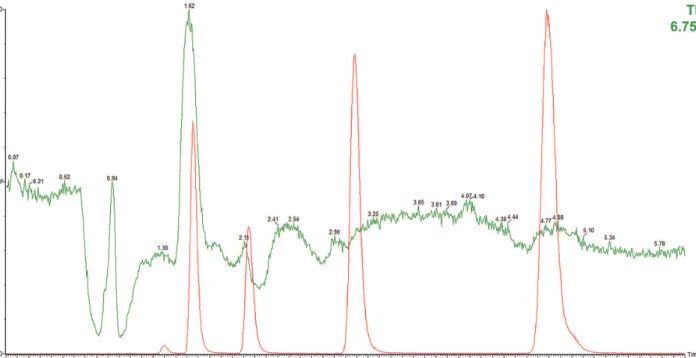
According to the chromatographic profile (Figure 3), the endogenous compound eluted around 1.6 min was related to methylparaben in the breast milk sample. In our study, it was not possible to obtain a breast milk sample completely free of parabens, thus, analytical curve was constructed using commercial milk samples spiked with the analytes. For the other parabens, the analytical signal did not enhance significantly.
The selectivity of the DLLME/UHPLC-MS/MS method was demonstrated through the chromatograms of the blank milk samples and blank milk samples spiked with the parabens at the concentration of 5 ng mL-1 (Figure 4). In
these chromatograms, the interfering peaks did not co-elute with the parabens.
Method comparison
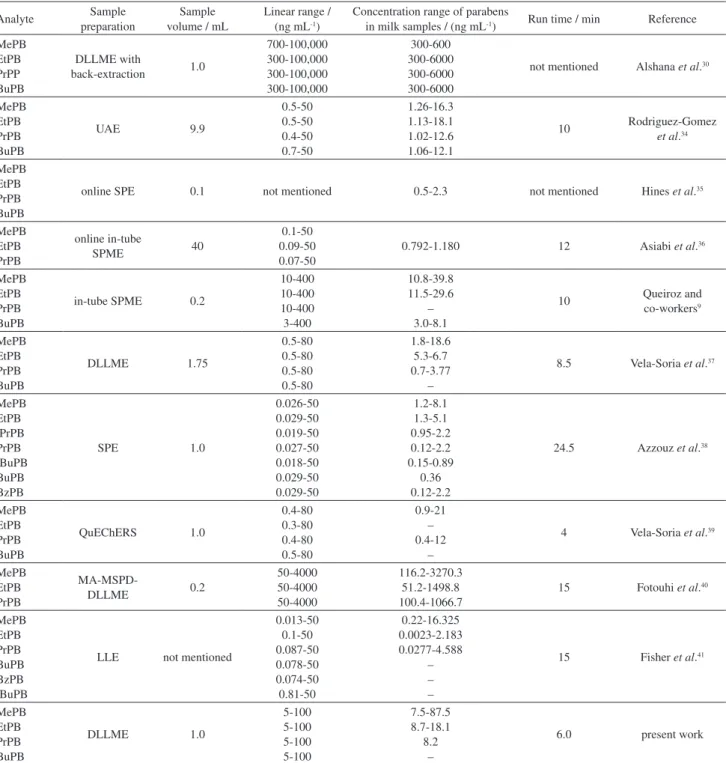
Considering the analytical linear ranges of the methods and the concentration ranges of the parabens determined in different milk samples, Table 5 compares the results obtained in this work with those described in literature.
The DLLME/UHPLC-MS/MS developed method stands out because it uses smaller sample volume (as
compared to QuEChERS7 and SM-SLLME8) and requires
shorter run time (as compared to online SPE).10 Compared
to the method developed by Melo and Queiroz,11 which
involved selective molecularly imprinted micro-disc solid-phase extraction (MISPE), the present work afforded lower LLOQ values (EtPB and PrPB). In addition, Melo and Queiroz11 did not analyze BuPB.
Regarding practical aspects involved in the sample preparation steps, DLLME is inexpensive, provides high extraction efficiency, is simple to operate, and produces smaller volume of waste solvent as compared to QuEChERS,7 online SPE,10 MISPE,11 and in-tube SPME.9
The DLLME method described by Vela-Soria et al.37 to
determine endocrine-disrupting chemicals in milk samples, presented lower LLOQ values. Probably, these results are related to the higher sensibility of the MS/MS detector. Furthermore, the proposed method herein presented LLOQ values adequate to determine parabens in breast milk samples, studied deeply the effects of DLLME factors through chemometric experimental design, and presented short analysis time.
Concentration of parabens in breast milk samples from volunteer lactating mothers
To demonstrate the applicability of the DLLME/ UHPLC-MS/MS method, fifteen breast milk samples from volunteer lactating mothers were analyzed (Table 6).
Methyl and ethyl parabens were presented in all the samples with arithmetic mean concentrations of 24.51 and 12.07 ng mL-1, respectively. Propylparaben emerged in the
Table5. DLLME method compared with other analytical methods used to determine parabens in milk samples
Analyte Sample preparation
Sample volume / mL
Linear range / (ng mL-1)
Concentration range of parabens
in milk samples / (ng mL-1) Run time / min Reference MePB
EtPB PrPB BuPB BzPB
online SPE 0.1
1.86-100 1.73-100 1.76-100 1.66-100 1.63-100
0.53-3.00 – 0.32-0.33
– –
15 Ye et al.10
MePB EtPB PrPB BuPB
PPT 0.2
1.0-8.0 1.0-1.5 1.0-2.0
–
3.7 Schlumpf et al.32
MePB EtPB PrPB
MISPE 0.2
10-150 20-150 20-150
not mentioned 10.2 Melo and Queiroz11
MePB EtPB PrPB BuPB
QuEChERS 9.9
0.09-25.0 0.09-25.0 0.09-25.0 0.1-25.0
0.4-3.5 0.2-3.4 0.1-7.5 0.2-1.3
13 Rodriguez-Gomez
et al.7
MePB EtPB PrPB BuPB
SM-SLLME 1.0
0.5-100 0.5-100 0.4-100 0.5-100
0.9-11.3 0.5-13.2 0.5-37.0 0.6-11.3
10 Rodriguez-Gomez
et al.8
MePB EtPB PrPB BuPB MePB EtPB PrPB BuPB
SBSE 9.9
0.4-100 0.4-100 0.3-100 0.3-100 0.2-100 0.3-100 0.7-100 0.2-100
0.7-7.2 0.7-13.8 0.8-43.5 0.6-14.5 0.8-7.8 0.7-15.0 0.7-41.2 0.7-13.4
26
15
Rodriguez-Gomez
et al.33
Analyte Sample preparation
Sample volume / mL
Linear range / (ng mL-1)
Concentration range of parabens
in milk samples / (ng mL-1) Run time / min Reference MePB EtPB PrPP BuPB DLLME with back-extraction 1.0 700-100,000 300-100,000 300-100,000 300-100,000 300-600 300-6000 300-6000 300-6000
not mentioned Alshana et al.30
MePB EtPB PrPB BuPB UAE 9.9 0.5-50 0.5-50 0.4-50 0.7-50 1.26-16.3 1.13-18.1 1.02-12.6 1.06-12.1 10 Rodriguez-Gomez
et al.34
MePB EtPB PrPB BuPB
online SPE 0.1 not mentioned 0.5-2.3 not mentioned Hines et al.35
MePB EtPB PrPB online in-tube SPME 40 0.1-50 0.09-50 0.07-50
0.792-1.180 12 Asiabi et al.36
MePB EtPB PrPB BuPB
in-tube SPME 0.2
10-400 10-400 10-400 3-400 10.8-39.8 11.5-29.6 – 3.0-8.1
10 Queiroz and co-workers9
MePB EtPB PrPB BuPB DLLME 1.75 0.5-80 0.5-80 0.5-80 0.5-80 1.8-18.6 5.3-6.7 0.7-3.77 –
8.5 Vela-Soria et al.37
MePB EtPB iPrPB PrPB iBuPB BuPB BzPB SPE 1.0 0.026-50 0.029-50 0.019-50 0.027-50 0.018-50 0.029-50 0.029-50 1.2-8.1 1.3-5.1 0.95-2.2 0.12-2.2 0.15-0.89 0.36 0.12-2.2
24.5 Azzouz et al.38
MePB EtPB PrPB BuPB QuEChERS 1.0 0.4-80 0.3-80 0.4-80 0.5-80 0.9-21 – 0.4-12 –
4 Vela-Soria et al.39
MePB EtPB PrPB MA-MSPD-DLLME 0.2 50-4000 50-4000 50-4000 116.2-3270.3 51.2-1498.8 100.4-1066.7
15 Fotouhi et al.40
MePB EtPB PrPB BuPB BzPB iBuPB
LLE not mentioned
0.013-50 0.1-50 0.087-50 0.078-50 0.074-50 0.81-50 0.22-16.325 0.0023-2.183 0.0277-4.588 – – –
15 Fisher et al.41
MePB EtPB PrPB BuPB DLLME 1.0 5-100 5-100 5-100 5-100 7.5-87.5 8.7-18.1 8.2 –
6.0 present work
MePB: methylparaben; EtPB: ethylparaben; PrPB: propylparaben; BuPB: butylparaben; iPrPB: isopropylparaben; iBuPB: isobutylparaben; DLLME: dispersive liquid-liquid microextraction; online SPE: online solid-phase extraction; PPT: protein precipitation; MISPE: micro-disc solid-phase extraction; QuEChERS: quick, easy, cheap, effective, rugged, safe; SM-SLLME: stir-membrane solid-liquid-liquid microextraction; SBSE: stir-bar sorptive extraction; UAE: ultrasound-assisted extraction; in-tube SPME: in-tube solid-phase microextraction; MA-MSPD-DLLME: magnetically assisted matrix solid phase dispersion followed by a dispersive liquid-liquid microextraction; LLE: liquid-liquid extraction.
Table5. DLLME method compared with other analytical methods used to determine parabens in milk samples (cont.)
majority of the samples, however, its concentration was
lower than 5 ng mL-1 (LLOQ). Methyl and ethylparabens
were detected at higher concentrations in breast milk samples because these two preservatives are frequently used in pharmaceutical, food, and cosmetic products.
The results pointed out to the mothers’ high exposure to these compounds since all the volunteers used cosmetics regularly.
study by our group,9 conducted with 16 lactating
mothers in Brazil. Using different sample preparation
techniques, Rodríguez-Gómez et al.7,8,33,34 developed
analytical methods and determined parabens in human milk samples with concentrations ranging from 0.1 to 7.5 ng mL-1, 0.5 to 37.0 ng mL-1, 0.6 to 43.5 ng mL-1 and
1.02 to 18.1 ng mL-1, respectively. Studies also conducted
in Spain37-39 determined parabens in a range from 0.12 to
8.1 ng mL-1, 0.9 to 21 ng mL-1 and from 0.7 to 18.6 ng mL-1,
respectively. Hines et al.35 determined parabens levels
from 0.5 to 2.3 ng mL-1. In the United States,10 the average
reported concentrations of parabens were 0.3-3.0 ng mL-1.
Schlumpf et al.32 established the presence of MePB, EtPB
and PrPB in 26, 15 and 11% of samples, respectively. A study from Turkey30 detected parabens in milk samples in a
concentration range from 300 to 6000 ng mL-1. In Iran,36,40
parabens levels were determined in a range from 0.792 to 1.180 ng mL-1 and 51.2 to 3270.3 ng mL-1, respectively.
Fisher et al.41 determined parabens levels in milk samples
in a range from 0.0023 to 16.325 ng mL-1.
These studies show that parabens are present in breast milk and these compounds are transferred to babies, not only during pregnancy period, but it extends throughout breast feeding. The literature42 has suggested that the use
and exposure to parabens were harmful, however, studies evaluating the effects of these compounds in long periods are insufficient, yet. The studied subset (demographics,
age, gender, and other factors) and the number of collected samples constitute its limitations.
Conclusions
Through central composite design, the DLLME extraction variables (extraction solvent volume, disperser solvent volume, addition of NaCl, and extraction pH) were optimized obtaining the highest recovery of parabens from breast milk samples.
The DLLME extraction technique provided high enrichment factors for parabens analyzed in breast milk samples, minimal amount of sample and small volumes of organic solvent. Low cost and simple operation requirements made the present technique noteworthy.
Furthermore, the DLLME/UHPLC-MS/MS method was successfully validated based on the current international guidelines of EMA and FDA.
Lastly, the application of DLLME/UHPLC-MS/MS method to analyze real breast milk samples obtained from 15 volunteer lactating mothers provided the assess of the extent to which lactating women are exposed to parabens. MePB and EtPB emerged in all samples with arithmetic mean concentrations of 24.51 and 12.07 ng mL-1,
respectively. These results enforce the real common exposure of women in the postpartum period to parabens.
Table6. Concentrations of parabens in milk samples collected from postpartum women (n = 3)
Sample
MePB EtPB PrPB BuPB
Concentration / (ng mL-1)
Standard deviation
Concentration / (ng mL-1)
Standard deviation
Concentration / (ng mL-1)
Standard deviation
Concentration / (ng mL-1)
Standard deviation
1 31.2 1.2 8.7 0.2 < LLOQ 0.1 < LLOQ –
2 16.2 2.6 9.5 0.2 8.2 0.1 < LLOQ –
3 22.3 1.4 11 0.6 < LLOQ 0.1 ND –
4 7.5 1.1 7.55 1.3 < LLOQ – ND –
5a 13.2 0.5 9.0 0.9 < LLOQ – ND –
6a 7.9 0.2 8.6 1.2 < LLOQ – ND –
7a 9.5 0.6 11.1 0.4 < LLOQ – ND –
8a 43.0 1.6 10.5 5.9 < LLOQ 0.1 < LLOQ –
9 12.3 1.5 16.9 0.4 ND – ND –
10 8.8 0.3 18.1 2.4 ND – ND –
11a 9.6 1.7 12.4 0.3 ND – ND –
12 11.3 0.8 16.2 0.15 ND – ND –
13 10.3 6.3 14.0 0.5 < LLOQ 0 ND –
14 71.7 1.5 14.0 0.3 < LLOQ 0 ND –
15a 87.5 4.3 13.5 1.1 ND – ND –
Acknowledgments
This work was supported by grants from Fundação de Amparo à Pesquisa do Estado de São Paulo (FAPESP, process 2015/04060-3, 2015/07619-1 and 2017/02147-0).
References
1. Błędzka, D.; Gromadzińska, J.; Wąsowicz, W.; Environ. Int.
2014, 67, 27.
2. Jardim, V. C.; Melo, L. P.; Domingues, D. S.; Queiroz, M. E. C.; J. Chromatogr. B2015, 974, 35.
3. Frederiksen, H.; Jørgensen, N.; Andersson, A.-M.; J. Exposure Sci. Environ. Epidemiol.2011, 21, 262.
4. Vela-Soria, F.; Ballesteros, O.; Zafra-Gómez, A.; Ballesteros, L.; Navalón, A.; Talanta2014, 129, 209.
5. Byford, J. R.; Shaw, L. E.; Drew, M. G. B.; Pope, G. S.; Sauer, M. J.; Darbre, P. D.; J. Steroid Biochem. Mol. Biol.2002, 80,
49.
6. Carrasco-Correa, E. J.; Vela-Soria, F.; Ballesteros, O.; Ramis-Ramos, G.; Herrero-Martínez, J. M.; J. Chromatogr. A2015,
1379, 65.
7. Rodríguez-Gómez, R.; Jiménez-Díaz, I.; Zafra-Gómez, A.; Ballesteros, O.; Navalón, A.; Talanta2014, 130, 561.
8. Rodríguez-Gómez, R.; Roldán-Pijuán, M.; Lucena, R.; Cárdenas, S.; Zafra-Gómez, A.; Ballesteros, O.; Navalón, A.; Valcárcel, M.; J. Chromatogr. A2014, 1354, 26.
9. Souza, I. D.; Melo, L. P.; Jardim, I. C. S. F.; Monteiro, J. C. S.; Nakano, A. M. S.; Queiroz, M. E. C.; Anal. Chim. Acta2016,
932, 49.
10. Ye, X.; Bishop, A. M.; Needham, L. L.; Calafat, A. M.; Anal. Chim. Acta2008, 622, 150.
11. Melo, L. P.; Queiroz, M. E. C.; Anal. Methods2013, 5, 3538. 12. Suh, J. H.; Lee, Y. Y.; Lee, H. J.; Kang, M.; Hur, Y.; Lee, S. N.;
Yang, D.-H.; Han, S. B.; J. Pharm. Biomed. Anal.2013, 75, 214.
13. Vela-Soria, F.; Ballesteros, O.; Rodríguez, I.; Zafra-Gómez, A.; Ballesteros, L.; Cela, R.; Navalón, A.; Anal. Bioanal. Chem.
2013, 405, 7259.
14. Frederiksen, H.; Taxvig, C.; Hass, U.; Vinggaard, A. M.; Nellemann, C.; Toxicol. Sci.2008, 106, 376.
15. Jiménez-Díaz, I.; Vela-Soria, F.; Zafra-Gómez, A.; Navalón, A.; Ballesteros, O.; Navea, N.; Fernández, M. F.; Olea, N.; Vílchez, J. L.; Talanta2011, 84, 702.
16. Vela-Soria, F.; Rodríguez, I.; Ballesteros, O.; Zafra-Gómez, A.; Ballesteros, L.; Cela, R.; Navalón, A.; J. Chromatogr. A2014,
1371, 39.
17. Chaves, A. R.; Leandro, F. Z.; Carris, J. A.; Queiroz, M. E. C.;
J. Chromatogr. B2010, 878, 2123.
18. Trufelli, H.; Palma, P.; Famiglini, G.; Cappiello, A.; Mass Spectrom. Rev.2011, 30, 491.
19. Rezaee, M.; Assadi, Y.; Milani Hosseini, M.-R.; Aghaee, E.; Ahmadi, F.; Berijani, S.; J. Chromatogr. A2006, 1116, 1.
20. Saraji, M.; Khalili Boroujeni, M.; Hajialiakbari Bidgoli, A. A.;
Anal. Bioanal. Chem.2011, 400, 2149.
21. Asensio-Ramos, M.; Hernández-Borges, J.; Borges-Miquel, T. M.; Rodríguez-Delgado, M. Á.; J. Chromatogr. A2011, 1218,
4808.
22. Han, Y.; Jia, X.; Liu, X.; Duan, T.; Chen, H.; Chromatographia
2010, 72, 351.
23. Saraji, M.; Boroujeni, M. K.; Anal. Bioanal. Chem.2014, 406,
2027.
24. European Medicines Agency (EMA); Reflection Paper on the Use of Methyl- and Propylparaben as Excipients in Human
Medicinal Products for Oral Use; EMA: London, UK, 2015.
Available at http://www.ema.europa.eu/docs/en_GB/document_ library/Scientific_guideline/2015/11/WC500196733.pdf, accessed in August 2018.
25. http://www.fda.gov/cosmetics/productsingredients/ingredients/ ucm128042.htm, accessed in August 2018.
26. Zgoła-Grześkowiak, A.; Grześkowiak, T.; TrAC, Trends Anal. Chem.2011, 30, 1382.
27. Kumar, N.; Bansal, A.; Sarma, G. S.; Rawal, R. K.; Talanta
2014, 123, 186.
28. Costa, N. R.; Lourenço, J.; Pereira, Z. L.; Chemom. Intell. Lab. Syst.2011, 107, 234.
29. Rezaee, M.; Yamini, Y.; Faraji, M.; J. Chromatogr. A2010, 1217, 2342.
30. Alshana, U.; Ertaş, N.; Göğer, N. G.; Food Chem.2015, 181, 1. 31. Angelov, T.; Vlasenko, A.; Tashkov, W.; J. Liq. Chromatogr.
Relat. Technol.2007, 31, 188.
32. Schlumpf, M.; Kypke, K.; Wittassek, M.; Angerer, J.; Mascher, H.; Mascher, D.; Vökt, C.; Birchler, M.; Lichtensteiger, W.;
Chemosphere2010, 81, 1171.
33. Rodríguez-Gómez, R.; Zafra-Gómez, A.; Camino-Sánchez, F. J.; Ballesteros, O.; Navalón, A.; J. Chromatogr. A2014, 1349,
69.
34. Rodríguez-Gómez, R.; Dorival-García, N.; Zafra-Gómez, A.; Camino-Sánchez, F. J.; Ballesteros, O.; Navalón, A.;
J. Chromatogr. B2015, 992, 47.
35. Hines, E. P.; Mendola, P.; von Ehrenstein, O. S.; Ye, X.; Calafat, A. M.; Fenton, S. E.; Reprod. Toxicol.2015, 54, 120.
36. Asiabi, H.; Yamini, Y.; Seidi, S.; Esrafili, A.; Rezaei, F.;
J. Chromatogr. A2015, 1397, 19.
37. Vela-Soria, F.; Jiménez-Díaz, I.; Díaz, C.; Pérez, J.; Iribarne-Durán, L. M.; Serrano-López, L.; Arrebola, J. P.; Fernández, M. F.; Olea, N.; Bioanalysis2016, 8, 1777.
38. Azzouz, A.; Rascón, A. J.; Ballesteros, E.; J. Pharm. Biomed. Anal.2016, 119, 16.
39. Vela-Soria, F.; Iribarne-Durán, L. M.; Mustieles, V.; Jiménez-Díaz, I.; Fernández, M. F.; Olea, N.; J. Chromatogr. A2018,
40. Fotouhi, M.; Seidi, S.; Shanehsaz, M.; Naseri, M. T.;
J. Chromatogr. A2017, 1504, 17.
41. Fisher, M.; MacPherson, S.; Braun, J. M.; Hauser, R.; Walker, M.; Feeley, M.; Mallick, R.; Bérubé, R.; Arbuckle, T. E.;
Environ. Sci. Technol.2017, 51, 4009.
42. Kirchhof, M. G.; de Gannes, G. C.; Skin Ther. Lett.2013, 18, 5.
Submitted: May 11, 2018
Published online: August 10, 2018