Brazilian Journal
of Chemical
Engineering
ISSN 0104-6632 Printed in Brazil www.scielo.br/bjce
Vol. 35, No. 01, pp. 237 – 251, January – March, 2018
* Corresponding author: Omar Gonzalez-Ortega. E-mail: [email protected]; Phone: 011 52 (444) 8262300. dx.doi.org/10.1590/0104-6632.20180351s20160404
MATHEMATICAL MODELING OF THE
BATCH ADSORPTION OF PROTEINS ON
NEW RESTRICTED ACCESS MEDIA WITH
POLY(ETHYLENE GLYCOL) AS A
SEMI-PERMEABLE BARRIER USING COMPACT FINITE
DIFFERENCES
Omar Gonzalez-Ortega
1*and Roberto Guzman
2¹Ingeniería de Bioprocesos, Facultad de Ciencias Químicas, Universidad Autónoma de San Luis Potosí, Av. M. Nava, 6, 78210, San Luis Potosí, México
²Department of Chemical and Environmental Engineering, The University of Arizona, E. James E. Rogers Way, 1133, 85721, Arizona, USA
(Submitted: June 30, 2016; Revised: October 21, 2016; Accepted: November 23, 2016)
Abstract – In this work we describe a mathematical analysis of the batch adsorption process of several proteins using a new restricted access medium consisting of agarose beads grafted with poly(ethylene glycol) (PEG) as a semi-permeable barrier and immobilized metal ions or ion exchange groups as binding sites. The model was fitted to experimental data, allowing the estimation of the adsorption rate constant and the effective diffusivity for each protein. The model was solved using compact finite differences in a MATLAB® platform. According to the results, the presence of grafted PEG reduces the adsorption of all proteins to different extent; with high molecular weight proteins being affected the most. The model also establishes a reduction in the adsorption rate constant (which affects protein interaction with binding sites). The movement of the protein molecules in the adsorbent pores is also affected by the grafted PEG, but to a lesser extent.
Keywords: Restricted access medium; Batch adsorption modeling; IMAC and IEX; Compact finite differences
INTRODUCTION
The mathematical description of the batch protein adsorption phenomenon is always required since it allows estimating the adsorption rate constant, the effective diffusivity, the maximum protein capacity, and the desorption equilibrium constant for a particular protein with a particular adsorbent. These parameters can then be used to predict the behavior of protein adsorption using fixed beds.
The maximum protein adsorption capacity and desorption equilibrium constant can be estimated from
adsorption isotherms (equilibrium data), while the adsorption rate constant and the effective diffusivity must be determined from kinetic adsorption studies. Thus, these parameters not only allow describing and elucidating the interaction between the target protein and the adsorption sites, but can also help characterize column chromatographic experiments (Sharma and Agarwal, 2002; Gutierrez et al., 2007).
such as film diffusion, pore diffusion, and surface reaction kinetics was implemented to describe the batch adsorption uptake of proteins. The model is based on basic physical and mass balance principles along with appropriate constitutive equations (e.g., second order forward reaction kinetics) and has been previously implemented to describe the adsorption, in a finite bath, of β-galactosidase onto anti- β-galactosidase immobilized on porous silica (Arve and Liapis, 1987). The same three-resistance model was also used to describe the affinity adsorption of immunoglobulin G to protein A immobilized on porous agarose matrices (Horstmann and Chase, 1989). The model has also been used to characterize the adsorption process in a column packed with spherical adsorbents (Carlsson et al., 1994; Kempe, 2007). Simplified models have been used to describe the adsorption of proteins onto spherical adsorbents. Skidmore et al. (1990) applied a lumped parameter model in which only the surface reaction rate resistance is considered relevant to describe the adsorption of protein using affinity adsorbents. In the same way, Arnold et al. (1985) presented a model that considers all the mass transfer resistance associated only to pore diffusion. These last two models, as a result of their simplicity, permit one to obtain an analytical solution of the batch adsorption process; however, not quite general.
Since the three-resistance model described in this work is composed of non-linear coupled partial differential equations, an analytical solution is not possible and, therefore, an implementation of a numerical solution is required. To accomplish this task, two approaches can be considered, the first method consists in the discretization of the time and space radial coordinates to generate a system of equations that needs to be solved simultaneously in each time step. The second one, called the method of lines and used in the present work, discretizes only the radial coordinate to generate a system of ordinary differential equations integrated in the time coordinate using a Runge-Kutta method or any other equivalent numerical approximation. For discretization in the radial coordinate, in the present work, seldom used compact finite differences (Lele, 1992) were employed. Using a three-point stencil, a fourth-order scheme can be developed with less truncation error when compared to conventional finite differences (Gurarslan, 2010). The parameter estimation, of unknown model parameters, can also be easily performed using a MATLAB® routine.
The adsorbents evaluated in this work were restricted access chromatographic media which consist of agarose-based adsorbents modified with adsorption sites (ion exchange groups or immobilized metal ions) and with grafted PEG as the controlled permeation agent. These adsorbents are able to adsorb small molecules (peptides or proteins) under the presence or large proteins which are prevented from reaching the adsorption sites (Gonzalez-Ortega et al., 2012a, b).
THEORETICAL
Physical model
In this study, the batch protein metal ion binding model in the presence of grafted PEG is based on the isothermal sorption of protein to spherical adsorbent porous particles with an average radius a and a porosity εi. The adsorption process was conducted in a well-stirred tank with a total system volume V. The liquid volume external to the adsorbent matrix is εbV and the adsorbent volume is (1-εb)
V. The initial and the transient solute concentration in the liquid are C0 and C, respectively. The protein concentrations in the fluid and on the internal solid phase of the adsorbent pores are Ci and Qi, respectively.
Protein uptake model
The protein batch adsorption is described by a three-resistance model that includes the transport on the film that surrounds the agarose particles, diffusion inside the particles, and reaction (adsorption) with the adsorption sites, in analogy to previous analyses in the literature (Arve and Liapis, 1987; Horstmann and Chase, 1989; Carlsson et al., 1994; Kempe, 2007). The simplifying assumptions of the model are: (1) the bulk solution in perfectly mixed, (2) uniform adsorbent particle size, (3) symmetry in the θ and ϕ directions, (4) negligible adsorption of protein on the outer surface of the adsorbent particle, (5) the adsorption of protein does not change the adsorbent porosity significantly, (6) isothermal conditions, (7) homogeneous diffusion within the adsorbent pores and the boundary layer, (8) homogeneous adsorption and desorption rate coefficients. The size of the adsorbent is considered as an average size, for the sake of model simplicity; also highly monodisperse agarose beads were used (40±8 µm).
Protein molecular diffusivity was assumed constant since the working protein conditions can still be considered as dilute such that the respective activity coefficient can be set to 1.0, making the molecular diffusivity independent of protein concentration (McBride and Rodgers, 2013).
To describe the change of protein concentration in the bulk liquid outside the adsorbent, a mass balance is applied, leading to Eq. 1, which establishes that the protein concentration in the liquid changes due to transport of the protein in the bulk to the surrounding stagnant film that covers the adsorbent particles and characterized by a film mass transfer coefficient.
(1)
where C is the protein concentration in the bulk liquid (mg/ mL), Ci is the protein concentration in the liquid within the adsorbent pores (mg/mL), R is the radial coordinate (m), t
is the time coordinate (s), a is the adsorbent radius (m), kL
a R i L b
b
k
C
C
a
dt
dC
1
Mathematical modeling of the batch adsorption of proteins on new restricted access
media with poly(ethylene glycol) as a semi-permeable barrier using compact finite differences 239
is the convective mass transfer coefficient (m/s), and εb is the volumetric fraction of liquid in the total system volume (-).
The change of protein in the liquid inside the spherical adsorbent particles is given by the mass balance described in Eq. 2. Here the diffusion within the spherical particle, considering only diffusion in the radial direction and under transient conditions is described and characterized by a constant effective diffusivity, De.
(2)
where Qi is the protein concentration on the adsorbent surface (mg/mL), De is the effective diffusivity of the
protein (m2/s), and ε
i is the volumetric fraction of pores in the adsorbent particle (-). The three-resistance model representation is schematically shown in Fig. 1.
Equilibrium of the adsorption process
The second term on the left hand side of Eq. 2 requires a constitutive equation to describe the adsorption process. Several expressions have been proposed for this equation (Limousin et al., 2007). For the case of protein adsorption, a second-order forward reaction and a first-order backward reaction have been used extensively (Chase, 1984; Arnold et al., 1985; Skidmore et al., 1990), and for this work it appeared to be the most appropriate (Eq. 3).
(3)
where k1 is the adsorption rate constant (mL/mg·s) and k-1
is the desorption rate constant (1/s). At equilibrium, Eq. 3 reduces to the familiar Langmuir isotherm (Eq. 4).
(4)
where qm is the maximum protein capacity (mg/mL), Kd
is the desorption equilibrium constant, *
i
C is the protein
concentration in the liquid at equilibrium (mg/mL), and *
i
Q
is the protein concentration in the adsorbent at equilibrium (mg/mL).
Initial and boundary conditions
In order to evaluate the solution of Eqs. 1-3, initial and boundary conditions need to be incorporated. These are obtained under the following considerations, at the beginning of the experiment the liquid inside the spherical particles and the surface of the adsorbent are free of protein, while the liquid outside the adsorbent contains the selected initial concentration. Thus, the initial conditions are given in Eqs. 5-7.
(5)
(6)
(7)
Considering particle symmetry at the center of the spherical particles the following boundary condition is established and given by Eq. 8.
(8)
A mass balance on the surface of the spherical particles (here, it is assumed that no accumulation occurs or it is negligible) establishes that the mass transfer rate by convection from the bulk fluid to the surface of the particle is equal to the Fickian diffusion mass transfer rate from the surface to the interior of the particle. Thus, the second boundary condition established at the particle surface is given by Eq. 9.
(9)
Dimensionless mathematical model
Introducing the dimensionless variables c = C/C0, ci =
Ci/C0, qi = Qi/qm, r = R/a, and τ = Det/a2 to Eqs. 1 to 3 and 5
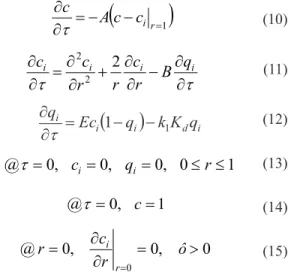
to 9 generates the three-resistance model used in this work (Eq. 10 to 20).
(10) (11) (12) (13) (14) (15)
Figure 1. Schematic of the three resistances considered for protein adsorption. ∂ ∂ + ∂ ∂ = ∂ ∂ − + ∂ ∂ R C R R C D t Q t
C i i
e i i i i i 2 ) 1 ( 2 2 ε ε ε
(
m i)
ii
i kC q Q k Q t
Q
1 1 − − −
= ∂ ∂ * * * i d i m i C K C q Q + = 0 ,
0 C C
t= =
a R C
t=0, i =0, 0≤ ≤
a R Q
t=0, i =0, 0≤ ≤
0 , 0 ,
0 = >
∂ ∂ = t R C R i
(
)
, 0, > ∂ ∂ = − = t R C D C C k a R i e i L
(
− =1)
− = ∂ ∂ r i c c A c
τ
τ
τ
∂ ∂ − ∂ ∂ + ∂ ∂ = ∂∂ i i i B qi
r c r r c c 2 2 2 1 0 , 0 , 0 , 0
@
τ
= ci= qi= ≤r≤1 , 0 @τ = c=
0 , 0 , 0 @ 0 > = ∂ ∂ = = ô r c r r i
i
d i ii Ec q kK q
q
1
1
(16)
where
(17)
(18)
(19)
(20)
MATERIALS AND METHODS
Adsorbents
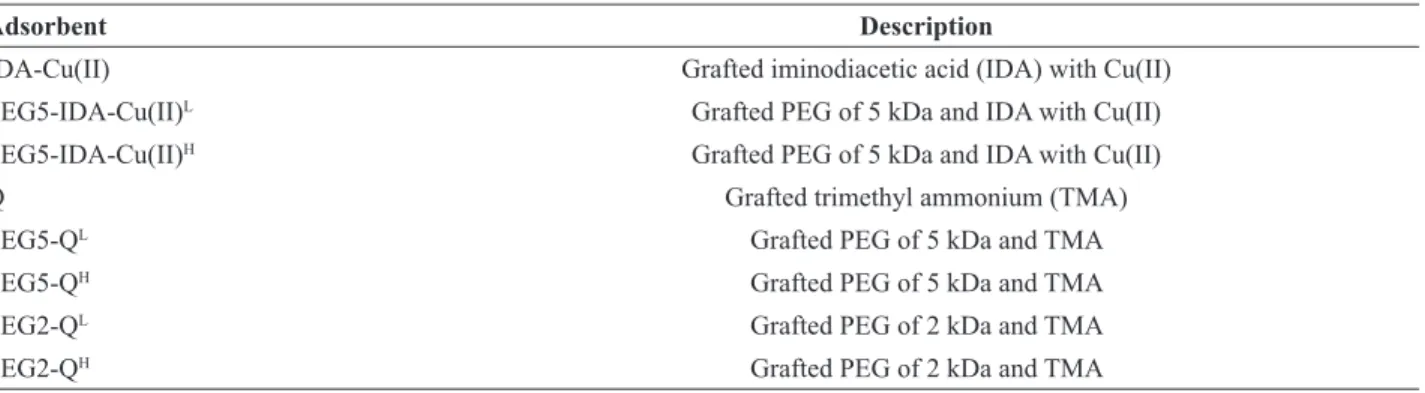
The studied adsorbents were based on agarose beads from Inovata. The bead structure is 9.5% cross-linked agarose with a mean particle size of 40 µm. Two types of adsorbents were prepared following protocols described elsewhere (Gonzalez-Ortega, 2010). The adsorption sites were either ion exchange groups or immobilized metal ions. The adsorbents studied are described in Table 1.
Batch protein adsorption studies
Batch uptake of proteins by the adsorbents studied was performed using 0.05 g of equilibrated gel and 10 mL of a specified protein solution at a given initial concentration. The adsorbents based on immobilized metal ions were previously equilibrated (after saturation with a 20 mM CuSO4 solution) with a buffer consisting of 20 mM phosphate and 0.5 M NaCl (pH 7.0), while the adsorbents based on ion exchange groups were previously equilibrated (after saturation with a 1 M NaCl solution) with a buffer consisting of 50 mM Tris (pH 8.3).
The adsorption of proteins was performed with agitation at 25°C and liquid samples were withdrawn for absorbance measurements at 280 nm to construct uptake characteristic curves. The experimental data was also used to obtain adsorption isotherms once the equilibrium was reached. To determine the protein concentration adsorbed at the surface of the adsorbent at equilibrium, a mass balance given by Eq. 21 was used.
(21)
where Vl is the liquid volume (mL), ρ is the apparent adsorbent density (mg/mL), and m is the wet mass of adsorbent (g).
Model solution and parameter estimation
Eq. 10-12 along with the initial and boundary conditions were simultaneously solved by the method of lines (Davis, 1984). The radial coordinate of the spherical particles was discretized using fourth-order compact finite differences (Lele, 1992). Integration in time of the discretized equations was performed first by the stiff integrator ode15s from MATLAB® and, once the parameters were close to their optimized values, the integrator was switched to ode45
to increase the global accuracy. Parameter estimation (k1 and De) was performed using an unconstrained non-linear optimization with fminsearch from MATLAB®. The numerical solution scheme for integration and parameter estimation in a MATLAB® environment is shown in Fig. 2. fminsearch is based on a direct search method (Nelder-Mead method) looking to minimize Σ(yi-yp)2 where y
i and
yp are the experimental and predicted values for c. For the estimation procedure six batch runs were used for each analyzed adsorbent. Since fminsearch does not evaluate confidence intervals for the estimated parameters, each standard error was computed using [Σ(yi-yp)2/DF∙cov(i,i)]0.5
where DF are the degrees of freedom and cov(i,i) is the i-th element of the covariance matrix that was constructed using second-order finite differences. Finally each confidence interval was calculated using σ = 0.05.
Internal and external porosities, εi and εb, were determined using acetone and blue dextran as tracers according to procedures described elsewhere (Lameloise and Viard, 1994). The parameters, qm and Kd, from the Langmuir isotherms were obtained by non-linear fitting of the experimental equilibrium data. The film mass transfer coefficient, kL, was calculated using the correlation given in Eq. 22 (Calderbank and Moo-Young, 1961; Geankoplis, 1983).
(22)
where DAB is the molecular diffusivity (m2/s), µ
L is the
viscosity of the solution (kg/m∙s), and ρL is the density of the solution (kg/m3). Eq. 22 is generally accepted to predict
the film mass transfer coefficient when using adsorbents with radius smaller than 300 µm.
Implementation of compact finite differences
As previously mentioned, the derivatives in the r-direction were estimated using fourth-order compact finite differences. For this, consider that the adsorbent particle is divided in
N equidistant nodes in the r-direction such that the mesh shown in Fig. 3 is generated. For the sake of simplicity N
, 0Βi 1 ,
1 @
0 m
1
r τ
c c
c r
r i r
i
(
)
e L
b b
D a k A
ε
ε
− =31
(
)
i i m C q B
ε
ε
−
= 1
0
e D
C a k
E 0
2 1
=
(
)
m C C V
Q l i
i
* 0 *=
ρ
−
13 2 3 231 .
0
L L L AB
L L AB
L
g D
a D k
e i
L
D a k
mMathematical modeling of the batch adsorption of proteins on new restricted access
media with poly(ethylene glycol) as a semi-permeable barrier using compact finite differences 241
is set to 7 (for the model solution it was set to 100). From Fig. 3, the protein concentration in the liquid within the pores is represented by c with sub-indices 1 to 7, the concentration of protein in the bulk solution is represented as c8, and the protein concentration in the surface of the adsorbent is represented by c with sub-indices 9 to 15.
To discretize a first derivative Eq. 23 was used, while Eq. 24 was employed for a second derivative. Both represent fourth-order approximations and h represents the distance between nodes.
(23)
(24)
To evaluate a first derivative at positions i = 2 to 6 Eq. 25 can be used, while Eq. 26 can be used to evaluate
a second derivative. Matrices A1 and A2 and vectors E1 and E2 are determined according to the Appendix and these include the effect of boundary conditions (Eqs. 15 and 16).
(25)
(26)
To generate a set of ordinary differential equations (ODEs) at each internal node on the radial mesh; Eq. 11 must be applied. Starting with an example at node i = 2, the next ODE will be generated
(27)
where
c
2'' can be calculated using Eq. 26 as: Table 1. Adsorbents studied. Super-indices L and H stand for low and high PEG grafting density, respectively.Adsorbent Description
IDA-Cu(II) Grafted iminodiacetic acid (IDA) with Cu(II)
PEG5-IDA-Cu(II)L Grafted PEG of 5 kDa and IDA with Cu(II)
PEG5-IDA-Cu(II)H Grafted PEG of 5 kDa and IDA with Cu(II)
Q Grafted trimethyl ammonium (TMA)
PEG5-QL Grafted PEG of 5 kDa and TMA
PEG5-QH Grafted PEG of 5 kDa and TMA
PEG2-QL Grafted PEG of 2 kDa and TMA
PEG2-QH Grafted PEG of 2 kDa and TMA
1 1
' 1 '
'
1 41 43
4 1
i i i i
i c c h c c
c
1 1
2 ''
1 ''
''
1
10
1
5
6
2
10
1
i
i
i
i
ii
c
c
h
c
c
c
c
E
1
A1c
c
'r=
r+
c
8E
2
A2c
c
r''=
r+
c
8
2 10 1 10
' 2 '' 2
2
2
c
B
Ec
1
c
k
K
c
h
c
dt
dc
d
8 6
5 4
3 2
''
2 12.5874c 55.1582c 61.1407c 21.5553c 2.9831c 0.0022c
c (28)
and
c
2' using Eq. 258 6
5 4
3 2
'
2
7
.
968
c
11
.
42
c
4
.
2752
c
0
.
8759
c
0
.
0577
c
0
.
005
c
c
(29)
A similar procedure will generate ODEs for nodes 3 to 6. At node i = 8, from Eq. 10:
(30)
For node i = 9:
(31)
Equations similar to Eq. 31 will be obtained at nodes 10 to 15.
RESULTS AND DISCUSSION
Adsorption isotherms for adsorbents with immobilized metal ions
The adsorption of proteins was evaluated with the systems IDA-Cu(II) (as control adsorbent), PEG5-IDA-Cu(II)L (low polymer grafting density), and
PEG5-IDA-Cu(II)H (high polymer grafting density). The model
proteins were insulin (INS), ribonuclease A (RNAse A), and bovine serum albumin (BSA), since these are known to have affinity towards immobilized Cu(II) ions with IDA
8 7
8 Ac c
dt dc
9
1 91
9 Ec 1 c kK c
dt dc
d
E1
as chelating agent. BSA contains 2-3 histidyl residues on its surface that could interact with immobilized Cu(II) ions, through coordination bonds; also its His 3 residue located at the N-terminus has been recognized as the site for Cu(II) binding (Sulkowski, 1985; Peters and Blumenstock, 1967). RNAse A contains 3 histidyl residues on its surface with Cu(II) chelating properties at positions 12, 105, and 109 (Sulkowski, 1985). INS contains 2 histidyl residues (His 5 and His 10) that could interact with immobilized Cu(II) ions (Farinas et al., 2003).
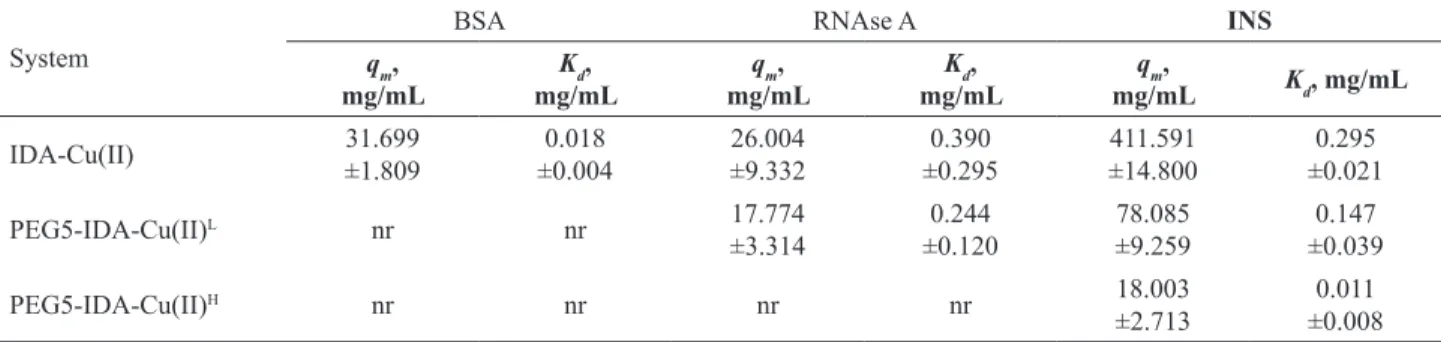
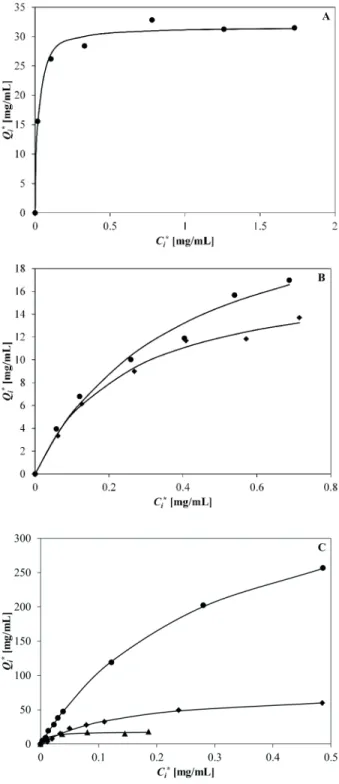
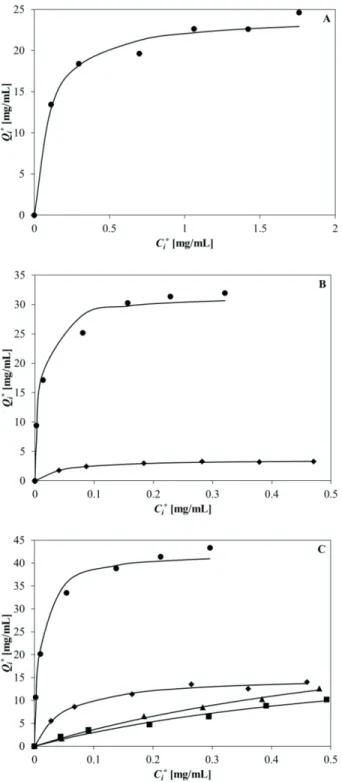
Fig. 4 shows the isotherms for the studied adsorbents describing the equilibrium adsorption of the three model proteins used in this study. The thermodynamic parameters obtained with experimental and theoretical analyses and the maximum protein capacities and dissociation constants for each case are summarized in Table 2. Fig. 4A describes
the adsorption isotherm for BSA with the control chelating adsorbent IDA-Cu(II) where a high affinity between BSA molecules and immobilized Cu(II) ions is evident at low protein equilibrium liquid concentrations. The BSA adsorption isotherms for the adsorbents with grafted PEG were not determined since the adsorption process was forbidden.
Fig. 4B and Fig. 4C describe the adsorption isotherms for RNAse A and INS, respectively. For both proteins favorable behavior for protein adsorption is clearly observed using IDA-Cu(II). The almost linear behavior obtained for INS reveals a high protein capacity for this adsorbent. Fig. 4B also shows the isotherm obtained for RNAse A adsorption on the hybrid system PEG5-IDA-Cu(II)L; where the presence of a low PEG grafting
density reduces the maximum RNAse A capacity by 32% (compared to the system IDA-Cu(II)). RNAse A isotherm with the hybrid system PEG5-IDA-Cu(II)H was not
determined since the high PEG grafting density completely eliminated protein adsorption. Fig. 4C also shows the INS isotherms for the systems PEG5-IDA-Cu(II)L and
PEG5-IDA-Cu(II)H, where it is evident that protein adsorption is
fundamentally affected by the presence of grafted PEG; however, adsorption of INS continues to occur even at a high PEG grafting density.
Adsorption isotherms for adsorbents with ion exchange groups
Protein adsorption isotherms were evaluated with the systems Q (as a control adsorbent), PEG5-QL (high
molecular weight polymer, low polymer grafting density), PEG2-QL (low molecular weight polymer, low polymer
grafting density), PEG5-QH (high molecular weight
polymer, high polymer grafting density), and PEG2-QH
(low molecular weight polymer, high polymer grafting density). The model proteins were BSA, α-lactalbumin (LAC), and INS, since these were expected to interact with the TMA groups on the adsorbents.
Fig. 5 shows adsorption isotherms for BSA, LAC and INS for the ion exchange adsorbents. These three proteins are negatively charged under the adsorption conditions and, thus, they are retained by the system Q that contains only anion exchange groups (the quaternary ammonium
Figure 2. Scheme for model solution and parameter estimation.
Figure 3. Example of the mesh for discretization in the r-direction for N = 7.
Table 2. Equilibrium parameters for the proteins studied on adsorbents with immobilized metal ions.
System
BSA RNAse A INS
qm, mg/mL
Kd, mg/mL
qm, mg/mL
Kd, mg/mL
qm,
mg/mL Kd, mg/mL
IDA-Cu(II) 31.699
±1.809
0.018 ±0.004
26.004 ±9.332
0.390 ±0.295
411.591 ±14.800
0.295 ±0.021
PEG5-IDA-Cu(II)L nr nr 17.774
±3.314
0.244 ±0.120
78.085 ±9.259
0.147 ±0.039
PEG5-IDA-Cu(II)H nr nr nr nr 18.003
±2.713
Mathematical modeling of the batch adsorption of proteins on new restricted access
media with poly(ethylene glycol) as a semi-permeable barrier using compact fi nite diff erences 243
Figure 4. Adsorption isotherms for adsorbents with immobilized
metal ions. (A) BSA, (B) RNAse A, (C) INS. (●) IDA-Cu(II), (♦)
PEG5-IDA-Cu(II)L, (▲) PEG5-IDA-Cu(II)H.
ions) independent of their molecular weights. At pH 8.3, the amino acids glutamic and aspartic acid are fully deprotonated and, thus, will contribute to the retention of proteins by ion exchange. The proteins studied are retained on the ion exchangers due to the large number of glutamic and aspartic acid residues on their surface (their isoelectric points are below 7.0).
Fig. 5A describes the adsorption isotherm for BSA with the control IEX adsorbent Q where a high electrostatic interaction between the TMA groups and the acid residues from the protein is evident at low protein liquid concentrations at equilibrium. Experiments using the hydrid IEX adsorbents PEG5-QL and PEG2-QL were
performed, but the presence of grafted PEG prevented the interaction of the TMA groups with BSA molecules; thus, an adsorption isotherm could not be determined. A similar situation was obtained when working with systems PEG5-QH and PEG2-QH. Fig. 5B shows the adsorption isotherms
for the adsorbents Q and PEG5-QL using LAC. Again
when working with the IEX adsorbent Q, LAC molecules strongly interact with the ion exchange groups on the adsorbent surface with the subsequent LAC adsorption even at low protein concentration. When PEG is present in the adsorbent (PEG5-QL), LAC continues to adsorb on
the hybrid adsorbent, but maximum protein capacity is almost reduced by 90% when compared with the plain IEX adsorbent Q. When working with the hybrid adsorbents PEG5-QH, PEG2-QL, and PEG2-QH; LAC adsorption was
almost inexistent and the adsorption isotherms were not determined. Fig. 5C presents adsorption isotherms for INS on the four studied adsorbents. In general the presence of grafted PEG, irrespective of its size or density, reduced the ability of the INS molecules to interact with the TMA groups at equilibrium conditions reducing the maximum protein capacity while increasing the dissociation constant. Despite this, INS continues to adsorb even at a high PEG grafting density only when PEG with a molecular weight of 5 kDa is used. Complete rejection of all studied proteins was obtained with the system PEG2-QH. The
thermodynamic parameters obtained with experimental and theoretical analyses are summarized in Table 3, where the maximum protein capacities are given for proteins on adsorbents lacking PEG moieties.
Kinetic studies using adsorbents with immobilized metal ions
BSA kinetics of adsorption
The results for the batch adsorption kinetics of BSA on the adsorbents with immobilized ions are shown in Fig. 6. Fig. 6 compares the behavior of BSA uptake on the plain chelating adsorbent IDA-Cu(II) with the hybrid PEG5-IDA-Cu(II)L, the low PEG grafting density adsorbent. It
is quite evident that the bulk protein concentration drops consistently on the chelating resin, without grafted PEG. Several other initial bulk protein concentrations were tested with similar results (data not shown). These results show very clearly how the protein (BSA) uptake dramatically decreases (no change in the bulk concentration) in the presence of grafted PEG on the hybrid agarose adsorbents.
Figure 5. Adsorption isotherms for adsorbents with ion exchange
groups. (A) BSA, (B) LAC, (C) INS. (●) Q, (♦) PEG5-QL, (▲)
PEG2-QL, (■) PEG5-QH.
estimation. For the system IDA-Cu(II), an average eff ective diff usivity (De) of 2.01±0.14×10⁻¹¹ m2/s was
determined, while the adsorption rate constant (k1) provided an average value of 0.72±0.05×10⁻³ mL/mgs.
Membrez et al. (1996) experimentally found an eff ective diff usivity of 2.2×10⁻¹¹ m2/s for HSA (human serum
albumin) adsorption on similar agarose gels (Sepharose
CL-6B). The molecular diff usivity of BSA at 25 ˚C has been reported with a value of 5.94×10⁻¹¹ m2/s
(Tyn and Gusek, 1990) indicating that the agarose matrix in fact aff ects protein diff usion considerably. Table 4 shows values of the forward rate constant for BSA and HSA adsorption on several chromatographic systems. Despite the diff erence in these adsorption systems, the forward rate constant obtained in this work is comparable to values reported in the literature and presented in Table 4.
RNAse A kinetics of adsorption
Fig. 7 shows the results and comparison for the batch adsorption of RNAse A on the chelating and hybrid systems. Fig. 7 compares the behavior of RNAse A uptake on the plain chelating adsorbent IDA-Cu(II), the hybrid PEG5-IDA-Cu(II)L with low PEG grafting density, and the
hybrid PEG5-IDA-Cu(II)H with high PEG grafting density
for a selected initial RNAse A concentration. Several other initial concentrations were tested with similar results (data not shown). The presence of grafted PEG clearly aff ects the adsorption kinetics, reducing the equilibrium protein concentration on the adsorbent. At higher PEG grafting density, as clearly seen in Fig. 7, RNAse A was almost entirely excluded from the immobilized Cu(II) ions and the protein uptake was almost insignifi cant.
Again, as in the case with BSA adsorption, the continuous lines in Fig. 7 describe the solution of the model (Eq. 10-12) after parameter estimation. For the plain chelating gel system, Nov-IDA-Cu(II), an average eff ective diff usivity (De) of 6.93±1.02×10⁻¹¹ m2/s was obtained while
the adsorption rate constant (k1) was determined with an average value of 3.32±0.39×10⁻³ mL/mgs. For the case of
the hybrid system PEG5-IDA-Cu(II)L, average values of
4.91×10⁻¹¹±0.14 m2/s and 1.70±0.10×10⁻³ mL/mgs were
estimated for the eff ective diff usivity and the adsorption rate constant; respectively. The molecular diff usivity of RNAse A at 25 ˚C has been reported in the literature with a value of 1.21×10⁻¹⁰ m2/s (Creeth, 1958) and, as expected,
the eff ective diff usivities obtained in the present work are lower than this reported value. The eff ect of the presence of grafted PEG on the adsorption of RNAse A is to reduce both the average value of its eff ective diff usivity and its adsorption rate constant (an almost 50% decrease).
INS kinetics of adsorption
Mathematical modeling of the batch adsorption of proteins on new restricted access
media with poly(ethylene glycol) as a semi-permeable barrier using compact finite differences 245
Table 3. Equilibrium parameters for BSA, LAC, and INS on adsorbents with ion exchange groups.
System BSA LAC INS
qm, mg/mL Kd, mg/mL qm, mg/mL Kd, mg/mL qm, mg/mL Kd, mg/mL
Q 24.202±2.494 0.098±0.058 31.562±4.616 0.010±0.008 42.332±4.692 0.010±0.007
PEG5-QL nr nr 3.628±0.221 0.043±0.012 15.230±1.596 0.052±0.023
PEG5-QH nr nr nr nr 23.942±8.202 0.693±0.282
PEG2-QL nr nr nr nr 33.021±13.696 0.808±0.482
PEG2-QH nr nr nr nr nr nr
nr: not reported since adsorption was negligible
Figure 6. BSA adsorption kinetics using adsorbents with immobilized metal ions. Open symbols for PEG5-IDA-Cu(II)L and closed symbols
for IDA-Cu(II).
Table 4. Adsorption rate constants for albumin on different chromatographic media.
Adsorbent Interaction Protein k1, 10-3 mL/mg⋅s Reference
Sepharose CL-6B Dye-Ligand BSA 1.2 Chase (1984)
Sepharose CL-4B Dye-Ligand BSA 3.37-6.12 Arnold and Blanch (1986)
Superose CL-6B Dye-Ligand BSA 1.45-1.97 Arnold and Blanch (1986)
Sepharose CL-6B Dye-Ligand BSA 0.10-1.58 Boyer and Hsu (1992)
DEAE Cellulose Anion exchange BSA 0.3-0.9 Lopez et al. (1997)
Agarose CL 6% Dye-Ligand BSA 0.9-2.68 Noriega et al. (1997)
DEAE Sepharose Anion exchange HSA 0.49 Aboudzadeh et al. (2006)
IDA-Cu(II) Chelation BSA 0.72±0.05 This work
Q Anion exchange BSA
0.08±0.007-0.88±0.058 This work
immobilized Cu(II) ions although to different extents, however, inversely proportional to the PEG grafting density.
In Fig. 8 the solution of the mathematical model (Eq. 10-12) after parameter estimation, similarly to the previous cases with BSA and RNAse A, is given by the continuous lines. For INS with the system IDA-Cu(II), an average effective diffusivity (De) value of 1.333±0.071×10⁻¹⁰ m2/s
was determined, whereas the adsorption rate constant (k1) varied from 0.16 to 0.27±0.02 mL/mgs, showing a slight dependence on the INS initial liquid concentration. For the case of the hybrid systems with grafted PEG, the effective diffusivity changed only slightly between 1.410±0.064×10⁻¹⁰
m2/s and 1.328±0.057×10⁻¹⁰ m2/s for the low and high PEG
grafting density, respectively. In the literature, the molecular diffusivity of INS has been reported as 1.63×10⁻¹⁰ m2/s (Sober
et al., 1968) and it appears to be only slightly different; however, no significant changes appear to be associated with the diffusion of the protein with or without grafted PEG. These practically constant values imply that, due to its relatively small size and for the working PEG densities, the permeation effect is negligible in diminishing its diffusion and consequent effective transport to the surface of the adsorbent.
The most significant change observed in the systems for INS adsorption was in the values obtained for the adsorption rate constants for the plain chelating adsorbent and hybrid PEG grafted systems. The adsorption rate constants, in the case of the hybrid systems, were determined with values
Kinetic studies using adsorbents with ion exchange groups
BSA kinetics of adsorption
Fig. 9 shows batch adsorption kinetics for BSA on IEX systems for different initial protein concentrations. In Fig. 9 a comparison is made between BSA uptake by the plain adsorbent Q (solid symbols) and the adsorbent with grafted PEG named PEG5-QL (open symbols). For the former a
reduction in protein concentration in the liquid is present for all initial protein concentrations, while the latter had no appreciable reduction. Thus, the presence of grafted PEG, even at a low PEG grafting density, completely rejected BSA, forbidding the interaction with the ion exchange adsorption sites. Thus, BSA maximum capacity is reduced from 24.202 mg/mL for the system Q to a level of adsorption that is negligible under the current experimental conditions for the hybrid system PEG5-QL. The large size of BSA,
compared to the size of grafted PEG, favors its rejection from the polymer volume as described elsewhere (Abbott et al., 1991). The systems PEG2-QL, PEG2-QH, and
PEG5-QH were also tested to determine adsorption kinetics, but
the results (data not shown) were comparable to the system PEG5-QL.
The continuous line in Fig. 5 represents the solution of the three-resistance model (Eq. 10-12) after parameter estimation. The effective diffusivity (De) for BSA was estimated to have an average value of 2.13±0.24×10⁻¹¹
m2/s while the adsorption rate constant (k
1) varies from
0.8±0.07×10⁻⁴ to 8.8±0.58×10⁻⁴ mL/mgs, increasing as
the initial liquid concentration of protein decreases. Table 4 shows values of the forward rate constant for BSA and HSA (human serum albumin) adsorption on several chromatographic systems.
LAC kinetics of adsorption
The results from batch uptake of LAC using the IEX systems, with and without grafted PEG, are presented in Fig. 10 for a selected initial protein concentration (other LAC initial concentrations were tested with similar results, data not shown). Fig. 10 shows the adsorption kinetics for the plain system Q, where it is clear that the bulk protein concentration is significantly reduced for the selected initial protein concentration. The same Fig. 10 presents the batch uptake results using the hybrid gel PEG5-QL
(having a low grafting PEG density), where the presence of grafting PEG is clearly reducing the amount of protein that was bound by the hybrid gel. Fig. 10 also shows the results using the high grafting PEG density gel (PEG5-QH), where
it is clear that the presence of grafted PEG inhibits, almost completely, the adsorption of LAC under the studied experimental conditions. Experiments performed with the systems PEG2-QL and PEG2-QH gave similar results (data
not shown) to the system PEG5-QH.
The continuous lines in Figure 10 represent the solution of the model (Eq. 10-12) after parameter estimation. The major
dimension of LAC is lower than the size of the PEG (5 kDa) and thus the protein is being somewhat retained by the single PEG modified IEX system, but an increase in PEG density “completely” rejects the protein from the adsorption sites. This somehow indicates that the polymer volume is not being penetrated by the protein and that adsorption in the single modified system could occur on areas of the adsorbent that have a local low PEG grafting density. For the case of the grafted PEG molecule with a molecular weight of 2 kDa, the major dimension of the LAC molecule is now larger and the polymer volume is not being penetrated by the protein with the subsequent result of no appreciable adsorption.
The estimated average effective diffusivities (De) were 0.95±0.07×10⁻¹⁰ m2/s and 0.84±0.04×10⁻¹⁰ m2/s for the systems
Q and PEG5-QL, respectively. The molecular diffusivity
for LAC is reported in the literature as 1.06×10⁻¹⁰ m2/s
Figure 7. RNAse A adsorption kinetics using adsorbents with
immobilized metal ions. (●) PEG5-IDA-Cu(II)H, (♦)
PEG5-IDA-Cu(II)L, (▲) IDA-Cu(II).
Figure 8. INS adsorption kinetics using adsorbents with immobilized
metal ions. (●) PEG5-IDA-Cu(II)H, (♦) PEG5-IDA-Cu(II)L, (▲)
Mathematical modeling of the batch adsorption of proteins on new restricted access
media with poly(ethylene glycol) as a semi-permeable barrier using compact finite differences 247
(Tyn and Gusek, 1990) and it is slightly reduced by the agarose matrix (which is highly porous) and the grafted PEG. The adsorption rate constant (k1) was reduced by one order of magnitude (from an average value of 0.0632±0.0102 to 0.0076±0.0018 mL/mg·s) due to the presence of grafted PEG and did not show a dependence on the initial LAC liquid concentration.
INS kinetics of adsorption
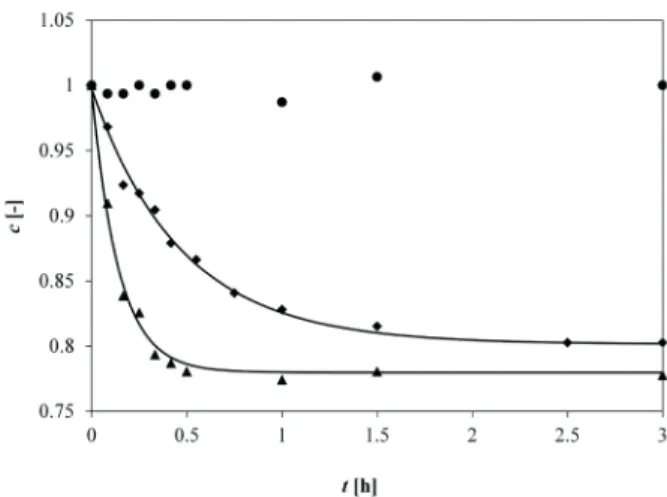
The adsorption kinetics of INS on IEX systems for the same initial protein concentration are shown in Fig. 11. Other initial INS concentrations were also tested with similar results (data not shown). For the plain system Q, it is clear that a significant reduction of bulk protein concentration was obtained due to adsorption by the ion exchange sites. Fig. 11 shows how the presence of grafted PEG reduces the adsorption of INS on hybrid IEX-PEG gels irrespective of grafting density or PEG molecular weight.
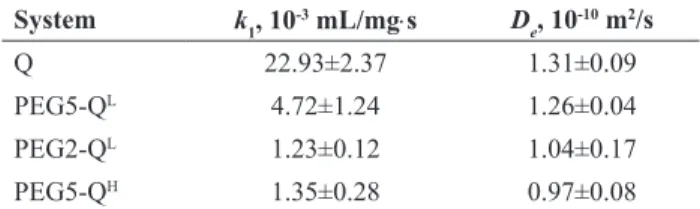
The continuous lines in Fig. 11 represent the solution of the model (Eq. 10-12) after parameter estimation. The estimated parameters for all prepared adsorbents are shown in Table 5.
In the literature, the molecular diffusivity of INS seems to be only slightly reduced on the adsorbent systems (with or without grafted PEG), which could be associated with the small size of the INS. The most significant change in the systems with INS adsorption was in the values obtained for the adsorption rate constant for the plain and PEG grafted gels. When compared with the value obtained for the plain adsorbent Q, the systems having grafted PEG presented values with a decrease of one order of magnitude. This result suggests that, although the PEG does not restrict the transport of the protein to the adsorption sites, the PEG molecule significantly affects the effective interaction between the protein and the TMA groups.
Error analyses
Two error analyses were performed to determine the order of convergence (OC). Since both the discretization in the r-direction and the integration in time used fourth-order approximation schemes, the error analyses should predict an order of convergence around four. The first error analysis was conducted calculating the relative error (RE) between the numerical solution (obtained with different values of h) and a numerical solution for N = 500 (considered as an analytical solution) for ci at r = 1 using different grid sizes. r = 1 was selected since larger concentration gradients are present at the pore entrance. Table 6 shows the results of this analysis; the order of convergence was calculated with Eq. 32.
(32)
where RE1 and RE2 are the absolute errors corresponding to grid sizes h1 and h2. For the second error analysis the protein
adsorption kinetics were considered. Eq. 32 was still used to calculate the order of convergence using the summation of the relative errors. Table 6 also shows the results of the second error analysis corroborating the use of fourth-order schemes.
Figure 9. BSA adsorption kinetics using adsorbents with ion exchange groups. Open symbols for PEG5-QL and closed symbols
for Q.
Figure 10. LAC adsorption kinetics using adsorbents with ion
exchange groups. (●) PEG5-QH, (♦) PEG5-QL, (▲) Q.
Figure 11. INS adsorption kinetics using adsorbents with ion
exchange groups. (●) PEG5-QH, ((■) PEG2-QL, (♦) PEG5-QL, (▲) Q.
2 1
1 2log
RE
RE
log
OC
h
h
CONCLUSIONS
A three-resistance model was used to successfully describe the batch adsorption of proteins using regular adsorbents (plain IDA-Cu(II) and Q) and hybrid adsorbents bearing grafted PEG recognized as restricted access media. The effective diffusivity and the adsorption rate constant as parameters of the model were sufficient to describe the adsorption kinetics of several proteins with molecular weights in the range 5.8-67.0 kDa. The model allowed discriminating the controlling process behind the restricted access condition created by the grafted PEG molecules, which is associated with the interaction between the protein molecule and the adsorption site that reduces or inhibits the adsorption process. Thus, the model predicts a reduction in the adsorption rate constant that is even noticeable for small molecular weight grafted PEG or a high PEG grafting density. The use of compact finite differences allowed obtaining a highly accurate solution using a three-point stencil that accelerates the solution and the total time for the computation of the parameters being optimized.
NOMENCLATURE
a - Radius of adsorbent particle, m
c - Dimensionless protein concentration in the bulk liquid
C - Protein concentration in the bulk liquid, mg/mL
ci - Dimensionless protein concentration in the liquid within the pores
Ci - Protein concentration in the liquid within the pores, mg/mL
Ci* - Protein concentration in the liquid within the pores at equilibrium, mg/mL
C0 - Initial protein concentration in the bulk liquid, mg/mL
De - Effective protein diffusivity, m2/s
kL - Convective mass transfer coefficient, m/s k1 - Adsorption rate constant, mL/mg·s
k-1 - Desorption rate constant, 1/s
Kd - Desorption equilibrium constant, mg/mL
qi - Dimensionless protein concentration on the adsorbent
qm - Maximum protein capacity, mg/mL
Qi - Protein concentration on the adsorbent, mg/mL
Qi* - Protein concentration on the adsorbent at equilibrium, mg/mL
r - Dimensionless radial coordinate -
R - Radial coordinate, m Bim - Mass transfer Biot number
t - Time coordinate, s
V - Total system volume, m3
Greek letters
εb - Volumetric fraction of liquid in the total system volume
εi - Volumetric fraction of pores in the adsorbent particle τ - Dimensionless time coordinate
REFERENCES
Abbott, N.L., Blankschtein, D. and Hatton, T.A. Protein Partitioning in Two-Phase Aqueous Polymer Systems. 1. Novel Physical Pictures and a Scaling-Thermodynamic Formulation. Macromolecules, 24, 4334 (1991).
Arnold, F.H., Blanch, H.W. and Wilke, C.R., Analysis of Affinity Separations I: Predicting the Performance of Affinity Adsorbers, The Chemical Engineering Journal, 30, B9 (1985). Arve, B.H. and Liapis, A.I., Modeling and Analysis of Biospecific
Adsorption in a Finite Bath, AIChE Journal, 33, 179 (1987). Calderbank, P.H. and Moo-Young, M.B., The Continuous Phase
Heat and Mass-Transfer Properties of Dispersions, Chemical Engineering science, 16, 39 (1961).
Carlsson, F., Axelsson, A. and Zacchi, G., Mathematical Modelling and Parametric Studies of Affinity Chromatography, Computers & Chemical Engineering, 18, S657 (1994).
Chase, H.A., Prediction of the Performance of Preparative Affinity Chromatography, Journal of Chromatography, 297, 179 (1984).
Creeth, J.M., Studies of Free Diffusion in Liquids with the Rayleigh Method. III. The Analysis of Known Mixtures and Some Preliminary Investigations with Proteins, Journal of Physical Chemistry, 62, 66 (1958).
Davis, M.E., Numerical Methods and Modeling for Chemical Engineers. John Wiley & Sons, New York (1984).
Farinas C.S., Bueno, S.M.A. and Miranda, E.A., Adsorption of Glucagon and Insulin on an Immobilized Metal Ion Affinity Chromatography Silica Matrix, Adsorption Science & Technology, 21, 883 (2003).
Geankoplis, C.J., Transport Processes and Unit Operations. Allyn & Bacon, New York, (1983).
Gonzalez-Ortega, O., Study and Characterization of Dual-Function Affinity Chromatographic Adsorbents Having Size Exclusion and Adsorption Properties to Isolate, Purify and Recover Small Biomolecules from Complex Biological Mixtures. Ph.D. Thesis, The University of Arizona (2010). Table 5. Optimized parameters for INS adsorption kinetics on
adsorbents with ion exchange groups.
System k1, 10-3 mL/mg⋅s D
e, 10
-10 m2/s
Q 22.93±2.37 1.31±0.09
PEG5-QL 4.72±1.24 1.26±0.04
PEG2-QL 1.23±0.12 1.04±0.17
PEG5-QH 1.35±0.28 0.97±0.08
Table 6. Error analyses to determine the order of convergence.
N h First analysis Second analysis
RE OC RE OC
7 0.167 2.59×10⁻⁵ - 7.90×10⁻⁴
-9 0.125 8.28×10⁻⁶ 3.96 2.57×10⁻⁴ 3.91
11 0.100 3.12×10⁻⁶ 4.37 1.10×10⁻⁴ 3.79
Mathematical modeling of the batch adsorption of proteins on new restricted access
media with poly(ethylene glycol) as a semi-permeable barrier using compact finite differences 249
González-Ortega, O., Porath, J. and Guzmán, R., Adsorption of Peptides and Small Proteins with Control Access Polymer Permeation to Affinity Binding Sites. Part I: Polymer Permeation-Immobilized Metal Ion Affinity Chromatography Separation Adsorbents with Polyethylene Glycol and Immobilized Metal Ions, Journal of Chromatography A, 1227, 115 (2012a).
González-Ortega, O., Porath, J. and Guzmán, R., Adsorption of Peptides and Small Proteins with Control Access Polymer Permeation to Affinity Binding Sites. Part II: Polymer Permeation-Ion Exchange Separation Adsorbents with Polyethylene Glycol and Strong Anion Exchange Groups, Journal of Chromatography A, 1227, 126 (2012b).
Gurarslan, G., Numerical Modelling of Linear and Nonlinear Diffusion Equations by Compact Finite Difference Method, Applied Mathematics and Computation, 216, 2472 (2010).
Gutierrez, R., Del Valle, E.M.M. and Galan, M.A., Characterization of Mass Transport Processes in IMAC Chromatography by Dynamics Methods, Biochemical Engineering Journal, 35, 264 (2007).
Horstmann, B.J. and Chase, H.A., Modeling the Affinity Adsorption of Immunoglobulin G to Protein A Immobilised to Agarose Matrices, Chemical Engineering Research & Design, 67, 243 (1989).
Kempe, H., Modeling and Experimental Determination of Chromatographic Parameters by Frontal Chromatography. Ph.D. Thesis, Stockholm University (2007).
Lameloise, M.L. and Viard, V., Choice of a Tracer for External Porosity Measurement in Ion-Exchange Resin Beds, Journal of Chromatography A, 679, 255 (1994).
Lele, S.K., Compact Finite Difference Schemes with Spectral-like Resolution, Journal of Computational Physics, 103, 16 (1992).
Membrez, J., Infelta, P.P. and Renken, A., Use of the Laplace Transform Technique for Simple Kinetic Parameters Evaluation. Application to the Adsorption of a Protein on Porous Beads, Chemical Engineering Science, 51, 4489 (1996).
Limousin, G., Gaudet, J.P., Charlet, L., Szenknect, S., Barthes, V. and Krimissa, M., Sorption Isotherms: A Review on Physical Bases, Modeling and Measurement, Applied Geochemistry, 22, 249 (2007).
McBride, D.W. and Rodgers, V.G., Predicting the Activity Coefficients of Free-Solvent for Concentrated Globular Protein Solutions Using Independently Determined Physical Parameters, PloS one, 8, e81933 (2013).
Peters, T. and Blumenstock, F.A., Copper-Binding Properties of Bovine Serum Albumin and its Amino-Terminal Peptide Fragment, The Journal of Biological Chemistry, 242, 1574 (1967).
Sharma, S. and Agarwal, G.P., Adsorption Equilibrium and Kinetics of Egg-White Proteins on Immobilized Metal Ion Affinity Gels for Designing Fractionation, Adsorption, 8, 203 (2002).
Skidmore, G.L., Horstmann, B.J. and Chase, H.A., Modeling Single-Component Protein Adsorption to the Cation Exchanger S Sepharose FF, Journal of Chromatography, 498, 113 (1990).
Sober, H.A., Harte, R.A. and Sober, E.K., Handbook of Biochemistry: Selected Data for Molecular Biology. CRC Press, Ohio (1968).
Sulkowski, E. (1985). Purification of proteins by IMAC. Trends in Biotechnology. 3: 1-7.
Brazilian Journal of Chemical Engineering
0
12
3
16
36
48
25
1 2 3 4 5'
1
h
c
c
c
c
c
c
(S.1)
8 7
m 7 6 5 4 3 '
7 3c 16c 3612ch 48c 25c Bi c c
c
(S.2) Solving for c1 and c7:
25
3
16
36
48
2 3 4 51
c
c
c
c
c
(S.3)
m
6 5 4 3 8 m
7 12hBi c 253c 1216hcBi 36c 48c c
(S.4)
For node i = 2, applying Eq. 22:
3 1
' 3 ' 2 '
1
1
4
4
3
4
1
c
c
h
c
c
c
(S.5)
Substituting Eq. S.1 and S.3 into Eq. S.5:
5 4
3 2
' 3 '
2
4
1
c
100
144
h
c
100
183
h
c
100
48
h
c
100
9
h
c
c
(S.6) For node i = 3, applying Eq. 22:
4 2
' 4 ' 3 '
2
4
1
4
3
4
1
c
c
h
c
c
c
(S.7)
Similar equations will be obtained for nodes 4 and 5. For node i = 6, applying Eq. 22:
7 5
' 7 ' 6 '
5
4
1
4
3
4
1
c
c
h
c
c
c
(S.8)
Substituting Eq. S.2 and S.4
8 m
6 5
4 3
' 6 '
5 4c 3hFc 16hFc 3 h36F c 48hFc Bi 12F 1c
c
(S.9) where
h h F
12 Bi
25 Bi 3
1 m
1 m
(S.10)
In matrix notation we can write
8
'
c
r
r
(S.11)Appendix
Mathematical modeling of the batch adsorption of proteins on new restricted access
media with poly(ethylene glycol) as a semi-permeable barrier using compact finite differences 251
0
12
3
16
36
48
25
1 2 3 4 5' 1
h
c
c
c
c
c
c
(S.1)
8 7
m 7 6 5 4 3 '
7 3c 16c 3612ch 48c 25c Bi c c
c
(S.2) Solving for c1 and c7:
25
3
16
36
48
2 3 4 51
c
c
c
c
c
(S.3) m 6 5 4 3 8 m
7 12hBi c 253c 1216hcBi 36c 48c c (S.4)
For node i = 2, applying Eq. 22:
3 1
' 3 ' 2 '
1
1
4
4
3
4
1
c
c
h
c
c
c
(S.5)
Substituting Eq. S.1 and S.3 into Eq. S.5:
5 4 3 2 ' 3 '
2
4
1
c
100
144
h
c
100
183
h
c
100
48
h
c
100
9
h
c
c
(S.6) For node i = 3, applying Eq. 22:
4 2
' 4 ' 3 '
2
4
1
4
3
4
1
c
c
h
c
c
c
(S.7)
Similar equations will be obtained for nodes 4 and 5. For node i = 6, applying Eq. 22:
7 5
' 7 ' 6 '
5
4
1
4
3
4
1
c
c
h
c
c
c
(S.8)
Substituting Eq. S.2 and S.4
8 m 6 5 4 3 ' 6 '5 4c 3hFc 16hFc 3 h36F c 48hFc Bi 12F 1c
c
(S.9) where h h F 12 Bi 25 Bi 3 1 m 1 m (S.10)
In matrix notation we can write
e
Bc
Ac
8 'c
rr
(S.11)where
4
1
0
0
0
4
1
1
4
1
0
0
0
4
1
1
4
1
0
0
0
4
1
1
4
1
0
0
0
4
1
1
A
,
1 12 Bi 0 0 0 0 m F e ,
' 6 ' 5 ' 4 ' 3 ' 2 'c
c
c
c
c
rc
,
6 5 4 3 2c
c
c
c
c
rc
F
F
F
F
h
48
36
3
16
3
0
4
3
0
4
3
0
0
0
4
3
0
4
3
0
0
0
4
3
0
4
3
0
100
9
100
48
100
183
100
144
1
B
,Multiplying Eq. S.11 by the inverse matrix of A allows solving for vector
c
'rE1
A1c
e
A
Bc
A
c
8 1 8 1'
c
c
r r
r
(S.12)where (for Bim = 31.25 as example):