Dynamic Properties of High Volume Fly Ash Nanosilica HVFANS
Concrete Subjected to Combined Effect of High Strain Rate and
Temperature
Abstract
The study aims to determine the dynamic properties of high volume fly ash nanosilica HVFANS concrete exposed to strain rates between 30.12 to 101.42 s‐1 and temperatures of 25, 400, and 700 oC by using split Hopkinson pressure bar SHPB machine. The static and dynamic compressive strengths of HVFANS concrete were slightly lower than plain concrete PC at room temperature, while its values were higher at 400 and 700 oC. The results proved that the CEB model of dynamic increase factor is more reliable to estimate the behaviour of HVFANS concrete at studied temperatures. The toughness, critical strain, and damage of HVFANS concrete recorded a superior performance than PC under studied strain rates and temperatures that would reflect the possibility of use HVFANS concrete in structures to improve its resistant of fire and impact loads, as well as to decrease the demand on Portland cement which could lead to restrict the risks of liberated gases during cement production. Furthermore, equations were proposed to estimate the dynamic increase factor, toughness, and critical strain of both concretes under investigated conditions.
Keywords
HVFA concrete; Nanosilica; DIF; SHPB; toughness; critical damage.
1. INTRODUCTION
Since early decades of 20th century, numerous studies were conducted to assess the concrete properties under elevated temperature to ensure the safety of engineering structures 1‐3 . The extensive use of high strength concrete HSC in modern construction motivated several scholars to study its thermal properties. The results were contradictory and indicated that the strength of HSC might deteriorate a higher or lesser than normal strength concrete NSC at elevated temperature 4‐7 . Recently, several alternatives binders were widely used in HSC as a partial cement replacement to reduce the risks of CO2 emissions liberated during cement production 8 .
Fly ash FA was broadly utilized as a Portland cement replacement owing to it’s a great performance in concrete and low price. FA is a by‐product of the pulverized coal ignition in thermal power plants. Since the 1980s, high volume fly ash HVFA concrete started to use in Canada via replacing the Portland cement by 55 to 60% of FA 9 . There is no a unified definition for HVFA concrete until now. Sivasundaram et al. 10 stated that replacement of Portland cement with 30% of FA may define as HVFA concrete. However, other standards and researchers declared that FA replacement percentage should be above 40 or 50% 11‐15 .
The main disadvantage of using HVFA in concrete is decreasing of compressive strength at early ages due to the slow pozzolanic reaction of FA 16‐20 . Hence, nanosilica NS were extensively used in HVFA concrete due to its high pozzolanic reactivity with CH liberated from cement hydration to produce calcium silicate hydrate CSH which greatly enhances the concrete strength 21‐24 . Several studies were carried out on HVFA concrete with NS to investigate its thermal properties. Ibrahim 25, 26 reported that HVFANS concrete can be used as a fire proof material under temperatures reach up to 700 oC via replacing the Portland cement by 2.5 and 52.5% of NS and FA,
respectively. Whereas the HVFANS concrete maintained about 94.54% of its room compressive strength after exposing to a temperature of 700 oC. In the same context, Radzi 27 used the same above proposed mixture of
Mohamed H. Mussa1*
Azrul A. Mutalib1
Roszilah Hamid1
Sudharshan N. Raman2
1Department of Civil and Structural Engineering, Universiti Kebangsaan Malaysia, 43600 UKM Bangi, Selangor, Malaysia
2Department of Architecture, Universiti Kebangsaan Malaysia, 43600 UKM Bangi, Selangor, Malaysia *[email protected] [email protected] [email protected] [email protected] http://dx.doi.org/10.1590/1679-78254900
Received: February 04, 2018 In Revised Form: February 26, 2018 Accepted: March 11, 2018
HVFANS concrete to fabricate a slab with dimensions of 1850 1700 200 mm and tested under temperature of 1100°C. The results revealed that the residual compressive strength was 62.2% of the original compressive strength at room temperature. Moreover, the temperatures of concrete cover and bottom reinforcement were less than 300°C with a maximum spalling depth and coverage area of 23 mm and 34.3%, respectively. It can be noted that these studies on HVFANS concrete were conducted under static load condition. However, the knowledge about the dynamic behaviour of this concrete at high strain rates and elevated temperatures has not been determined.
Several engineering structures such as tunnels and high‐rise buildings might expose to an explosion by terrorist attacks during the service time such as the detonations of Moscow Metro in 2004, London Subway in 2005, and New York World Trade Centre in 2001 28, 29 . These incidents and others highlighted a fact that concrete material of structures might be in danger of fire and blast loads simultaneously. The blast or impact loading usually results in a high strain rate effect on the construction material of structures, whereas fire causes a high temperature effect. These effects might cause a great change in the mechanical behaviour of concrete 3 . Therefore, understanding of HVFANS concrete behaviour under various conditions will increase the confidence of its application in the engineering sector.
The Split Hopkinson Pressure Bar SHPB machine was broadly used to study the dynamic properties of concrete and other materials under strain rates of 10 to 104 s‐1 30, 31 . Several studies utilized this machine to
determine the properties of different concrete types subjected to the coupling effect of elevated temperature and high strain rate. Li 3 determined the dynamic properties of HSC concrete contained 4.5% of silica fume and 23% of FA under temperatures of 25, 200, 400, 600, and 800 oC. The results revealed that the dynamic compressive
strength improved with the increase of strain rate and evidently decreased after a temperature of 400 oC. In
addition, the dynamic increase factor DIF was increased linearly with the strain rate. Huo 32 studied the dynamic properties of NSC under elevated temperatures reach up to 700 oC. The outcomes indicated that the
temperature and strain rate remarkably affected the dynamic increase factor DIF of concrete. Moreover, the residual dynamic strength of concrete evidently decreased with the increase of temperature, nevertheless, a clear influence of the temperature and strain rate did not observe on the shape of normalized stress‐strain curves. Ziyan et al. 33 evaluated the dynamic behaviour of NSC concrete at temperatures of 25, 400, 600 and 800 oC under strain
rate range of 30 s‐1 to 220 s‐1. The results proved that the compressive strength of heated concrete was highly
degradation as compared with concrete at ambient temperature. In addition, the effect of high temperature on the dynamic properties of concrete was more notable than that of strain rate.
He et al. 34 stated that NSC concrete under high temperatures and blast loads tended to be more sensitive to strain rate with the increase of high temperature. The dynamic properties of concrete at room temperature was clearly different from that at elevated temperatures more than 200 oC. Su et al. 35 demonstrated that the dynamic
compressive strength of NSC increased by nearly 14% at a temperature of 400 oC as compared to the ambient
temperature. Chen 36 studied the dynamic properties of NSC at elevated temperature reach up to 950 oC. The
experimental results appeared that the dynamic compressive strength and stress‐strain curve at elevated temperature still experienced remarkable strain rate effects. Moreover, the failure modes of rapidly loaded specimens at elevated temperatures were considerably different from those at room temperature. Zhai 37 studied the effects of strain rate ranged between 10‐4 to 300 s‐1 on NSC under elevated temperature reach up to 1000 oC.
The results proved that the DIF of NSC after exposing to the elevated temperatures of 600 to 800 oC still appeared
a close relationship with strain rate.
From the previous studies, it can be concluded that the fire and strain rate had notable effects on the dynamic strength of any type of concrete. Therefore, the mutual effects of elevated temperature and high strain rate on the mechanical behaviour of HVFANS concrete was evaluated. The recommended mixture proportion by Ibrahim 25, 26 was used to fabricate the HVFANS concrete samples due to its excellent thermal properties. The dynamic properties of HVFANS concrete were determined at temperatures of 25, 400 and 700 oC by using SHPB machine
under average strain rate between 30.12 to 101.42 s‐1 and the obtained results were compared with the plain
concrete PC .
2. EXPERIMENTAL TEST PROCEDURE 2.1 Materials of Concrete Mixture
Portland cement Type I manufactured based on Malaysian standard MS 522 used in the concrete mixture 38 . The fly ash FA was collected from the Jimah power plant located at Malaysian Port Dickson and categorized as class F based on British standard BS EN 450: 2005 39 . The chemical compositions of Portland cement and FA were shown in Table 1.
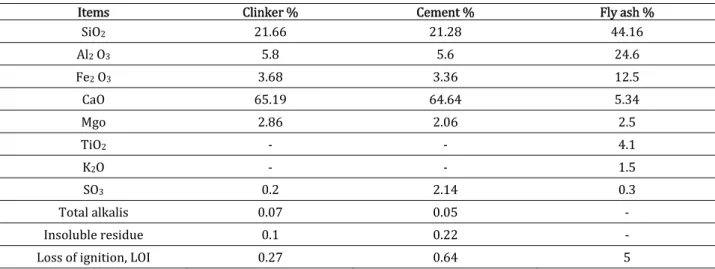
Table 1. Chemical compositions of Portland cement and fly ash.
Items Clinker % Cement % Fly ash %
SiO2 21.66 21.28 44.16
Al2 O3 5.8 5.6 24.6
Fe2 O3 3.68 3.36 12.5
CaO 65.19 64.64 5.34
Mgo 2.86 2.06 2.5
TiO2 ‐ ‐ 4.1
K2O ‐ ‐ 1.5
SO3 0.2 2.14 0.3
Total alkalis 0.07 0.05 ‐
Insoluble residue 0.1 0.22 ‐
Loss of ignition, LOI 0.27 0.64 5
Table 2 showed the properties of colloidal nanosilica NS type Cembinder W8 provided by AkzoNobel Company, which was used in the concrete mixture to improve the early compressive strength of concrete that contained a high volume of FA.
Table 2. Properties of colloidal nanosilica material.
Surface area m2/g Average size nm Silica concentration % Bulk density kg/m3 pH
80 35 50 1050 10
The fine aggregate was natural river sand passed through a 4.75 mm sieve size with a fineness modulus of 2.98 and bulk specific gravity of 2.53 40, 41 . The loose and compacted bulk density of fine aggregate were 1510.18 and 1721.83 kg/m3, respectively 42 . The coarse aggregate was crushed granite provided from local sources with a
maximum size of 10 mm and bulk specific gravity of 2.07.
Superplasticiser SP type Darex Super 20 was utilized to acquire the desired workability of concrete mixture and increase the compressive strength by decreasing the required volume of mixing water based on naphthalene sulphonate. Fibrillated polypropylene PP fibres manufactured by Timuran Company with a length of 12 mm and specific gravity of 0.9 had utilized to increase the ductility of concrete and eliminate the surface spalling 43‐47 . The dosage of SP was equal to 1% of cementitious materials weight and PP was equal to 1 kg/m3 of concrete volume.
2.2 Mixture Preparation and Curing Process
American concrete institute standard ACI 211.4R‐93 48 was applied to select the mixture proportions of PC and HVFANS concrete samples with water to cementitious materials ratio w/c p equal to 0.29 and targeted static compressive strength of 60 MPa as shown in Table 3. The HVFANS concrete samples were prepared via replacing the cement with 52.5% of FA and 2.5% of NS based on the recommendations of Ibrahim’s study conducted in Universiti Kebangsaan Malaysia UKM 25, 26 .
Table 3. Mixture materials kg/m3 of PC and HVFANS concrete.
Concrete type Cement Sand Gravel Water Sp PP FA NS
PC 531.30 780.06 942.64 170.16 5.31 1 ‐ ‐
HVFANS 225.80 682.01 942.64 154.85 5.31 1 278.93 26.56
except the HVFANS concrete specimens which stayed in moulds for 48 h 26 . Then, all the samples were placed into a water tank and cured for 28 days.
2.3 Heating Process
The static and dynamic properties of PC and HVFANS concrete samples were determined at high temperatures of 400 and 700 oC, these temperatures were selected according to prior studies performed by Ibrahim 25, 26 . The
heating process followed ISO 834 fire curve 51 and carried out by using an electric furnace with the capacity of 3 concrete cubes and heating rate of 9 oC/min. After 2h of heating at the mentioned target temperatures, the heating
process was stopped and then the samples were removed and cooled down to the ambient temperature.
2.4 Static Test
The static test was performed based on British standard BS EN 12390‐3 52 by using an automatic compression test machine produced by Unit Test Scientific Company UTS with a loading capacity of 5000 kN. The average compressive strength values of the three specimens were recorded under 25, 400 and 700 oC at curing age
of 28 days.
2.5 Dynamic Test
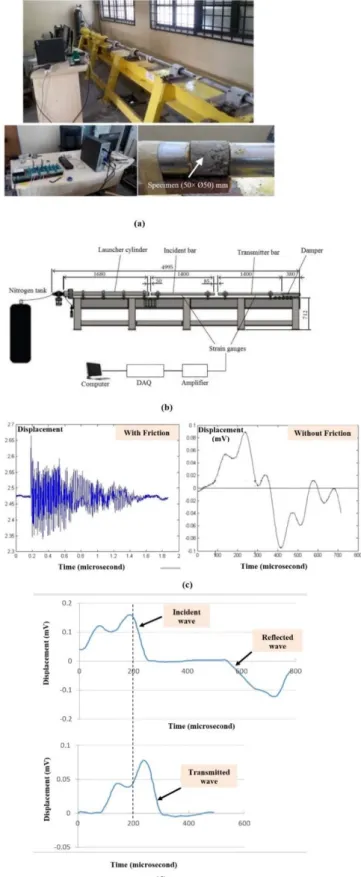
The dynamic test was conducted by using split Hopkinson pressure bar SHPB machine available in UKM laboratory as shown in Fig.1a and 1b 53, 54 . The SHPB machine consisted of striker bar moving inside launcher cylinder, incident bar and transmitter bar. All the bars are fabricated from stainless steel with Young modulus of 210 GPa and wave velocity of 5190 m/s. The bars designed with a large ratio of length to diameter in order to ensure uniaxial wave propagation through the bars. The bar diameter of 50 mm was found to be the most appropriate to achieve the minimum friction between bars and supports to reduce the waves dispersion which significantly improved the recorded signals of strain gauges as shown in Fig. 1c 53 . A good contact between bars and concrete samples was achieved to minimize friction by smoothing the sample surface with a hand grinder and sandpaper. In addition, the bars were well coaxial by using laser alignment within an accuracy up to 0.01 mm to satisfy the force equilibrium condition as shown in Fig. 1d 53 .
A total of 150 cylindrical concrete samples with 50 Ø50 mm were tested within an average of five samples for each applied strain rate under different thermal conditions for PC and HVFANS concrete. Lindholm 55 stated that the samples have to be short enough to rapidly achieve a uniform stress state along the length of concrete sample during loading. However, using of very short samples may lead to increase the friction between the bars and sample ends, hence an apparent rise in strength could occur 56 . The specimen diameter also requires to be small comparative to the wavelength of the applied load pulse to successfully achieve the theory of one dimensional wave without the complication of Pochhammer‐ Chree radial oscillations 57 . In most cases, the optimum ratio of length to diameter L/D is 0.5 according to the relationship suggested by Davies and Hunter 57 to prevent wave dispersion. Nevertheless, the experimental results of Davies and Hunter did not observe any obvious effect of specimen size on stress–strain curves within L/D ratios range between 0.31 to 1.55 57 . Consequently, the L/D ratio was chosen to be 1 by using specimens with diameter of 50 mm and length of 50 mm. Similar L/D ratio was used by other researchers 53, 54 .
Fig. 1. a SHPB machine view b Components of SHPB mm c Friction effect on incident wave d Recorded signals of incident and transmitted bars during the test
acquisition module OMB‐DAQ‐3000 which used OMB‐DaqView‐XL computer software to convert the analogy voltage signals to digital data that could be stored and analysed. MATLAB software was used to analyse the digital data and obtained the stress‐strain diagrams of concrete samples. The strain gauge of the incident bar recorded the incident pulse and reflected pulse , while the strain gauge on the transmitter bar measured the transmitted pulse 62 . Once all the pulses are recorded, the stress , strain rate t , and strain histories of the sample can be computed, respectively, by using the following equations 54, 62, 63 :
s
AE
2A
i r tt
t
t
t
1
0
s
C
t
L
it
rt
tt
2
0 t
s 0
C
dt
L
i r tt
t
t
t
3where , , are the cross‐sectional area, the Young’s modulus and the wave velocity of the bar material, and, , are the length and cross‐sectional area of the specimen.
3. RESULTS AND DISCUSSIONS 3.1 Static Test Results
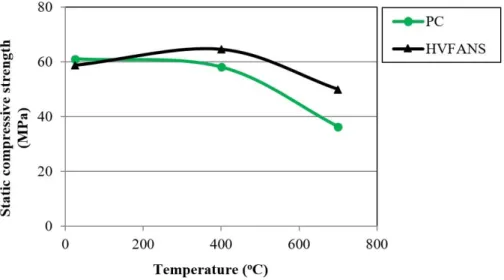
Table 4 and Figure 2 indicated that the compressive strength of HVFANS concrete at room temperature was marginally decreased by 4.21% as compared with PC due to the high quantity of fly ash FA class F which contained a low amount of cement‐like properties CaO 64 . HVFANS concrete appeared a clear increase in compressive strength at exposing temperature of 400 oC because the heating process significantly enhances the NS reactivity as
well as increase the hydration process via producing a high‐density calcium silicate hydrate structure which greatly improves the concrete strength 64 .
Table 4. Static compressive strength of PC and HVFANS concrete at various temperatures.
Sample No.
Temperature oC
25 400 700
PC HVFANS PC HVFANS PC HVFANS
1 62.66 57.95 58.61 67.79 38.87 51.6
2 59.08 61.55 56.48 61.01 33.54 52.13
3 61.82 56.68 59.48 64.86 36.71 46.26
Average MPa 61.19 58.72 58.19 64.55 36.37 49.99
Fig. 2. Behaviour of PC and HVFANS concrete at different temperatures
At temperature of 700 oC, a dramatic reduction in compressive strength of HVFANS and PC concrete was
observed due to the extreme accumulation of vapour pressure inside the specimens which caused a large number of cracks, besides the dehydrate of cement paste binder products at this temperature. Nevertheless, HVFANS concrete revealed a higher residual compressive strength by 85.13% from their original strength at room temperature as compared with PC which maintained only 59.44%, this behaviour may attribute to the filler effect of NS in the mixture which increased the calcium silica hydrate content for HVFANS concrete. The relative error of each compressive strength group was less than 7.78% which revealed that the experimental records were fairly reliable.
3.2 Dynamic Test Results
3.2.1 Compressive Strength and dynamic increase factor DIF
The ultimate dynamic compressive strength represents the peak stress determined from stress‐strain curves of PC and HVFANS concrete specimens subjected to five average strain rates and temperatures of 25, 400, and 700
oC as shown in Fig. 3.
Fig. 3. Stress‐strain curves of PC and HVFANS concrete at various temperatures.
Small variations in compressive strength were observed at 400 oC for both concrete types; however, a rapid
reduction was detected at 700 oC particularly for PC samples. The HVFANS concrete showed a good resistant for
dynamic loads at exposing temperatures of 400 and 700 oC than PC in all the investigated cases of strain rate, that
reflected the great effect of NS on concrete strength which works as a filler for small voids that may increase the calcium silica hydrate content in mixture.
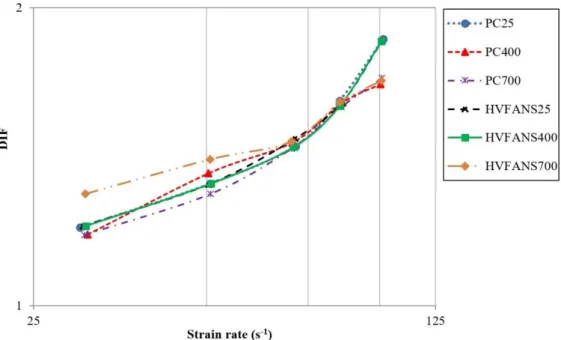
Dynamic increase factor DIF broadly used to evaluate the effect of strain rate on the compressive strength and defined as the ratio between dynamic to static compressive strength 3, 34 . The results proved that DIF mainly depended on the strain rate and increased almost linearly with the increase of strain rate for PC and HVFANS concrete samples at all the investigated temperatures as shown in Fig. 5.
Fig. 5. DIF of PC and HVFANS concrete at various strain rates and temperatures.
The response surface methodology RSM available in the Design Expert Software version 11 66 was used for the statistical design and analysis of experimental data. The main goal was to derive an equation that could significantly represent the relationship of DIF with the exposing temperature T and dynamic strain rate . The linear and 2FI solver models with the inverse transformation were the most accurate to fit the experimental data of DIF for PC and HVFANS concrete, respectively, as follows:
For PC:
1
0.943249 0.000028 T 0.003796
dDIF
4For HVFANS concrete:
6
1
0.980249 0.000156 T 0.004310 2.08303*10 *
dT
*
dDIF
5where: T is the exposing temperature between 25 to 700 oC, and is the dynamic strain rate within a range of
30.12 to 101.42 s‐1.
The results of variance analysis ANOVA were used to evaluate the accuracy of the adopted models as shown in Table 5. The outcomes revealed that the current models can be efficiently used to predict the values of DIF for both types of concrete within the mentioned ranges of temperature and strain rate. The quality of the fit polynomial model was expressed by the value of correlation coefficient R2 which should be close to 1 with a minimum value
of 0.8 67, 68 . Moreover, the differences between “Predicted R2” and “Adjusted R2” should be less than 0.2 and the
Table 5. The results of ANOVA analysis for DIF models of PC and HVFANS concrete.
Concrete Transformation Model R2 Adjusted R2 Predicted R2 Adequate Precision AP
PC inverse linear 0.9826 0.9797 0.9736 45.6237
HVFANS inverse 2FI 0.9764 0.9700 0.9516 35.9775
Several experimental tests had extensively used the DIF to evaluate the effects of dynamic strain rate on concrete in tension or compression 70, 71 . Based on to their studies, expressions were recommended to determine the DIF of concrete in compression as follows:
a In the 1993s, CEB 72 proposed an equation to calculate the DIF of concrete in compression under high strain rates reach up to 300 s‐1:
1.026 1
1/3 1
/
30
/
30
s
d s d
CEB
s d s d
For
s
DIF
For
s
6where is dynamic strain rate, is static strain rate which equal to 30 10 , 1 5 9⁄ ⁄10 , log 6.156 2, and is static compressive strength in MPa.
b In the 1997s, Tedesco et al. 73 derived an equation to determine the DIF of concrete, whereas the transition from low strain to high strain rates was occurred at 63.1 s‐1:
0.000965 log
1.058
63.1
0.758 log
0.289
63.1
7c In the 2008s, Zhou and Hao 74 proposed an equation to evaluate the DIF of concrete‐ like materials as follows:
&
0.2713 og
0.0225 og
1.12
0.3563 log
1.2275
10
10
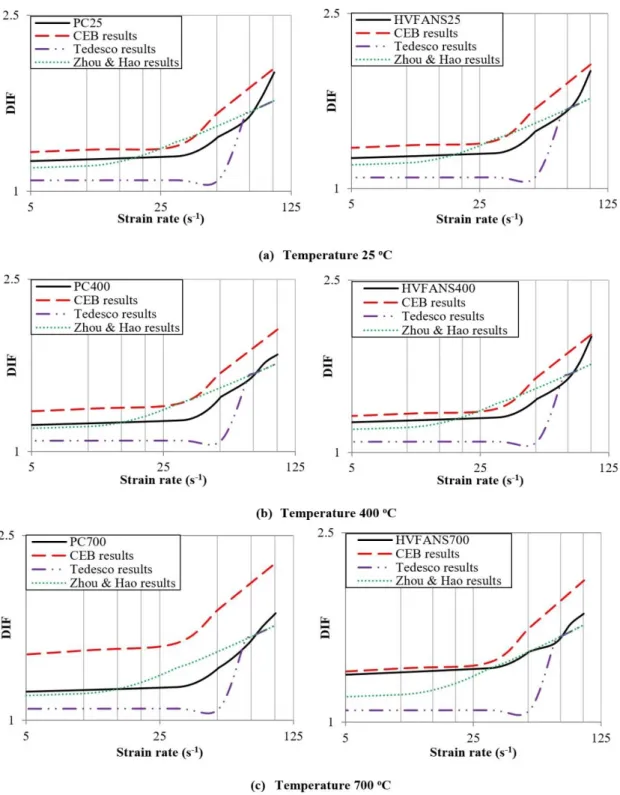
8In the present study, the dynamic increase factor curves of the experimental test were extended behind the strain rate of 30 s‐1 until the static condition when the DIF is equal to 1. The experimental dynamic increase factors
of both concrete types under temperatures of 25, 400, and 700 oC were compared with the results of the
recommended expressions of dynamic increase factor as described in Fig. 6. The outcomes proved that the CEB model expression may efficiently estimate the dynamic increase factor of both concrete types under room temperature. However, the differences between the experimental and CEB results clearly increased at elevated temperatures particularly in case of PC under 400 and 700 oC that may attribute to the great loss in concrete
strength. Nevertheless, the CEB model was more reliable to predict the behaviour of HVFANS concrete under mentioned temperatures that reflect the excellent role of nanosilica material which significantly enhances the strength of concrete under high temperature.
It can be concluded that the CEB expression could successfully use to obtain a full range of dynamic increase factor versus strain rate relationship for HVFANS concrete in compression under temperatures of 25, 400, and 700
oC which could significantly utilize as input data for the nonlinear concrete material model in numerical analysis of
Fig. 6. Comparison between DIF of test results and existing expressions at different temperatures
3.2.2 Toughness
Specific energy absorption SEA defines as the energy absorption per unit volume of concrete material. Scholars used the SEA to characterize the toughness of concrete specimens as follows 3, 75, 76 :
2 2 2
0
T
i r t
s s
AEc
SEA
t
t
t
dt
A l
9concrete specimens increased linearly with increasing of strain rate, similar behaviour was observed by researchers on concrete material tested by using SHPB machine under room or elevated temperatures 76, 77 . Small variances were noted in toughness of both concrete types at room temperature. However, the increase of temperature until 400 oC led to reducing the toughness of PC, while the same temperature caused an increase in
toughness of HVFANS concrete by 9.79% under average strain rate of 100.67 s‐1 as compared with the toughness
at room temperature.
Fig. 7. The toughness of PC and HVFANS concrete at various strain rates and temperatures.
On the other hand, a notable reduction was observed in the toughness of PC and HVFANS at a temperature of 700 oC by 84.02 and 28.83% under average strain rates of 100.81 and 100.54 s‐1, respectively, as compared with
the toughness at room temperature. Design Expert software was used to suggest the relationship of SEA with dynamic strain rate and exposing temperature T by using quadratic solver model with square root and natural algorithm transformations for PC and HVFANS concrete, respectively, with a high accuracy as shown in Table 6.
For PC:
10.28522 0.013370
0.343809
0.000096 ∗
0.000025
0.000769
10For HVFANS concrete:
ln
5.13192 0.001126
0.030767
2.86175 ∗ 10 ∗ ∗
1.57476 ∗ 10 ∗
0.000105
11where: T is the exposing temperature between 25 to 700 oC, and is the dynamic strain rate within a range of
30.12 to 101.42 s‐1.
Table 6. The results of ANOVA analysis for SEA models of PC and HVFANS concrete
Concrete Transformation Model R2 Adjusted R2 Predicted R2 Adequate Precision AP
PC Square root quadratic 0.9972 0.9956 0.9924 82.4900
HVFANS Natural Log quadratic 0.9910 0.9861 0.9774 41.0776
3.2.3 Critical strain
as shown in Fig. 8. The critical strain increased approximately linearly with increasing of strain rate and recorded small values at temperatures of 25 and 400 oC for both types of concrete ranged between 0.005 to 0.0075 due to
the existent of PP fibres which considerably enhance the ductility of concrete and provide escape channels for vapour pressure inside the voids at elevated temperatures 78‐80 .
Fig. 8. Critical strain of PC and HVFANS concrete at various strain rates and temperatures.
The smallest values of critical strain were observed for HVFANS400 that may attribute to the high reactivity of NS in the mixture which increased at a heating temperature of 400 oC. Otherwise, the critical strain obviously
increased at a temperature of 700 oC for both concrete types and the highest increment of critical strain was noted
for PC700 by 47.75% as compared with PC25 under average strain rate of 100.81 s‐1. The relationship of critical
strain ε with dynamic strain rate and temperature T was proposed by using Design Expert software with a quadratic solver model and inverse transformation for both concrete types within a good accuracy as shown in Table 7.
For PC:
171.21120 0.040541T 0.055351
0.000199 T ∗
0.000119
0.002501
12
For HVFANS concrete:
170.76193 0.122916 T 0.256219
0.000015 T ∗
0.000196
0.001491
13
where: T is the exposing temperature between 25 to 700 oC, and
d
is the dynamic strain rate within a range of 30.12 to 101.42 s‐1.Table 7. The results of ANOVA analysis for models of PC and HVFANS concrete
Concrete Transformation Model R2 Adjusted R2 Predicted R2 Adequate Precision AP
PC inverse quadratic 0.9949 0.9920 0.9811 59.4065
HVFANS inverse quadratic 0.9919 0.9874 0.9760 50.2862
3.2.4 Critical damage and Failure modes
0
0
1
0
d p
cr
d o cr
For
D
For
E
14
where is the peak stress, is the critical strain and is the initial modulus of elasticity. The given expression defined the critical damage as a kinematic variable that mainly relies on the density of voids or cracks in a specific cross section which may result in the gradual damage of concrete 84, 85 . The case of 1 means that the concrete is not able to resist the applying loads. Figure 9 indicated that the critical damage increased almost linearly with the increase of strain rate and proved that the damage of HVFANS concrete at room temperature was slightly higher than PC under similar conditions of strain rate, that may attribute to the high volume of fly ash in the mixture. However, the HVFANS concrete appeared lower values of critical damage at temperatures of 400 and 700 oC by
6.26 and 9.14% under average strain rates of 100.67 and 100.54 s‐1, respectively, as compared with PC under
similar range of strain rate.
Fig. 9. Critical damage of PC and HVFANS concrete at various strain rates and temperatures.
During experimental study, the influences of strain rate and temperature on the damage of PC and HVFANS concrete were visible. The failure of concrete samples was so violent and caused severe destruction of cylindrical test samples into small pieces at high strain rates as shown in Fig. 10a. The pattern of shear failure could only observe at the range of strain rate between 30.12 to 70.91 s‐1 under studied cases of room and elevated
temperatures except for the case of PC under 700 oC which was totally destructed at an average strain rate of 70.17
s‐1. The variation of concrete failure with increasing of strain rates was shown in Fig.10b.
It can be noted that the shear failure of concrete samples could pass through three stages according to the increase of strain rate. In the first stage when the average strain rate between 30.12 to 50.91 s‐1, the crack’s path
was passed throughout the concrete mortar only. For average strain rates of 70.17 to 71.32 s‐1, the path of cracks
was more straight and passed through a rough fracture surface which had a more broken aggregate that may attribute to the rapid increase of stress in samples which was quite sufficient to break the aggregate and concrete mortar zones along the path of less resistance. In the final stage of strain rates
85.17 s‐1 , the cracks amount wasFig. 10. Failure modes of PC and HVFANS concrete at various strain rates.
4. CONCLUSION
The results can be summarized as follows:
1. The static compressive strength of PC was higher by 4.21% than HVFANS concrete at room temperature. A dramatic reduction in compressive strength was observed at 700 oC for both types of concrete;
nevertheless, the HVFANS concrete recorded a high residual strength of 85.13% as compared with PC which maintained 59.44%.
2. HVFANS concrete achieved an excellent performance than PC in terms of dynamic compressive strength, toughness, critical strain and damage under elevated temperatures of 400 and 700 oC subjected to
average strain rate between 30.12 to 101.42 s‐1.
3. The CEB model was the most appropriate to predict the dynamic increase factors of HVFANS concrete under the studied temperatures.
4. Equations were proposed to predict the dynamic increase factor, toughness, and critical strain of both concretes within an exposing temperature range of 25 to 700 oC and average strain rate of 30.12 to
101.42 s‐1.
The mentioned results proved a good possibility to use HVFANS concrete in structures to improve its resistant to fire and dynamic loads, besides its eco‐friendly properties.
Acknowledgments
The authors would like to acknowledge the financial support from the Fundamental Research Grant Scheme grant number FRGS/1/2015/ TK01/UKM/02/4 , Arus Perdana Grant AP‐2015‐011 and Dana Impak Perdana grant number DIP‐2014‐019 to perform this research.
References
1. Khoury, G.A., B.N. Grainger, and P.J. Sullivan, Strain of concrete during first heating to 600 C under load. Magazine of concrete research, 1985. 37 133 : p. 195‐215.
3. Li, Z., J. Xu, and E. Bai, Static and dynamic mechanical properties of concrete after high temperature exposure. Materials Science and Engineering: A, 2012. 544: p. 27‐32.
4. Buchanan, A.H. and A.K. Abu, Structural design for fire safety. 2017: John Wiley & Sons.
5. Lamond, J.F., Significance of tests and properties of concrete and concrete‐making materials. Vol. 169. 2006: ASTM International.
6. Ibrahim, R.K., et al., The effect of high temperature on mortars containing silica fume. Journal of Applied Sciences, 2011. 11 14 : p. 2666‐2669.
7. Behnood, A. and H. Ziari, Effects of silica fume addition and water to cement ratio on the properties of high‐ strength concrete after exposure to high temperatures. Cement and Concrete Composites, 2008. 30 2 : p. 106‐112. 8. Flower, D.J. and J.G. Sanjayan, Green house gas emissions due to concrete manufacture. The international Journal of life cycle assessment, 2007. 12 5 : p. 282.
9. Bouzoubaa, N., et al., Laboratory‐produced high‐volume fly ash blended cements: physical properties and compressive strength of mortars. Cement and Concrete Research, 1998. 28 11 : p. 1555‐1569.
10. Sivasundaram, V., G. Carette, and V. Malhotra, Selected properties of high‐volume fly ash concretes. Concrete International, 1990. 12 10 : p. 47‐50.
11. McCarthy, M. and R. Dhir, Development of high volume fly ash cements for use in concrete construction. Fuel, 2005. 84 11 : p. 1423‐1432.
12. C311, A., Standard Test Methods for Sampling and Testing Fly Ash or Natural Pozzolans for Use as a Mineral Admixture in Portland‐Cement Concrete. 2000, ASTM International West Conshohocken, Pa.
13. Dunstan, M., et al., Investigation into the long‐term in‐situ performance of high fly ash content concrete used for structural applications. Special Publication, 1992. 132: p. 1‐20.
14. Bilodeau, A. and V. MalhotraI, Concretes Incorporating High Volumes of ASTM Class F Fly Ashes: Mechanical Properties and Resistance to De‐icing Salt Scaling and to Chloride‐Ion Penetration. Special Publication, 1992. 132: p. 319‐350.
15. Burke, D. Development of Concrete Mixtures with High‐Volume Fly Ash Cement Replacement. in 2012 International Concrete Sustainability Conference,National Ready Mixed Concrete Association. 2012.
16. Burden, D., The durability of concrete containing high levels of fly ash. 2006, University of New Brunswick, Department of Civil Engineering.
17. Şahmaran, M., et al., Self‐healing of mechanically‐loaded self consolidating concretes with high volumes of fly ash. Cement and Concrete Composites, 2008. 30 10 : p. 872‐879.
18. Younsi, A., et al., Performance‐based design and carbonation of concrete with high fly ash content. Cement and Concrete Composites, 2011. 33 10 : p. 993‐1000.
19. Bentz, D.P. and C.F. Ferraris, Rheology and setting of high volume fly ash mixtures. Cement and Concrete Composites, 2010. 32 4 : p. 265‐270.
20. Şahmaran, M., İ.Ö. Yaman, and M. Tokyay, Transport and mechanical properties of self consolidating concrete with high volume fly ash. Cement and concrete composites, 2009. 31 2 : p. 99‐106.
21. Qing, Y., et al., Influence of nano‐SiO 2 addition on properties of hardened cement paste as compared with silica fume. Construction and Building Materials, 2007. 21 3 : p. 539‐545.
22. Jo, B.‐W., et al., Characteristics of cement mortar with nano‐SiO 2 particles. Construction and building materials, 2007. 21 6 : p. 1351‐1355.
23. Collepardi, M., et al. Optimization of silica fume, fly ash and amorphous nano‐silica in superplasticized high‐ performance concretes. in Proceedings of 8th CANMET/ACI International Conference on Fly Ash, Silica Fume, Slag and Natural Pozzolans in Concrete, SP‐221,Las Vegas, USA. 2004.
25. Ibrahim, R.K., The strength and micro structures of sustainable high strength high‐volume fly ash concrete with nano materials exposed to high temperature,Ph.D. thesis., in Department of Civil and Structural Engineering. 2013, Universiti Kebangsaan Malaysia UKM : Malaysia.
26. Ibrahim, R.K., R. Hamid, and M.R. Taha, Fire resistance of high‐volume fly ash mortars with nanosilica addition. Construction and Building Materials, 2012. 36: p. 779‐786.
27. Radzi, N.A.M., Behaviour of a High Strength High‐Volume Fly Ash Nano‐Silica RC Slab under ISO 834 Fire Curve Exposure,M.Sc. thesis, in Department of Civil and Structural Engineering. 2016, Universiti Kebangsaan Malaysia
UKM : Malaysia.
28. Mussa, M.H., et al., Assessment of damage to an underground box tunnel by a surface explosion. Tunnelling and Underground Space Technology, 2017. 66: p. 64‐76.
29. Mutalib, A.A. and H. Hao, Development of PI diagrams for FRP strengthened RC columns. International journal of impact engineering, 2011. 38 5 : p. 290‐304.
30. Lu, Y., et al., Dynamic compressive behavior of recycled aggregate concrete based on split Hopkinson pressure bar tests. Latin American Journal of Solids and Structures, 2014. 11 1 : p. 131‐141.
31. Cai, Y., S. Yu, and Y. Lu, Experimental study on granite and the determination of its true strain‐rate effect. Latin American Journal of Solids and Structures, 2015. 12 4 : p. 675‐694.
32. Huo, J., et al., Experimental study on dynamic behaviours of concrete after exposure to high temperatures up to 700 C. Materials and structures, 2013. 46 1‐2 : p. 255‐265.
33. Ziyan, L.C.L.Y.W. and G.W.G. Yuzhuo, Dynamic compression behavior of heated concrete. China Civil Engineering Journal, 2011. 4: p. 013.
34. He, Y., J. Huo, and Y. Xiao, Experimental study on dynamic behavior of concrete at elevated temperatures. Advanced Science Letters, 2011. 4 3 : p. 1128‐1131.
35. Su, H., J. Xu, and W. Ren, Experimental study on the dynamic compressive mechanical properties of concrete at elevated temperature. Materials & Design, 2014. 56: p. 579‐588.
36. Chen, L., et al., Combined effects of high temperature and high strain rate on normal weight concrete. International Journal of Impact Engineering, 2015. 86: p. 40‐56.
37. Zhai, C., et al., Experimental study of strain rate effects on normal weight concrete after exposure to elevated temperature. Materials and Structures, 2017. 50 1 : p. 40.
38. Standard, M., Portland cement ordinary and rapid‐hardening : Part 1. Specification Second revision , Malaysia, MS, 2003. 522.
39. STANDARD, B., Fly ash for concrete—. 2005, Part.
40. Standard, A., C136, 2006,“. Standard Test Method for Sieve Analysis of Fine and Coarse Aggregates,” ASTM International, West Conshohocken, PA, 2006.
41. ASTM, A., C128‐07a Standard Test Method for Density, Relative Density Specific Gravity , and Absorption of Fine Aggregate. 2007. ASTM International: West Conshohocken, PA.
42. ASTM, C., 29, Standard test method for bulk density “ Unit Weight” and voids in aggregate. American Society for Testing and Materials, Annual Book, Pennsylvania, USA, 2009.
43. Banthia, N. and R. Gupta, Influence of polypropylene fiber geometry on plastic shrinkage cracking in concrete. Cement and Concrete Research, 2006. 36 7 : p. 1263‐1267.
44. Qian, C. and P. Stroeven, Development of hybrid polypropylene‐steel fibre‐reinforced concrete. Cement and Concrete Research, 2000. 30 1 : p. 63‐69.
45. Alhozaimy, A., P. Soroushian, and F. Mirza, Mechanical properties of polypropylene fiber reinforced concrete and the effects of pozzolanic materials. Cement and Concrete Composites, 1996. 18 2 : p. 85‐92.
46. Toutanji, H.A., Properties of polypropylene fiber reinforced silica fume expansive‐cement concrete. Construction and Building Materials, 1999. 13 4 : p. 171‐177.
48. Committee211, A., Guide for selecting proportions for high‐strength concrete with portland cement & fly ash‐ ACI 211.4 R‐93. 1998, Farming‐ton Hills, Michigan: American Concrete Institute.
49. Standard, A., C192. 2007. Standard Practice for Making and Curing Concrete Test Specimens in the Laboratory ASTM C192‐07 . West Conshohocken, PA: ASTM International.
50. Neville, A.M., Properties of concrete. 1995.
51. Standard, M.J., Thermal Insulation ‐ Determination of Steady‐state Thermal Resistance and Related Properties ‐ Guarded Hot Plate Apparatus ISO 8302: 1991, IDT . 2003: Department of Standards Malaysia.
52. EN, B., 12390‐3. Testing hardened concrete. Compressive strength of test specimens, 2009. 19.
53. Al‐Masoodi, A.H.H., et al., Static and dynamic properties of concrete with different types and shapes of fibrous reinforcement. Construction and Building Materials, 2016. 104: p. 247‐262.
54. Chien Yet, T., R. Hamid, and M. Kasmuri, Dynamic stress‐strain behaviour of steel fiber reinforced high‐ performance concrete with fly ash. Advances in Civil Engineering, 2012. 2012.
55. Lindholm, U.S., High strain rate tests. Measurement of mechanical properties, 1971. 5 Part 1 : p. 199‐271. 56. Bertholf, L. and C. Karnes, Two‐dimensional analysis of the split Hopkinson pressure bar system. Journal of the Mechanics and Physics of Solids, 1975. 23 1 : p. 1‐19.
57. Davies, E. and S. Hunter, The dynamic compression testing of solids by the method of the split Hopkinson pressure bar. Journal of the Mechanics and Physics of Solids, 1963. 11 3 : p. 155‐179.
58. Kirby, M.S.P., Designing a Data Acquisition System for a Split Hopkinson Pressure Bar.
59. Dyab, M.M., Providing Learning Opportunities by Designing a Split Hopkinson Pressure Bar. age, 2013. 23: p. 1. 60. Li, J. and Y. Zhang, Evaluation of constitutive models of hybrid‐fibre engineered cementitious composites under dynamic loadings. Construction and Building Materials, 2012. 30: p. 149‐160.
61. Jawed, I., et al., High‐strain‐rate behavior of hydrated cement pastes. Cement and Concrete Research, 1987. 17 3 : p. 433‐440.
62. Lok, T., P. Zhao, and G. Lu, Using the split Hopkinson pressure bar to investigate the dynamic behaviour of SFRC. Magazine of Concrete Research, 2003. 55 2 : p. 183‐191.
63. Lu, Y. and Q. Li, Appraisal of pulse‐shaping technique in split Hopkinson pressure bar tests for brittle materials. International Journal of Protective Structures, 2010. 1 3 : p. 363‐390.
64. Berndt, M., Properties of sustainable concrete containing fly ash, slag and recycled concrete aggregate. Construction and building materials, 2009. 23 7 : p. 2606‐2613.
65. Miller, O., L. Freund, and A. Needleman, Modeling and simulation of dynamic fragmentation in brittle materials. International Journal of Fracture, 1999. 96 2 : p. 101‐125.
66. Vaughn, N. and C. Polnaszek, Design‐Expert® software. Stat‐Ease, Inc, Minneapolis, MN, 2007.
67. Joglekar, A. and A. May, Product excellence through design of experiments. Cereal foods world, 1987. 32 12 : p. 857‐&.
68. Noordin, M.Y., et al., Application of response surface methodology in describing the performance of coated carbide tools when turning AISI 1045 steel. Journal of materials processing technology, 2004. 145 1 : p. 46‐58. 69. Montgomery, D.C., Design and Analysis of Experiments 6th Edition with Design Expert Software. 2004: John Wiley & Sons.
70. Malvar, L.J. and C.A. Ross, Review of strain rate effects for concrete in tension. Materials Journal, 1998. 95 6 : p. 735‐739.
71. Bischoff, P. and S. Perry, Compressive behaviour of concrete at high strain rates. Materials and structures, 1991. 24 6 : p. 425‐450.
72. MC90, C., Design of Concrete Structures. CEB‐FIP Model Code 1990. 1993, Thomas Telford.
74. Zhou, X. and H. Hao, Modelling of compressive behaviour of concrete‐like materials at high strain rate. International Journal of Solids and Structures, 2008. 45 17 : p. 4648‐4661.
75. Li, W. and J. Xu, Mechanical properties of basalt fiber reinforced geopolymeric concrete under impact loading. Materials Science and Engineering: A, 2009. 505 1 : p. 178‐186.
76. Li, W. and J. Xu, Impact characterization of basalt fiber reinforced geopolymeric concrete using a 100‐mm‐ diameter split Hopkinson pressure bar. Materials Science and Engineering: A, 2009. 513: p. 145‐153.
77. Wang, S., M.‐H. Zhang, and S.T. Quek, Effect of specimen size on static strength and dynamic increase factor of high‐strength concrete from SHPB test. Journal of Testing and Evaluation, 2011. 39 5 : p. 1‐10.
78. Köksal, F., et al., Combined effect of silica fume and steel fiber on the mechanical properties of high strength concretes. Construction and Building Materials, 2008. 22 8 : p. 1874‐1880.
79. Shannag, M., High strength concrete containing natural pozzolan and silica fume. Cement and concrete composites, 2000. 22 6 : p. 399‐406.
80. Nili, M. and V. Afroughsabet, The effects of silica fume and polypropylene fibers on the impact resistance and mechanical properties of concrete. Construction and Building Materials, 2010. 24 6 : p. 927‐933.
81. Clayton, J.D., A model for deformation and fragmentation in crushable brittle solids. International Journal of Impact Engineering, 2008. 35 5 : p. 269‐289.
82. Wang, Z.‐L., Y.‐S. Liu, and R. Shen, Stress–strain relationship of steel fiber‐reinforced concrete under dynamic compression. Construction and Building Materials, 2008. 22 5 : p. 811‐819.
83. Hamdi, E., N.B. Romdhane, and J.‐M. Le Cléac’h, A tensile damage model for rocks: application to blast induced damage assessment. Computers and Geotechnics, 2011. 38 2 : p. 133‐141.
84. Addessio, F.L. and J.N. Johnson, A constitutive model for the dynamic response of brittle materials. Journal of Applied Physics, 1990. 67 7 : p. 3275‐3286.
85. Wang, Z.‐l., Y.‐c. Li, and J. Wang, A damage‐softening statistical constitutive model considering rock residual strength. Computers & Geosciences, 2007. 33 1 : p. 1‐9.
86. Wu, W., W. Zhang, and G. Ma, Mechanical properties of copper slag reinforced concrete under dynamic compression. Construction and Building Materials, 2010. 24 6 : p. 910‐917.
87. Wang, S., M.‐H. Zhang, and S.T. Quek, Mechanical behavior of fiber‐reinforced high‐strength concrete subjected to high strain‐rate compressive loading. Construction and Building Materials, 2012. 31: p. 1‐11.