Pedro André Dias Ramos
Licenciatura em Bioquímica
Genome-wide shRNA screening
identifies genes involved in fulvestrant
resistance in breast cancer
Dissertação para obtenção do Grau de Mestre em
Genética Molecular e Biomedicina
Orientador: Prof. Henrik J. Ditzel, MD, PhD, DMsc, SDU-IMM
Co-orientador: Daniel Elias, Post-Doc, SDU-IMM
Júri:
Presidente: Doutora Margarida Casal Ribeiro Castro Caldas Braga,
Professora Auxiliar da Faculdade de Ciências e Tecnologia da Universidade Nova de Lisboa;
Arguente: Doutora Maria Alexandra Núncio de Carvalho Ramos Fernandes, Professor Auxiliar da Faculdade de Ciências e Tecnologia da Universidade Nova de Lisboa.
Vogal: Doutor Pedro Miguel Ribeiro Viana Baptista, Professor Associado com Agregação da Faculdade de Farmácia da Universidade de Lisboa
Genome-wide shRNA screening identifies genes involved in fulvestrant resistance in breast cancer
Copyright Pedro André Dias Ramos, FCT/UNL, UNL
I
ACKNOWLEDGMENTS
In first place, I’m sincerely grateful to my supervisor Prof. Henrik Ditzel for his full availability in giving
me the opportunity to do my thesis in his laboratory at the Department of Cancer and Inflammation Research, Institute of Molecular Medicine, University of Southern Denmark.
I’m also deeply grateful to my co-supervisor Post Doc Daniel Elias, which was a mentor for me, giving me guidance regarding my work and whose discussions were fundamental for my learning.
I also want to express my appreciation to my teacher at my home university, Prof. Alexandra Fernandes, whose efforts in allowing me to come to Denmark were essential. Also, I would like to thank to Prof. Paula Gonçalves for her sensibility when taking care of the process for my thesis extent.
I would also like to thank to all the people from the 3rd floor, WP25 for their hospitality in welcoming me
to the group and for the pleasant work environment. A special thanks to Carla Alves, whose help and incentive words in many situations were very important (Obrigado!). To all the lab technicians, especially to Henriette Vever, whose assistance was indispensable to carry out all the lab work.
Finally, I would like not to thank but to express my eternal gratitude to my parents Ermelinda Ramos and Emídio Ramos and to my beloved girlfriend Rita Falcão for their inconditional love. To my parents, I would like to thank for their invaluable support, otherwise it wouldn’t be possible to have my degree and to get the chance to study abroad and for the fact of being side-by-side with me, giving me strength during the hardest months of my life. To Rita, a word is just simply not enough, her support every day during the time that I was here, all the kind words, all the happiness and love that she gave me were the reasons that made me strong enough to overcome the worst moments of my life and comeback stronger to our life and finish what I started. (UM ENORME OBRIGADO!).
I also would like to thank to all my family and friends for their support and concern during all these year and a half.
I’m grateful for the financial support from the Danish Government under the cultural agreement
programme through a scholarship and afterwards from the ERASMUS programme from the Faculdade de Ciências e Tecnologia da Universidade Nova de Lisboa.
III
ABSTRACT
Breast cancer accounts as the most prevalent cancer and the leading cause of cancer death worldwide among women. Estrogen is one main factor responsible for tumour growth in breast cancer patients through stimulation of estrogen receptor (ER) signalling. ER positive (ER+) breast cancer patients are eligible for anti-estrogenic drugs. Fulvestrant (Faslodex®) represents a second-line therapy for the treatment of postmenopausal women with ER+ advanced breast cancer. Unfortunately, a significant number of ER+ patients will develop resistance to second-line fulvestrant treatment. It is therefore important to understand the molecular mechanisms of resistance and to identify biomarkers capable of predicting response to this treatment.
The aim of this project is to establish a genome-wide shRNA functional screening to identify key proteins central in resistance mechanisms and potentially predictive biomarkers capable of identifying ER+ patients that are responsive or resistant to fulvestrant treatment. To do so, a MCF-7-based fulvestrant resistant breast cancer cell line was used. MCF-7/LCC1 and MCF-7/LCC9 were transduced with shRNA libraries covering over 15,000 mRNAs and treated with fulvestrant. This led to depletion and/or enrichment of shRNAs targeting genes evaluated by next generation sequencing (NGS). Deconvolution of NGS data from genomic DNA of LCC1 and LCC9 cells transduced by shRNA libraries led to identification of 206 genes that may have functional significance in fulvestrant resistance. Ingenuity Pathway Analysis of the candidate genes identified HSD17B10 and HSPE1 as key-molecules in networks related to cell proliferation and death. We have found that these genes are upregulated in different fulvestrant-resistant cell lines when compared to their fulvestrant-sensitive parental cell line at gene and protein expression levels using RT-qPCR and Western blotting. This expression is enhanced in fulvestrant presence, suggesting that these proteins may have critical importance in the resistance phenotype. Further studies on these proteins may elucidate on how to overcome fulvestrant resistance.
V
RESUMO
O cancro de mama apresenta a maior prevalência e conta como a maior causa de morte por cancro em mulheres a nível mundial. O estrogénio é um dos principais factores responsável pelo crescimento de tumores em pacientes de cancro de mama através da estimulação da sinalização do receptor de estrogénio (RE). Pacientes de cancro de mama RE positivos (RE+) são elegíveis para fármacos anti-estrogénicos. Fulvestrant (Faslodex®) representa uma segunda linha terapêutica para o tratamento de mulheres em pós-menopausa com cancro de mama RE+ avançado. Infelizmente, um número significativo destes pacientes irá desenvolver resistência a fulvestrant. Assim, é importante entender os mecanismos moleculares de resistência e identificar biomarcadores capazes de prever resposta a estes tratamentos.
O objectivo deste projecto é estabelecer um genome-wide shRNA screening e identificar proteínas-chave associadas a mecanismos de resistência assim como biomarcadores potencialmente preditivos e capazes de identificar pacientes RE+ que respondam ou demonstrem resistência ao tratamento com fulvestrant. Para tal, linhas celulares de cancro de mama resistentes a fulvestrant originalmente de MCF-7 foram utilizadas. MCF-7/LCC1 e MCF-7/LCC9 foram transduzidas por bibliotecas de shRNAs capazes de alvejar mais de 15000 mRNAs e tratadas com fulvestrant. Isto levou a um fenómeno de delecção ou enriquecimento de genes alvejados por shRNAs, sendo avaliado através de next-generation sequencing (NGS). A desconvolução dos dados de NGS a partir de DNA genómico de células LCC1 e LCC9 transduzidas pelas bibliotecas de shRNA levaram à identificação de 206 genes que poderão ter relevância funcional na resistência a fulvestrant. Ingenuity Pathway Analysis dos genes candidatos identificou HSD17B10 e HSPE1 como moléculas-chave em redes/vias relacionadas com proliferação e morte celular. Estes genes demonstraram regulação e expressão elevada em diferentes linhas celulares resistentes a fulvestrant por comparação com as sensíveis em termos dos níveis de expressão génica e proteica avaliada por RT-qPCR e Western Blotting, respectivamente. Esta expressão aumenta na presença de fulvestrant, sugerindo que estas proteínas poderão ter uma importância crítica no fenótipo de resistência. Mais estudos nestas proteínas poderão elucidar sobre como ultrapassar a resistência a fulvestrant.
VII
ABBREVIATIONS
+fulv Plus fulvestrant
β-actin Beta-actin
AF Activating function
AIs Aromatase Inhibitors
AKT Protein kinase B
AP-1 Activator protein 1
BAK Bcl-2 homologous antagonist/killer
BCA Bicichoninic acid
BCL-2 B-cell lymphoma 2
BIK Bcl-2 interacting killer
bps base pairs
BRCA1 Breast cancer 1
BSA Bovine albumin serum
C.elegans Caenorhabditis elegans
CCT8 Chaperonin Containing TCP1, Subunit 8
cDNA complementary DNA
CEP192 Centrosomal protein of 192 kDa
CONFIRM Comparison of Faslodex in Recurrent or Metastatic Breast cancer
Day0 Day zero or baseline
DBD DNA binding domain
DEPC Diethylpyrocarbonate
DMEM Dubelcco’s Modified Eagle Medium
dNTP deoxy-nucleotides triphosphate
dsRNA double-stranded RNA
DTT Dithiothreitol
ECL Enhanced chemiluminescence
EDTA Ethylenediamine tetraacetic acid
VIII EIF2 Eukaryotic translation initiation factor 2
EIF2S2 Eukaryotic translation initiation factor 2 subunit 2
eIF4 Eukaryotic initiation factor 4
ER Estrogen receptor
ERα Estrogen receptor alpha
ERβ Estrogen receptor beta
ER+ Estrogen receptor positive
ERK Extracellular signal-regulated kinase
ERRγ Estrogen-related receptor gamma
FACS Fluorescence-activated cell sorting
FBS Fetal bovine serum
FCS Fetal calf serum
GFR Growth factor receptor
HER2 Human epidermal growth factor receptor 2
HER3 Human epidermal growth factor receptor 3
HRP Horseradish peroxidase
HSD17B10 Hydroxysteroid (17-Beta) Dehydrogenase
HSP Heat shock protein
HSPE1/HSP10 Heat shock 10 kDa protein
HTS High-throughput screening
IAA Iodoacetamide
IGF-1 Insulin-like growth factor 1
IPA Ingenuity Pathway Analysis
LBD Ligand binding domain
LTED Long-term estrogen deprivation
MAPK Mitogen-activated pathway kinase
MBP Myelin binding protein
MED1 Mediator of polymerase II transcription
subunit 1
IX
MOI Multiplicity of Infection
mRNA messenger RNA
mTOR Mammalian target of rapamycin
NEDD8 Neural precursor cell expressed,
developmentally down-regulated 8
NF-κB Nuclear factor-kappa B
NGS Next-generation sequencing
Nofulv No fulvestrant
NP-40 nonyl phenoxypolyethoxylethanol 40
p70S6k P70 S6 kinase
PBS Phosphate buffer saline
PCR Polymerase chain reaction
Pen/Strep Penicilin/Streptomycin
PFS Progression-free survival
PI3K Phosphoinositide-3-kinase
PI3KCA Phosphoinositide-3-kinase, catalytic, alpha polypeptide
PSMB2 Proteasome subunit beta type-2
PTEN Phosphatase and tensin homolog
PUM1 Pumilio homolog 1
PVDF Polivinylidene fluoride
RFP Red Fluorescent Protein
RIPA Radioimmunoprecipitation assay
RISC RNA-induced silencing complex
RNAi Ribonucleic acid interference
RPMI Roswell Park Memoriam Institute
RQ Relative quantification
RT-qPCR Quantitative real-time polymerase chain reaction
SDS Sodium dodecyl sulphate
X
SERMs Selective Estrogen Receptor Modulators
shmiRNA small hairpin microRNA
shRNA small hairpin RNA
SHROOM2 Shroom Family Member 2
siRNA small interfering RNA
SME Standard error of the mean
SP-1 Specific protein 1
TBS Tris buffer saline
TBST Tris buffer saline Tween 20
TNF Tumor necrosis factor
TP53 Tumor protein 53
XI
CONTENTS
ACKNOWLEDGEMENTS ……….I
ABSTRACT…….. ………..………III
RESUMO………...………..V
ABBREVIATIONS……….…..VII
1. INTRODUCTION
Breast cancer: Prevalence and characterization………..1
Estrogen production and ER………1
Endocrine therapy………..3
Resistance to endocrine therapy……….4
Molecular mechanisms of resistance to endocrine therapy………....4
Overcoming endocrine resistance – combined drug therapy………..5
RNAi screening: Main features and shRNA libraries………7
Pooled format: an approach using shRNA libraries in HTS……….9
Negative selection HTS for cancer-related genes………10
Present study………..11
2. MATERIALS AND METHODS Cell lines culturing 293T cell line……….13
MCF-7/0,5 and fulvestrant-resistant (FRs) cell lines………..13
LCC1 and LCC9 cell lines………...…14
T47-D cell lines……….14
ZR75 cell lines………..14
Lentivirus packaging in 293T cell line……….15
Puromycin titration in LCC1 and LCC9 cell lines………...15
Viral titer estimation in LCC1 and LCC9 cell lines……….16
shRNA genome-wide screening in LCC1 and LCC9 cell lines………16
DNA extraction and purification………...….16
PCR barcode amplification and evaluation………17
XII
DNA quantification for next-generation sequencing (NGS) using Picogreen assay………17
NGS sequencing of shRNA-specific barcodes………..17
Selection of candidate genes……….….18
Ingenuity Pathway Analysis……….18
RNA extraction………...….18
cDNA synthesis………...………..18
Quantitative reverse transcription PCR (RT-qPCR)………...……….19
Protein extraction………...19
Protein quantification (BCA assay)……….19
SDS-page………20
Western Blotting……….20
3. RESULTS Determination of virus titres to ensure enough shRNA representation in LCC cell lines………23
Barcode amplification of shRNA inserts in screen cell populations………24
Sequencing of barcode sequences led to identification of several candidate genes in different shRNA library screenings………25
Pathway analysis using Ingenuity Pathway Analysis (IPA) software showed representation of candidate genes in relevant networks………...28
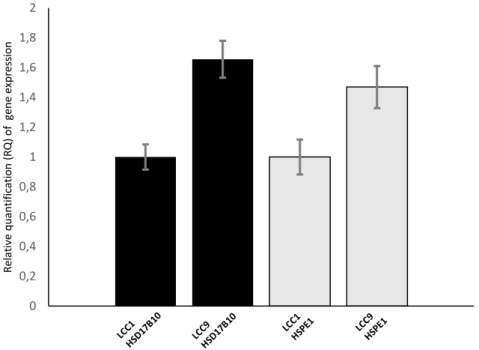
HSD17B10 and HSPE1 genes are up-regulated in fulvestrant-resistant cell lines………..32
Evaluation of protein expression showed enhanced expression of HSD17B10 and HSPE1 in fulvestrant-resistant cell lines……….…………...……….33
4. DISCUSSION………...………37
Future perspectives………...……39
REFERENCES……….41
APPENDICES Appendix I: Red Fluorescent Protein (RFP) fluorescence spectra and specifications………...49 Appendix II: Indexing primers sequences from Cellecta……….….50
Appendix III: BCA protein assay (working range 20-2000 µg/mL)……….….51
XIII Appendix V: Multiplicity of Infection (MOI) vs % of transduced cells and titer formula calculation example...…...54
Appendix VI: Lentiviral shRNA expression vector pRSI9-U6-(sh)-UbiC-RFP-2A-Puro (HTS3 cassette)………..………..55
Appendix VII: HSD17B10 and HSPE1 genes associated to important molecules related with endocrine resistance in evaluate by IPA………...56
XV
FIGURE CONTENTS
Figure 1.1. Estrogen production and action targeted by endocrine therapies……….2
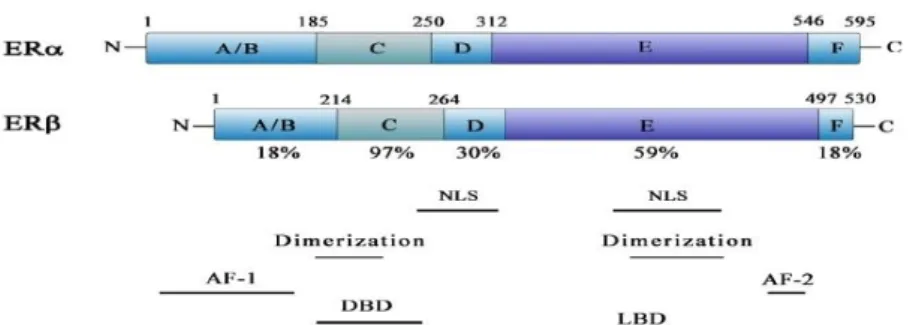
Figure 1.2. Schematic representation of functional domains of human ERα and ERβ………..3
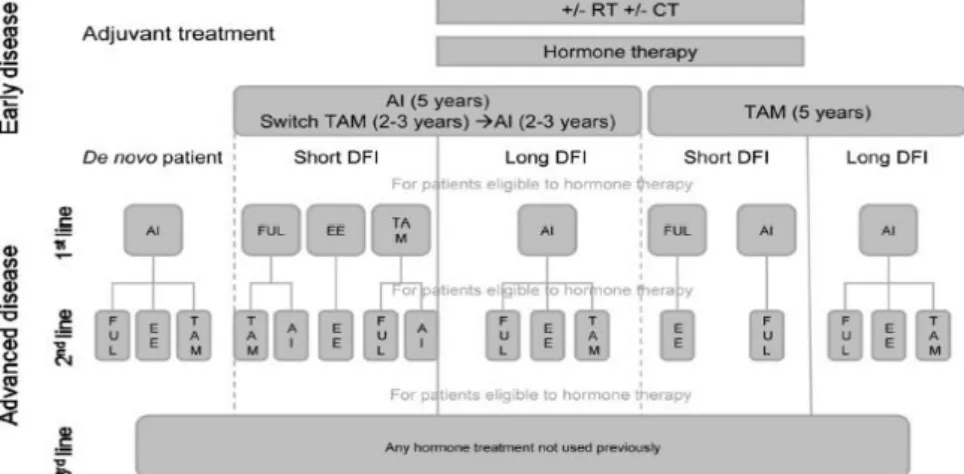
Figure 1.3. Treatment algorithm for post-menopausal patients with hormone receptor positive (ER+) and HER2 negative (HER2-) breast cancer………...6
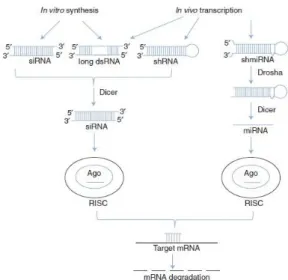
Figure 1.4. RNAi tools and enzymatic processes involved in mRNA targeting and degradation………..8
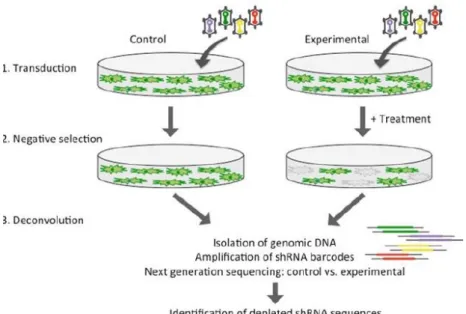
Figure 1.5. Workflow of a negative selection shRNA screening using NGS……….10
Figure 3.1. Percentage of LCC9 cells transduced upon transduction with lentiviral particles carrying shRNA library module 1………...………23
Figure 3.2. Percentage of LCC9 cells transduced upon transduction with lentiviral particles carrying shRNA library module 2………...23
Figure 3.3. Percentage of LCC9 cells transduced upon transduction with lentiviral particles carrying shRNA library module 3………..…………24
Figure 3.4. Percentage of LCC1 cells transduced upon transduction with lentiviral particles carrying shRNA library module 3………..………24
Figure 3.5. Barcode PCR amplification of genomic DNA from shRNA libraries screening cell populations in agarose gel-electrophoresis………...25
Figure 3.6. Canonical pathways common between all different shRNA library screening potential depleted candidate genes………...……28
Figure 3.7. IPA network representation based on the pool of depleted candidate genes retrieved from the different shRNA library modules screening………29
Figure 3.8. IPA summary from the convergence of the candidate genes obtained from the different shRNA library screening analysis representing the top networks identified and the correspondent score probability………..………31
Figure 3.9. Relative quantification (RQ) of gene expression of HSD17B10 (black) and HSPE1 (grey) genes in fulvestrant-sensitive LCC1 and fulvestrant-resistant LCC9 cell as measured using RT-qPCR
………32
Figure 3.10. Relative quantification (RQ) of gene expression of HSD17B10 (black) and HSPE1 (grey) genes in the fulvestrant-sensitive MCF-7 and fulvestrant-resistant FRs cell lines as measured using
XVI Figure 3.11. Western-blot analysis of HSD17B10 protein expression in different ER+ breast cancer cell lines models in the absence and presence of fulvestrant………..34
Figure 3.12. Western-blot analysis of HSPE1 protein expression in different ER+ breast cancer cell lines models in the absence and presence of fulvestrant………..………..35
Figure 3.13. Densitometric analysis of representative western-blots of HSD17B10 expression in LCC1, LCC9, ZR 75-1 and ZR 75-1R cell lines (a) and T47-D S5, T47-D R1 and R2 and MCF-7/S0,5 and FRs
cell lines (b) both in absence and presence of fulv (+fulv)………...35
Appendix
Figure 1. Tag Red Fluorescent Protein (TagRFP) characteristics……….49
Figure 2. Preparation of standards (A) and working reagent (B) in a working range between 20-2000 µg/mL for BCA protein assay………..51 Figure 3. BCA standard curve for LCC1 and LCC9 cell lines in the absence of fulvestrant by using Pierce BCA Protein Assay kit working range in appendix II...52
Figure 4. BCA standard curve for LCC1 and LCC9 cell lines in the presence of fulvestrant by using Pierce BCA Protein Assay kit working range in appendix II………...52
Figure 5. BCA standard curve for MCF-7 and FRs cell lines in the absence and presence of fulvestrant by using Pierce BCA Protein Assay kit working range in appendix II………53
Figure 6. BCA standard curve for T47-D cell lines in the absence and presence of fulvestrant by using Pierce BCA Protein Assay kit working range in appendix II………53
Figure 7. BCA standard curve for ZR-75 cell lines in the absence and presence of fulvestrant by using Pierce BCA Protein Assay kit working range in appendix II………53
Figure 8. Multiplicity of infection (MOI) and respective % of transduced cells upon infection with viral particles……….………...…….54
Figure 9. pRSI9-U6-(sh)-HTS3-UbiC-TagRFP-2A-Puro-dW lentiviral shRNA expression vector……...55
Figure 10. Network 2 (score probability of 12) associated to cell morphology, cellular assembly and organization and cellular development retrieved from IPA of candidate genes from shRNA library 1 screening………...56
XVII
TABLE CONTENTS
Table 3.1. Table showing the list of genes whose corresponding shRNAs showed marked depletion following fulvestrant treatment in shRNA library transduced LCC9 cell lines………..26
Appendix
Table 1. Indexing primers sequences used for identification of samples for next-generation sequencing
1
INTRODUCTION
Breast cancer – prevalence and characterization
Breast cancer is the most common and frequently diagnosed cancer in women worldwide (Release, 2013; Jemal et al, 2011; Esebua, 2013). According to GLOBOCAN 2012, 1.7 million breast cancers were diagnosed in total (around 12% of total cancers), being only surpassed by lung cancer and since 2008 estimates, breast cancer incidence has increased by more than 20%, while mortality has increased by 14% being the most common cause of cancer death among women in 140 countries worldwide (Release, 2013; Ferlay et al, 2010; Jemal et al, 2008; Jemal et al, 2011). In western Europe, incidence rates are high so that it has been estimated that 90 in 100 000 women have been diagnosed with breast cancer (Release, 2013; Jemal et al, 2011). In Portugal, breast cancer ranks first among cancer affecting women and Denmark is the 2nd country with higher incidence of breast cancer in the world (André et al,
2014; Release, 2013). Five major biologically distinct intrinsic subtypes of breast cancer tumors aroused after high-throughput screening technologies like microarray analysis: luminal A, luminal B, human epidermal growth factor (HER2)-overexpressing, normal-like and basal-like (Han et al, 2013). Luminal A and luminal B subtypes are characterized by typically expressing estrogen receptor (ER), although at a different level and by having the best outcome disease in patients (Kok et al, 2009; Han et al, 2013; Osborne & Schiff, 2011). They are often called ER positive tumors (ER+) and can be treated through the use of endocrine therapy (Han et al, 2013; Herynk et al, 2009; Osborne & Schiff, 2011). It has been long established that estrogen is a tumor promoter for the mammary gland, being involved in the pathogenesis of breast cancer through the sustained growth and proliferation of breast cancer cells expressing ER (Dixon, 2014; Zilli et al, 2009; Ali & Coombes, 2002; Ambrosino et al, 2013).
Estrogen production and ER
2
ER is a nuclear receptor encoded by the ESR1 gene. It comprises two distinct transactivation domains: Activation function 1 and 2 (AF-1 and AF-2) as represented in Fig.1.2. AF-1 is regulated by growth factors and act through Mitogen-activated pathway kinase (MAPK) whereas AF-2 is incorporated in the ligand binding region of ER and is logically activated by estrogen molecules (Dixon, 2014, Zilli et al, 2009; Musgrove et al, 2009; Howell, 2006; Herynk et al, 2009; Becerra et al, 2013). At the present, ERα seems to be more associated with breast cancer initiation and progression, being intensively investigated throughout the latter years in regarding to this matter. ER is related to cell proliferation and survival through two different mechanisms: the genomic and non-genomic signaling pathway (Schiff & Osborne, 2005; Osborne & Schiff, 2011; Becerra et al, 2013). The AF-1 domain is very active in ERα in different cell lines, but its activity is
negligible in ERβ under the same conditions, also showing a different response to agonist/antagonist ligands as synthetic antiestrogens like tamoxifen, ICI 164,384, faslodex and raloxifene (Klinge, 2001; Nilsson et al, 2001; Zilli et al, 2009; Howell, 2006).
3
Endocrine therapyIt is known and statistically reported that over 80% breast cancer patients are classified as ER+ breast cancers and are eligible to receive endocrine therapy (Osborne & Schiff, 2011; Zilli et al, 2009; Dixon, 2014; Musgrove et al, 2009).
Selective Estrogen Receptor Modulators (SERMs) like tamoxifen showed up to reduce the rate of disease recurrence for half when used as an adjuvant therapy in combination with surgical removal of tumor or chemotherapy and radiotherapy in early breast cancer stage (Musgrove et al, 2009; Dixon, 2014; Johnston, 2010; Howell, 2006). Tamoxifen is responsible for the reduction of annual breast cancer death to 25-30% after five years treatment (Musgrove et al, 2009; Zilli et al, 2009; Ali & Coombes, 2002; Breast, Trialists, & Group, 2005). Finally and not less important, tamoxifen treatment induces objective response or disease stabilization in about 50% of untreated metastatic breast cancer patients with ER-positive tumors (Zilli et al, 2009; Osborne & Schiff, 2011). Tamoxifen works by intranuclear competitive binding to ER, preventing the binding of coactivators to the AF-2 domain of the ER dimer (Dixon, 2014; Zilli et al, 2009; Nilsson et al, 2001; Herynk et al, 2009). Selective Estrogen Receptor Downregulators (SERDs) like fulvestrant (Faslodex®/ICI 182,780) have 100 times higher binding affinity than tamoxifen due to a complete antagonist activity, inactivating both AF-1 and AF-2, inhibiting subsequently ER-mediated gene transcription completely, which makes ER completely unavailable or unresponsive to estrogen or its agonists (Johnston, 2010; Ciruelos et al, 2014; Howell & Bergh, 2010; Howell, 2006). Fulvestrant demonstrated clinical efficacy among patients who relapsed for a second time after responding to tamoxifen and aromatase inhbitors (AIs) (Howell, 2006; Howell et al, 2004; Robertson et
Figure 1.2. Schematic representation of functional domains of human ERα and ERβ.
4
al, 2003; Ciruelos et al, 2014). In fact, fulvestrant is indicated for the treatment of postmenopausal women with ER+ with locally advanced or metastatic breast cancer and for disease relapse on or after adjuvant antiestrogen therapy (Ciruelos et al, 2014; Howell, 2006; Howell & Bergh, 2010).Resistance to endocrine therapy
Endocrine therapy represents a mainstay in the treatment of ER-positive breast cancer and despite its major good effects, resistance to the treatment will eventually occur in a large number of patients. This type of resistance can be a primary lack of response –de novo/intrinsic resistance – occurring early in the treatment or later following a period of response, defined as acquired resistance (Dixon, 2014).
It is known that about 50% of patients with advanced disease aren’t able to respond to first line treatment
with tamoxifen (de novo resistance) (Becerra et al, 2013). Studies have also shown that recurrence occurs in approximately 10-15% of patients with early-stage ER-positive breast cancer within 5 years of adjuvant therapy and recurrence rates will reach 30% by 15 years (Dixon, 2014; Breast, Trialists, & Group, 2005
).
Others stated that between 40-50% of ER-positive breast cancer patients receiving adjuvant endocrine therapy will probably relapse (Dixon, 2014; Johnston, 2010). In advanced disease, patients tend to acquire resistance within 2-3 years of commencing endocrine therapy (Dixon, 2014).Molecular mechanisms of resistance to endocrine therapy
Lack of expression is the main responsible for de novo resistance and may also account for progressive disease (Zilli et al, 2009; Musgrove et al, 2009; Johnston, 2010). In terms of acquired resistance to tamoxifen about only 17-28% of tumours don’t express ER and 20% will probably respond to second -line treatment with AIs or fulvestrant (Zilli et al, 2009; Becerra et al, 2013; Musgrove et al, 2009). The loss of expression of ER constitutes, however, the main mechanism through which acquired resistance is developed against fulvestrant in ER+ breast cancer patients (Zilli et al, 2009).
Post-translational modifications like phosphorylations have been reported to take place in ER and shown to confer resistance to endocrine therapy (Musgrove et al, 2009; Dixon et al, 2014; Herynk et al, 2009; Becerra et al,2013; Possemato et al, 2011; Ali & Coombes, 2002). Stimulation of epidermal growth factor receptor (EGFR), HER2 and insulin-like growth factor 1 (IGF1) expression leads to MAPK/Extracellular signal-regulated kinases (ERK), Phosphoinositide-3-kinase/Protein kinase B (PI3K/AKT) and mammalian target of rapamycin (mTOR) activation resulting in antiestrogen resistance to tamoxifen and fulvestrant (Zilli et al, 2009; Johnston, 2010; Bianco et al, 2012; Tokunaga et al, 2006; Osborne & Schiff, 2011; Massarweh et al, 2006).
5
2012; Ambrosino et al, 2013; Osborne & Schiff, 2011). Activation of transcriptional activity of activator protein 1 (AP1) protein, the specific protein 1 (SP1) protein and the nuclear factor- κB (NF-κB) also leads to endocrine resistance (Musgrove et al, 2009; Bianco et al, 2012).In cell culture, anti-estrogens play a role as cytostatic and cytotoxic causing G1 phase-specific cell cycle arrest, leading consequently to a decrease in the growth rate (Musgrove et al, 2009). Activation of survival signaling through the PI3K-AKT pathway and increased non-genomic signaling from cytoplasmic ER may increase the expression of anti-apoptotic molecules as B-cell lymphoma 2 (BCL-2) and decrease expression of pro-apoptotic molecules such as Bcl-2 homologous antagonist/killer (BAK), Bcl-2 interacting killer (BIK) and caspase 9 (Musgrove et al, 2009; Bianco et al, 2012; Tokunaga et al, 2006; Ali & Coombes, 2002; Osborne & Schiff, 2011).
Fulvestrant is able to inhibit proliferation of long-term estrogen deprivation (LTED) cell line models proliferation by comparison to MCF-7 cell lines models (Zilli et al, 2009). It was shown that fulvestrant may sensitize cells to therapeutically effects of PI3K inhibitors when resistance to estrogen deprivation is associated with ligand-independent ER activity (Becerra et al, 2013; Van Tine et al, 2011).
Loss of expression of ER and increased GFR signaling constitute the main mechanisms of resistance to fulvestrant treatment, but disruption of Neural precursor cell expressed, developmentally down-regulated 8 (NEDD8) pathway, which is responsible for ER ubiquitination may avoid ER degradation making it sensitive to AIs sequential treatment (Zilli et al, 2009; Fan et al, 2003). HER3 and ERK were also found to be essential for growth of human breast cancer cell lines with acquired resistance to fulvestrant (Frogne et al, 2009). Finally, overexpression of miR-221/222 in estrogen positive cell lines was shown to counteract the effect of estradiol depletion of fulvestrant-induced cell death (Ciruelos et al, 2014).
Overcoming endocrine resistance – combined therapy
Figure 1.3 shows the clinical treatment strategy adopted for post-menopausal women with ER+/HER2- breast cancer.
The Comparison of Faslodex in Recurrent or Metastatic Breast Cancer (CONFIRM) trial was able to corroborate the high-dose regimen importance for significant increases in progression-free survival (PFS) and absence of toxicity when administrating fulvestrant after relapse on endocrine therapy with tamoxifen and AIs (Ciruelos et al, 2014; Dixon, 2014; Di Leo et al, 2010). A clinical benefit rate around 30% has been reported when using fulvestrant after AI and tamoxifen resistance in preclinical and clinical studies in breast cancer patients (Zilli et al, 2009; Howell, 2006).
6
Downstream signaling pathways inhibition through the use of PI3K-mTOR antagonists like everolimus in combination with endocrine therapy have been demonstrated to inhibit cell growth and to enhance cell death (Johnston, 2010; Zilli et al, 2009; Dixon, 2014). PI3K pathway inhibitors increases pro-apoptotic effects of tamoxifen and fulvestrant in cell lines expressing high levels of AKT and ER/PI3KCA mutant models (Becerra et al, 2013; Ma, 2015; Bosch et al, 2015). Everolimus suggests benefit in metastatic ER+ patients after tamoxifen resistance when combined with fulvestrant (Dixon, 2014; Massarweh et al, 2014; Ciruelos et al, 2014; Ma, 2015; Hortobagyi et al, 2015). Blockade of AKT signaling pathway through the use of an AKT antagonist (AZD5363) in together with fulvestrant, influenced estrogen receptor function in vivo (Ribas et al, 2015; Fox et al, 2013).It is very important to differentiate early on treatment patients who may be able to gain or lose benefit from endocrine therapy in order to spare them from prolonged periods of ineffective and redundant therapy and susceptibility to high risk side-effects (Dixon, 2014). Therefore, establishing molecular response markers in breast cancer may help in identifying patients that are more susceptible to treatment using endocrine therapy and subsequently understand which common or alternative pathways are involved in the acquisition of resistance to it. This status establishment may give an appropriate selection of specific targeting therapy panel by the time of relapse in order to overcome resistance (Johnston, 2010; Zilli et al, 2009; Kok et al, 2009).
Throughout the latter years, different types of genetic screens allowed identification of candidate genes related to resistance to endocrine therapy (Musgrove et al, 2009; Mendes-Pereira, A et al, 2012). As a matter of example, PI3K-AKT pathway shows up as one of the main targets in endocrine resistant breast cancer due to what was retrieved from bioinformatics studies, RNA interference (RNAi) screening and
Figure 1.3. Treatment algorithm for post-menopausal patients with hormone receptor positive (ER+) and HER2 negative (HER2-) breast cancer. Different stages of drug administration are depicted (1st, 2nd and 3rd
7
integrative analysis of genomic and proteomic approaches (Musgrove et al, 2009; Stemke-Hale et al, 2009; Van Tine et al, 2011; Ma, 2015).RNAi screening: Main features and background.
RNAi is an endogenous cellular process by which messenger RNAs (mRNAs) are targeted for degradation by double-stranded RNAs (dsRNAs) of complementary sequence, first identified in C.elegans and conserved among almost all the eukaryotic species. The general process involves targeted transcript cleavage and degradation after a sequence-specific small interfering RNA (siRNA) binding to the mRNA transcript, leading to gene silencing (Boutros et al, 2008; Mohr et al, 2014; Kassner, 2008; Falschlehner et al, 2010; Cheng & Qin, 2009; Mohr & Perrimon, 2012). With this approach, the combination of genetic screens with phenotypic assays made possible to identify new genes or gene networks that are involved in a wide variety of biological processes like signal transduction, cell viability and drug resistance (Mohr et al, 2014; Mohr & Perrimon, 2012; Boutros et al, 2008).
8
siRNAs are small RNA duplexes constituted by 19 complementary bps and 2-nucleotide 3’ overhangs and have a transient effect with special focus in actively dividing cells (Myagishi & Taira, 2002). Conversely, shRNAs and shmiRNAs are a 50-70 bps single-stranded RNA transcripts that acquire a stem loop structure after a folding process, allowing for controlled expression of small transcripts capable of target the selected mRNA (Perrimon et al, 2010; Dyxhoorn et al, 2003). siRNAs can be designed and show an effectiveness of >70% knockdown for about of 80% of the number of the designs made (Kassner, 2008). However, the duration of the knockdown is limited to 5-7 days in most cell lines and its peak is only between 2-5 days, representing a transient knockdown (Kassner, 2008; Dyxhoorn et al, 2003). Therefore, vector-based RNAi methods are the method of excellence when long-term knockdown of a gene product is required and/or hard to transfect cell lines are desired to be used for a particular screening (Kassner, 2008; Cheng & Qin, 2009; Moffat & Sabatini, 2006). When using vector-based RNAi, the most common types of RNAi in use are shRNAs which are incorporated as shRNA libraries in order to perform genome-wide screenings. Lentiviral vectors are probably the best choice for delivery and stably expression of shRNAs in target cells because they tend to integrate into the host genome (Hu & Luo, 2012; Morris & Rossi, 2006). Lentivirus are usually produced through co-transfection of packaging constructs and required accessory proteins encoding genes for lentiviral successful integration into host cells, resulting in a packaged vector that can be harvested and used for subsequent transfection into a wide range of target cells, including mammalian cells, being incorporated in primary screens (Morris & Rossi, 2006; Moffat et al, 2006; Moffat & Sabatini, 2006; Guo et al, 2007).RNAi libraries allowed an high-throughput screening (HTS) in gene silencing of important genes involved in tumorigenesis and cancer features in cells and organisms (Mohr et al, 2014; Bernards et al, 2006; Cheng & Qin, 2009; Falschlehner et al, 2010; Mohr et al, 2010). HTS facilitates large genome-scale study of gene function in a wide variety of cell lines, tissues and organisms, including mammalian cells
9
and the assay can be modified in order to address different question like combining RNAi and drug treatment (Falschlehner et al, 2010; Mohr et al, 2010).Pooled format: an approach using shRNA libraries in HTS
10
Negative selection HTS for cancer-related genesNegative selection or drop-out screen assays are the most commonly and straightforward used screening types, especially due to the fact of identifying the genetic vulnerabilities of cancer cells as well as in identifying gene targets, which after being silenced will inhibit cancer growth, survival or other malignant phenotypes and restore drug sensitivity, Fig.1.5(Hu & Luo, 2012; Ward et al, 2013; Albukhari et al, 2015; Ketela et al, 2011; Bernards et al, 2006; Brummelkamp et al, 2006). It is possible and has been already done by several groups, the conduction of a pooled shRNA screening with cancer and normal cell lines capable of identifying the genes essential in those different contexts (Luo et al, 2008; Schlabach et al, 2008; Silva et al, 2008; Berns et al, 2004). In order to identify the loss of shRNA vectors from a population, it needs to cause a phenotype capable of scoring for the relative depletion of cells carrying the shRNA vector from the population (Bernards et al, 2006; Ngo et al, 2006; Kampmann et al, 2014). Cells that are rendered sensitive to drugs upon gene silencing will die, enter growth arrest or decrease proliferation, resulting in a diminished representation of shRNAs in the treated cells compared to the control population. Therefore, genes under these conditions are suitable and likely candidates to drug development targets (Ward et al, 2013; Albukhari et al, 2015).
11
Present studyIn this work, it was aimed at mimetizing a gene silencing of endocrine resistance associated genes capable of being subjected to regulation when fulvestrant treatment is applied to ER+ breast cancer cells. By identifying genes important in the process of antiestrogen resistance it would be possible to evaluate the expression of these same promising genes in clinical samples from ER+ patients who were given antiestrogen treatments and assess whether the expression of the gene/protein is correlated with clinical outcome of fulvestrant treatment.
Therefore we packaged shRNA libraries in lentivirus capable of transducing ER+ breast cancer cell lines and subjected them to an RNAi screening using fulvestrant. Barcodes retrieved from extracted DNA of the cells in the beginning and in the end of the screening were sequenced and the level of enrichment or depletion of shRNAs in the different cells in both time points was evaluated. By identifying relevant shRNAs it was possible to assign a number of important candidate genes that could be required for the cells in the process of fulvestrant resistance/responsiveness. We were able to identify a limited number of genes thought to be relevant in the process of fulvestrant resistance. For further evaluation were selected:
-
HSD17B10 gene which codes for a protein involved in the sex steroid metabolism and belongs to the short-chain dehydrogenase/reductase superfamily 17β-hydroxysteroid dehydrogenase where some of the members have been associated and implied as prognostic biomarkers in breast cancer showing high expression levels in ER+ breast cancer cell lines (Yang et al, 2005; Day et al, 2008; Jansson et al, 2006).13
MATERIALS AND METHODS
Cell lines used in the study:
- 293T - Human Embryonic Kidney (HEK) cells - MCF-7/S0.5 - ER+ subline of MCF-7
- MCF-7/LCC: MCF-7/LCC1 (LCC1) and MCF-7/LCC9 (LCC9) - ER+ cell lines derived from MCF-7/S0,5 - Fulvestrant resistant (FR) cell lines: MCF-7/164R-1 (FR1), MCF-7/182R-6 (FR2), MCF7/164R-4 (FR3)
and MCF-7/182R-1 (FR4) – ER+ cell lines derived from MCF-7/S0,5 cell lines
- T47-D: AL2770 (S5), AL3354 (R1) and AL3369 (R2) - ZR75: 1 and 1R
293T growth medium
Dubelcco’s Modified Eagle Medium (DMEM; Sigma-Aldrich) supplemented with 10% Fetal Bovine Serum (FBS; Sigma-Aldrich) and 1% Penicilin/Streptomycin (Pen/Strep; Sigma-Aldrich) - optional.
LCC1 and LCC9 cell lines growth medium
Phenol red-free Dubelcco’s Modified Eagle Medium and HAM’s F-12 nutrient mixture (DMEM-F12, (Gibco, Invitrogen™) supplemented with 5% stripped charcoal FBS (DCC; Gibco, Invitrogen™) and 1% Pen/Strep (Sigma-Aldrich) – optional.
Cell lines culturing
293T cell line
Human Embryonic Kidney (HEK) or 293T cells from American Type Culture Collection (ATCC) were thawed from the cryopreservation vial in 293T growth medium and grown at 37°C and 5% CO2 until they
became 80-90% confluent. After they reach this confluence media was removed, cells were washed
with Dubelcco’s Phosphate Buffer Saline (PBS; Sigma-Aldrich) 1X and detached using trypsin (Sigma-Aldrich) 1X being incubated for 5-10 minutes at 37° C in humidified air with 5% CO2. Media was changed
every second day.
MCF-7/0,5 and fulvestrant resistant (FRs) cell lines
MCF-7 was originally obtained from the Human Cell Culture Bank, Mason Research Institute (Rockville, MD, USA) and adapted to grow in DMEM-F12 (1:1) supplemented with 1% Fetal Calf Serum (FCS; Gibco BRL), Glutamax 2,5 mM and 6 ng/mL insulin (Novo Nordisk) as reported by Briand & Lykkesfeldt 1984 and Lykkesfeldt et al, 1994. MCF-7/S0,5, a subline of the original MCF-7 cell line has been adapted to grow at low serum concentration as described by Briand & Lykkesfeldt, 1984. The antiestrogen-resistant cell lines MCF-7/164R-1, MCF-7/182R-6, MCF7/164R-4 and MCF-7/182R-1 have been
established according to Lykkesfeldt et al, 1995 from MCF-7/S0,5 cell line by long-term selection with 10-7 M ICI 164,384 and ICI 182,780 (fulvestrant; AstraZeneca®). MCF-7/S0,5 cells were routinely
14
Fulvestrant-resistant cell lines were maintained in the same growth medium as MCF-7/S0,5 supplemented with 10-7 M fulvestrant (Tocris, BioScience). Growth medium was changed every secondor third day. In order to sub-culture so that they reach 80-90% confluence, media was removed, cells were washed with PBS 1X and detached using trypsin 1X being incubated for 5-10 minutes at 37° C in humidified air with 5% CO2.
LCC1 and LCC9 cell lines
The human breast cancer cell lines MCF-7/LCC1 and MCF-7/LCC9 cell lines were generated in Nils Brunner’s laboratory at the University of Copenhagen, Denmark, MCF-7/LCC1 cell, a hormone-independent but hormone-responsive cell line was generated according to Brunner et al, 1993. MCF-7/LCC9 cells were established through a stepwise in vitro selection process of MCF-7/LCC1 cells against increasing concentrations of ICI 182,780 as described in Brunner et al 1997. All cell lines were maintained in phenol red-free DMEM-F12 supplemented with 5% charcoal-stripped FBS and 1% Pen/Strep (LCC growth medium; de Cremoux et al, 2003). In order to sub-culture so that they reach 80-90% confluence media was removed, cells were washed with PBS 1X and detached using trypsin 1X being incubated for 5-10 minutes at 37° C in humidified air with 5% CO2.
T47-D cell lines
The human ER+ breast cancer T47-D cell line was obtained thanks to Anne Lykkesfeldt from Breast Cancer Group, Danish Cancer Research Center, Copenhagen, Denmark. T47-D cells were originally obtained from Human Cell Culture Bank (Mason Research Center, Rockville, MD, USA) and maintained in Roswell Park Memoriam Institute (RPMI) 1640 medium without phenol red (Gibco, Invitrogen™) supplemented with 5% FBS (Thermo Fisher Scientific), 2 mM glutamax (Gibco, Invitrogen™) and 8µg/mL insulin (Sigma-Aldrich). The fulvestrant-resistant cell lines T47-D/182R-1 (182R-1) and
T47-D/182R-2 (182R-2) were established by long-term exposure to 100 nM fulvestrant and maintained in the
same growth medium as parental T47-D cell lines plus 100 nM fulvestrant (Tocris, BioScience; Kirkegaard et al, 2014). Both sensitive (S5 – AL2770) and resistant (R1 – AL3354 and R2 – AL3369) cell lines were cultured in RPMI 1640 without phenol red (Gibco, Invitrogen™) supplemented with 5% heat-inactivated fetal bovine serum (Hi-FBS; Gibco, Invitrogen™), 1% glutamax (Gibco, Invitrogen™) and 8µg/mL insulin (Sigma-Aldrich). Both cell lines were cultured both without and/or with fulvestrant (Tocris, BioScience) in a concentration of 10-7 M. Growth medium was changed every second or third
day. In order to sub-culture so that they reach 80-90% confluence media was removed, cells were washed with PBS 1X and detached using trypsin 1X being incubated for 5-10 minutes at 37° C in humidified air with 5% CO2.
ZR75 cell lines
15
ZR75-1/ fulvestrant-resistant (ZR75-1/FR) were generated by culturing ZR75-1 cells with 1 µM fulvestrant for 4 months (Tocris, Bioscience) (Yang et al, 2016). Both sensitive (ZR75-1) and resistant (ZR75-1R) cell lines were cultured in RPMI 1640 without phenol red (Gibco, Invitrogen™) supplemented with 10% FBS (Gibco, Invitrogen™). Both cell lines were cultured both without and/or with fulvestrant (Tocris, BioScience) in a concentration of 10-7 M. Growth medium was changed every second or thirdday. In order to sub-culture so that they reach 80-90% confluence media was removed, cells were washed with PBS 1X and detached using trypsin 1X being incubated for 5-10 minutes at 37° C in humidified air with 5% CO2.
Lentivirus packaging in 293T cell line
The protocol was followed based on Cellecta manual, ABM lentivirus packaging protocol and Addgene lentivirus packaging protocols and safety data measures for GMO class II working with lentivirus were respected. These protocols detail the approach when packaging lentivirus.
293 cells were seeded (13,5x10⁶ cells in T175 flask) in 30 mL of 293T growth media without Pen/Strep
in T175 flasks until 80-90% confluence. For each T175 flask a transfection complex was prepared using two solutions: Solution A - 6 µL of DNA plasmids (1µg/µL; Cellecta) and 60 µL Packaging Mix (0,5 ug/uL; Cellecta) containing psPAX (Addgene) and pMD2.G (Addgene) were added in 2,25 mL DMEM (Sigma-Aldrich) and Solution B with 195 µL Lentifectin™ reagent (Applied Biological Materials) in 2,25 mL DMEM. Both solutions were incubated at room temperature for 5 minutes, mixed and incubated for 20 minutes. DMEM was added to the transfection complex and the mixture subsequently added to the cells. 1,5 mL of FBS (Sigma-Aldrich) was added to all T175 flasks 4-8h later. DNase treatment was performed 18 hours later by adding DMEM medium containing 5 mM of MgCl2 (Sigma-Aldrich) and 20
mM of HEPES (Sigma-Aldrich) pH 7,4 and 1U/mL DNAse I (Thermo Fisher Scientific). Supernatant was harvested 24h and 48h after, centrifuged at 512x g for 10 min and filtered through a 0,45 µm sterile low-protein binding filter. For both harvesting days, Lenti-X concentrator protocol (Takara-Clontech) instructions were followed and safety data measures were respected. Lentivirus were harvested and concentrated 100 times by using 480 µL of DMEM giving about 4 mL of virus harvested for each concentrating/harvesting step. Lentivirus were aliquoted and stored at -80°C. Lentivirus concentration was assessed through the use of Clontech test strips (Takara-Clontech) following the protocol instructions.
Puromycin titration in LCC1 and LCC9 cell lines
Puromycin titration was performed for LCC1 and LCC9 similarly to what is described in TRC Lentiviral™ shRNA Technical manual (Dharmacon, GE Healthcare). 1x10⁵ cells/mL were seeded in 24-well plate
and puromycin (Life Technologies, Thermo Fisher Scientific) was added at the following concentrations: 0,2; 0,4; 0,6; 0,8; 1 and 1,2 µg/mL. Cells were then incubated at 37oC in 5% CO2 in humidified air. The
16
(Sigma-Aldrich), H20) to each well. After 10 minutes of incubation, crystal violet was removed, followedby 3 times washing with H20. Plates were left to dry at least 24h.
Viral titer estimation in LCC1 and LCC9 cell lines
LCC1 and LCC9 cells were seeded in a 12-well plate at a concentration of 1x10⁵ cells/mL and incubated
overnight. After 24h, cells were transduced with various amounts of lentiviral particles of the shRNA libraries and of the empty vector (negative control) ranging between 0-100 µL (0, 8, 24, 36, 48, 60 and 100 µL) in LCC media containing 5 µg/mL polybrene (Sigma-Aldrich). Media without polybrene was changed in the next day and cells were harvested 48h later with 0,5% formaldehyde (Sigma-Aldrich) in PBS and collected in tubes kept on ice and protected from light. Fluorescence-Activated Cell Sorting (FACS) was performed in a Becton Dickinson LSR II Flow Cytometer (BD Biosciences, USA ) in order to evaluate the proportion of cells transduced by lentiviral particles through the measurement of Red Fluorescent Protein (RFP) intensity (Evrogen-TagRFP specifications - Appendix I) encoded in the viral genome recently integrated in LCC1 and LCC9. Data was analyzed using FlowJo (FlowJo LLC, USA) and Flowlogic (Iniviai Technologies, USA) commercial softwares.
shRNA genome-wide screening in LCC1 and LCC9 cell lines
In order to perform the genome-wide functional screening, DECIPHER Human module 1, 2 and 3 pooled lentiviral shRNA libraries (Cellecta) were used. Each shRNA libraries with a complexity of 27K shRNAs cover about 5000 human mRNAs. Cells were transduced with lentiviral particles representing Modules 1, 2 and 3 separately as detailed in Cellecta manual. For the transduction, 14x106 cells (LCC1 and
LCC9) were seeded in T175 flasks in medium and 5 µg/ml Polybrene (Sigma-Aldrich) and enough viral particles were added in order to achieve 40% transduction - Mutiplicity of Infection (MOI) of 0.5. A day after transduction media was replaced with fresh medium without polybrene and 72h later post-transduction cells were selected with 0,8 µg/ml puromycin (Life Technologies, Thermo Fisher Scientific) during 48h. Baseline samples (day0) were harvested at 300x g for 15 min in PBS and pellet was stored at -80° C. For the negative selection screening, cells were then treated with 10-7 M fulvestrant (Tocris,
BioScience) (+fulv) while controls (Nofulv) were kept in normal medium for 3 weeks. By the end of the screening, cells were harvested at 300x g for 15 min in 1X PBS and pellets were stored at -80° C.
DNA extraction and purification
17
PCR barcode amplification and evaluationFor the amplification of shRNA-specific barcodes from genomic DNA, Cellecta manual guidelines were followed. 200 µg of genomic DNA were used in 1st PCR round of amplification. In 2nd round repeat of
PCR amplification, 14 cycles and 10 and 15 µL of DNA were used for baseline (day0), untreated (Nofulv) and treated (+fulv) samples when using the indexing primers (sequences in table 1 - appendix II). Analysis of PCR products was performed after running a gel-electrophoresis on a 1X TAE gel 3,5% agarose (Invitrogen™) with GelRed (Biotium) after both 2nd rounds of PCR amplification. PCR products
were mixed with 5X loading dye (Fermentas, Thermo Fisher Scientific) prior to loading and marker 1kb Plus DNA Ladder (Invitrogen™) was also included in the gel. The electrophoresis ran at 100V for 40 min and gel was revealed in a Fusion-Fx7-7026 WL/26MX equipment (Vilbaer Lourmat, Germany) equipment through UV-light exposure.
PCR product purification
The PCR products of each sample were combined in order to perform purification after gel electrophoresis analysis. All different samples were purified using different methods in order to evaluate the methods of choice before sequencing. For PCR purification of samples Qiaquick purification kit
(Qiagen) was used according with manufacturer’s instructions as well as Clean-up kit Dynamag kit (Invitrogen™). For PCR product purification from the gel, Qiaquick gel extraction kit (Qiagen) was used according with manufacturer’s instructions. PCR products were evaluated in terms of concentration and purity in a ND-100 Spectrophotometer (Thermo Fisher Scientific) and using a Quant-iT™ Picogreen dsDNA Reagent and Kits (Life Technologies, Thermo Fisher Scientific).
DNA quantification for next-generation sequencing (NGS) using Picogreen assay
Quant-iT™ Picogreen dsDNA Reagent and Kits (Life Technologies, Termo Fisher Scientific) was used according with manufacturer´s instructions. A high-range standard curve was used and the volumes were scaled down 10x. A total volume of 300 uL was loaded for all standard and test samples in a 96-well microplate reader (Nunc). Picogreen absorbance was measured in a Victor Wallac 1420 equipment (Perkin Elmer) using an excitation wavelength of 485 nm and an emission wavelength of 535 nm and a measurement time of 0,1 s.
NGS Sequencing of shRNA-specific barcodes
HT Sequencing of pooled shRNA-specific barcodes was performed on an Illumina HiSeq platform using the respective indexing primers (Appendix II – Table 1). Sequencing was done in collaboration with Associate Professor Mads Thomassen, Department of Genetics, Odense University Hospital, Odense, Denmark.
18
Selection of candidate genesCorrespondent genes to depleted shRNAs identified from the sequencing data of the different shRNA library screenings were selected based on a reliable criteria. For shRNA library 1 and 2 screenings, genes presenting 2 or more shRNAs with a fold-change higher than 4, a minimum of 400 read counts for baseline (day0) samples and consistency (all with less shRNA read counts in treated (+fulv) samples compared to day0) were selected for further Ingenuity Pathway Analysis (IPA).
Due to the existence of replicates for treated (+fulv), untreated (nofulv) and baseline (day0) samples in shRNA library 3 screening sequencing data, a fold-change higher than 2 was adopted between +fulv and day0 and a minimum of 400 read counts in the baseline samples. All genes showing only depletion of shRNAs in these conditions were intersected with genes with a fold-change higher than 1,5 between nofulv and day0 with 400 minimum read counts. Genes not common upon this intersection were considered and compared with +fulv and nofulv list of genes. All genes showing consistency - less shRNAs read counts in treated (+fulv) than in day0 or than in untreated (nofulv) – were considered as candidates and chosen for further IPA.
Ingenuity Pathway Analysis
Ingenuity Pathway Analysis (IPA) (Qiagen) was used to evaluate whether candidate genes selected from the sequence data were part of functionally related integrated biological networks. Candidate genes were therefore uploaded to IPA and networks relating genes with pathways were established. Molecules with highest fold-change were associated with networks which were ranked based on probability scoring using p-values.
RNA extraction
RNA extraction was performed following the TRIzol® Reagent (Ambion, Life Technologies, Thermo Fisher Scientific) protocol guidelines. 6,8x10⁶ cells (LCC, MCF-7 and FRs) were harvested from T75
flask and 1 mL of Isol-Lysis Reagent (Invitrogen™) was added.
DNAse treatment was performed using DNAse I (Thermo Fisher Scientific) according to DNase I-RNase free protocol guidelines (Ambion, Life Technologies, Thermo Fisher Scientific) as well as DNAse I inactivation through heat using EDTA. RNA samples were evaluated in terms of concentration and purity using a Nanodrop ND100 spectrophotometer (Thermo Fisher Scientific). The samples were stored at -80°C.
cDNA synthesis
cDNA synthesis was performed for extracted RNA samples in duplicates. 0,5 µg of RNA extracted was added to 10 mM dNTP mix (Termo Fisher Scientific), Random Hexamer Primer 30 ng/µL (Termo Fisher Scientific) and diethylpyrocarbonate (DEPC) water until reach a final volume of 14,5 µL for each replicate.
19
(40U/µL; Termo Fisher Scientific) and RevertAid Premium Reverse Transcriptase (200 U/µL; Termo Fisher Scientific) - Reverse Transcriptase (RT) positive sample - or dH20 – RT negative sample. A PCRprogram was used: 10 min at 25°C, 30 min at 50 °C and 5 min at 85°C (inactivation step). The newly synthesized cDNA was stored at -20° C.
Quantitative reverse transcription PCR (RT-qPCR)
Real-time or quantitative Reverse Transcription Polymerase Chain Reaction (RT-qPCR) has been accomplished for all genes selected from IPA. This list included HSD17B10, HSPE1, MBP and PSMB2 genes. In order to carry out qPCR, Quanti-Tech specific primers were used for the different mentioned genes: HSD17B10 (#QT00031444); HSPE1 (#QT00000777); MBP (#QT00073528); PSMB2 (#QT00082999) and PUM1 (#QT00029421). PUM1 was used as reference gene. A mastermix of Quanti-Tech Primers (Qiagen), bi-distilled water, Power SyBr® green (Qiagen) and cDNA from RT+ and RT- samples diluted 1:10 in water was added to each well of a MicroAmp Fast 96 well reaction plate (Applied Biosystems®) in triplicates. Non-template control wells were designed using RNase-free water instead of cDNA. MicroAmp Fast 96 well reaction plate was covered with a MicroAmp optical adhesive film (Applied Biosystems®) briefly centrifuged at 1000 RPM for 1 min in a 5310 R centrifuge (Eppendorf)
and read in a StepOne™ Real-Time PCR System (Applied Biosystems®) during 2h50 min using the following program: 1 cycle: 10 min at 95°C; 40 cycles: 15 sec at 95°C + 1 min at 60°C; 15 sec at 95°C + 1 min at 60°C + 15 sec at 95°C. The RNA expression was calculated by using the comparative threshold (ct) method (Livak et al, 2001).
Protein extraction
Protein was extracted from all cell lines using a Radioimmunoprecipitation assay (RIPA) buffer (10 mM Tris-HCl pH 8, 5 mM Na2EDTA, pH 8, 1% NP-40, 0,5% sodium dioxycholate, 0,1% Sodium Dodecyl
Sulphate (SDS) containing Complete Mini, Protease Inhibitor Cocktail tablets (1 tablet/10 mL; Roche). LCC, MCF-7/FRs, T47-D, ZR75 cells in T75 flasks were rinsed and washed with cold PBS and collected using a cold cell-scrapper for a pre-cooled tube. The suspension of cells was then centrifuged for 5 min at 300xg, 4°C. Afterwards, cells’ pellet was lysed using ice-cold RIPA buffer on ice for 10 min through persistent pipetting and subsequently centrifuged for 15 min at 12000x g, 4°C. The supernatant was transferred for a pre-cooled eppendorf and stored at -20 °C.
Protein quantification (BCA assay)
20
being stored at -80°C and -20°C. Protein concentration of the lysate samples was calculated based on several standard curves (Appendix IV – Figures 3-7)SDS-page
SDS-PAGE gel has been used aiming to separate the protein bands of the protein extracts from all different cell lines in study. 5-10 µg of protein lysate was mixed with 1,5 – Dithiothreitol in water (DTT) 0,6M (Sigma-Aldrich); RunBlue LDS Sample Buffer 4X (Expedeon) and/or Laemmli Sample buffer 4X (BioRad) and heated to 99°C. 1,4 M Iodoacetamide (IAA) in sodium acetate (Sigma-Aldrich) was also heated to 99°C for 5 min and added to the mixture for the expedeon gel-electrophoresis. The mixture was loaded in 4-20% pre-cast SDS-PAGE gels; in a 12-well or 17-well (Expedeon) and 15-well (Biorad)
together with protein marker PageRuler™ 250 kDa Prestained Protein Ladder (Thermo Fisher Scientific)
– Expedeon – and with Precision Plus Protein™ Dual Color Standards, 500 μl #1610374 (BioRad). The gel ran at 200V, 90 mA, between 45-55 min in a gel chamber filled with SDS Running buffer (Expedeon) and for 30 min in a gel chamber filled with SDS Laemli Running Buffer (BioRad).
Western-blotting
In order to evaluate protein expression of candidate genes, Western-blotting was performed according to abcam® protocol guidelines for LCC, MCF-7/FRs, T47-D and ZR75 cell lines. Positively charged nylon Polivinylidene fluoride (PVDF) membrane (GE Healthcare) was activated through the use of: 96% ethanol (15 s), 2 min in ELGA water and 10 min in transfer buffer (48 mM Tris base, 39 mM Glycine, and 0,037 % v/v SDS, 20% EtOH in ddH20). After activation, a semi-dry blotting system was assembled
containing pre-wetted pieces of Whatman paper (GE Healthcare) in transfer buffer and ran at 300V, 58 mA for 1h30 min using Expedeon system and 300V, 10 min for Trans-blot turbo system. Blocking of the membrane was performed using non-fat milk (Sigma-Aldrich) 5% solution (10g dry milk in 200 mL of TBST 0,1%). TBST 0,1% buffer - 1X Tris Buffer Saline (TBS; 20X TBS: 24,23 g Trizma HCl, 80,06 g NaCl, 800 mL ELGA water, pH 7,6 and Tween20 (Sigma-Aldrich). The incubation was performed at room temperature for 1 hour. After membrane blocking, incubation with primary antibody in blocking agent was achieved using both dilution working ranges: 1:250 and 1:500 for rabbit polyclonal anti-human HSD17B10 antibody (#HPA001432; Sigma-Aldrich) and 1:250 and 1:100 for rabbit polyclonal anti-human HSPE1 antibody (#HPA038755; Sigma-Aldrich). The membrane was incubated overnight at 4°C with agitation, washed afterwards (3 times, 15 min) and incubation with secondary antibody – goat polyclonal anti-rabbit HRP (#P0448; Dako Cytomation) – was performed using a 1:5000 dilution in a non-fat milk 1% solution. After washing steps (3 times, 15 min), the detection step was performed
recurring to Pierce™ enhanced chemiluminescence (ECL) Western Blotting substrate (GE Healthcare)
21
film (Thermo Fisher Scientific) and developed on an Optimax 2010 (Protec) in a dark room. The time used for the X-ray film was way shorter than the one identified for the chemiluminescence camera. Beta-actin antibody (#ab6276, Abcam) was used as a loading control in a 1:15000 dilution and the correspondent goat polyclonal anti-mouse HRP (#P0447 – Dako Cytomation) secondary antibody in a 1:5000 dilution.23
RESULTS
Determination of virus titre to ensure sufficient shRNA representation in LCC cell lines
To ensure reliable and reproducible results when using pooled shRNA libraries, it is critical to infect enough cells and maintain sufficient representation of each shRNA construct (integrant) in the cells. A virus titration was performed using the shRNA libraries before the actual functional screening. A multiplicity of infection (MOI) of 0.5 was indicated to allow a single integrant per cell in the majority of the cells (Figure 8 – Appendix V). This will reduce the possibility of transduction of cells with multiple shRNAs, improving on-targeting effects of the shRNAs against the mRNAs present in the cell milieu (Sigoillot & King, 2011; Mohr et al, 2014). To identify the amount of viral particles used in the transfection of cells, cells were transduced with different viral suspension representing the 3 shRNA libraries. The proportion of cells transfected were subsequently determined by FACS analysis. Figures 3.1, 3.2, 3.3 and 3.4 demonstrate the percentage of transduction efficiency achieved when using different lentiviral amounts to infect both LCC1 and LCC9 cells with the 3 shRNA libraries.
Figure 3.1. Percentage of LCC9 cells transduced upon transduction with lentiviral particles carrying shRNA library module 1. Different viral amounts were used and percentage of transduced efficiency was established based on RFP+ cell number. Each bar represents the median value between replicates. Error bars are identified as standard deviation value between both replicates of each viral amount used.
24
Analysis of the figure 3 above indicate it is possible to achieve 40% transduction efficiency (MOI 0.5) for LCC1 and LCC9 cell lines when using 100 µL of lentivirus with all the different libraries. By scaling-up the volumes and using the titer formula in Figure 8 – Appendix V it is possible to obtain the required amount of lentiviral stock aimed to transduce 40% of cells in the screening experiments.Barcode amplification of shRNA inserts in screen cell populations
After genomic DNA extraction, barcode recovery was performed using PCR. In all screen cell population samples, primers complementary to a constant sequence in the shRNA constructs were designed in order to amplify the individual shRNA sequence specific (barcode). Figure 3.5 illustrates PCR amplification of the barcode of each shRNA sequence from the screen cell populations. By analyzing Fig.3.5 it is possible to verify the presence of a clear bright band around 100 bps. This band represents the HTS3-cassette that contains the shRNA insert (106 bps; Figure 9 - Appendix VI) capable of integrate in the host genome of the transduced LCC1 and LCC9 cell lines after viral infection.
Figure 3.3. Percentage of LCC9 cells transduced upon transduction with lentiviral particles carrying shRNA library module 3. Different viral amounts were used and percentage of transduced efficiency was established based on RFP+ cell number. Each bar represents the median value between replicates. Error bars are identified as standard deviation value between both replicates of each viral amount used.