A Geostatistical Simulation Algorithm for the
Homogenisation of Climatic Time Series: a
Contribution to the Homogenisation of
Monthly Precipitation Series
Sara Cristina da Silva Ribeiro
A thesis submitted in partial fulfillment of the requirements
for the degree of Doctor in Information Management
November 2016
NOVA Information Management School
Universidade Nova de Lisboa
Information Management
Specialization in Geographic Information
Copyright © by Sara Cristina da Silva Ribeiro
vii
ABSTRACT
As defined by the Intergovernmental Panel on Climate Change (IPCC), climate change refers to a change in the state of the climate that can be identified by changes in the statistical characteristics of its properties and that persists for an extended period, typically decades or longer. In order to assess climate change and to develop impact studies, it is imperative that climate signals are clean from any external factors. However, non-natural irregularities are an inevitable part of long-time climate records. They are introduced during the process of measuring and collecting data from weather stations. Accordingly, it is essential to detect and correct those irregularities a priori, through a process called homogenisation. This process became a hot topic in the last decades and many researchers have focused on developing efficient methods. Still, some climatic variables are lacking homogenisation procedures due to their high variability and temporal resolution (e.g., monthly precipitation).
We propose the gsimcli (Geostatistical SIMulation for the homogenisation of CLImate data) homogenisation method, which is based on a geostatistical simulation method, namely the direct sequential simulation. The proposed approach considers simulated values of the candidate
station’s neighbouring area, defined by the local radius parameter, aiming to account for local
characteristics of its climatic zone. gsimcli has other modelling parameters, such as the candidates order in the homogenisation process, the detection parameter, and the correction parameter (also used to fill in missing data). A semi-automatic version of gsimcli is also proposed, where the homogenisation adjustments can be estimated from a comparison series. The efficiency of the gsimcli method is evaluated in the homogenisation of precipitation data. Several homogenisation exercises are presented in a sensitivity analysis of the parameters for two different data sets: real and artificial precipitation data. The assessment of the detection part of gsimcli is based on the comparison with other detection techniques using real data, and extends a previous study for the south of Portugal. Artificial monthly and annual data from a benchmark data set of the HOME project (ACTION COST-ES0601) is used to assess the performance of gsimcli. These results allow the comparison between gsimcli and state-of-the-art methods through the calculation of performance metrics.
viii
comparison series, gsimcli can also be used as a pre-homogenisation tool followed by the use of a traditional homogenisation method (semi-automatic approach).
ix
RESUMO
As alterações climáticas, tal como definidas pelo Painel Intergovernamental para as Alterações Climáticas das Nações Unidas, referem-se a uma modificação no estado do clima que pode ser identificada através de alterações nas suas propriedades estatísticas e que perdura por um largo período de tempo, tipicamente décadas ou períodos mais longos. Para a avaliação das alterações climáticas, e para o desenvolvimento de estudos de impacte, é imperativo que os sinais climáticos estejam isentos de quaisquer fatores externos. Inevitavelmente, as séries temporais de dados climáticos contêm irregularidades não-naturais. Tais irregularidades são introduzidas durante o processo de medição e recolha de dados nas estações meteorológicas. Assim, é essencial a prévia deteção e correção dessas irregularidades, através de um processo chamado homogeneização. Nas últimas décadas, este processo tornou-se um tópico relevante e muitos investigadores procuraram desenvolver métodos de homogeneização eficientes. Contudo, existe um número reduzido de métodos para algumas variáveis climáticas devido à sua elevada variabilidade e resolução temporal (e.g., precipitação mensal).
Neste trabalho propomos o método de homogeneização gsimcli (Geostatistical SIMulation for the homogenisation of CLImate data), o qual se baseia num método de simulação geoestatística, a simulação sequencial direta. A abordagem proposta tem em consideração valores simulados na vizinhança da estação candidata, definida pelo parâmetro raio local, com o objetivo de incorporar características locais da sua zona climática. O gsimcli tem outros parâmetros de modelação, tais como a ordem das estações candidatas no processo de homogeneização, o parâmetro de deteção e o parâmetro de correção (também usado na substituição de observações omissas). Propõe-se também uma abordagem semi-automática do gsimcli onde os ajustamentos para a correção de irregularidades podem ser estimados a partir de uma série de comparação. A eficiência do método gsimcli é avaliada na homogeneização de dados de precipitação. São apresentados vários exercícios de homogeneização numa análise de sensibilidade dos parâmetros para dois conjuntos de dados: dados reais e artificiais de precipitação. A avaliação da componente de deteção do gsimcli baseia-se na comparação com outras técnicas de deteção de irregularidades utilizando dados reais, e constitui uma extensão de um estudo anterior para o sul de Portugal. O desempenho do método gsimcli é avaliado a partir de dados artificiais (mensais e anuais) de um conjunto de dados de referência (benchmark) do projeto HOME (ACTION COST-ES0601). Estes resultados permitem a comparação do gsimcli com métodos que se constituem como o estado-da-arte neste domínio, a partir do cálculo de métricas de desempenho.
x
o mais adequado à homogeneização da precipitação mensal. Os resultados mostram que o gsimcli tem um contributo positivo na homogeneização da precipitação mensal, tendo superado o desempenho de alguns métodos de homogeneização bem estabelecidos. A sua capacidade para substituir valores omissos é uma vantagem em relação a outros métodos. Tirando partido da sua capacidade para filtrar irregularidades e para disponibilizar séries de comparação, o gsimcli também pode ser usado como uma ferramenta de pré-homogeneização, seguindo-se a aplicação de um método tradicional de homogeneização (abordagem semi-automática).
xi
AGRADECIMENTOS
Agradeço à Professora Doutora Ana Cristina Costa pelo incansável apoio, motivação, disponibilidade, ideias, correções e planeamento, que permitiram concluir este trabalho no tempo previsto. Por ter acreditado em mim, pelo rigor científico que sempre imprimiu ao trabalho produzido e do qual tanto desejo aproximar-me. Pela oportunidade de trabalho, que me enriqueceu academica, e acima de tudo, pessoalmente. O que me ensinou servirá sempre de base de tudo quanto de melhor empreender realizar.
Aos professores que me acompanharam durante a fase curricular deste projeto e que me ajudaram a melhorar o trabalho, com as suas sábias recomendações, nomeadamente Professor Doutor Marco Painho, Professor Doutor Fernando Bação e Professor Doutor Roberto Henriques. Ao Júlio, pela ajuda enorme durante a realização deste projeto, pela paciência em me ensinar, tirar dúvidas e guiar no mundo da geoestatística. Pelas discussões que levaram sempre à melhoria dos resultados, e pela inclusão no software gsimcli de todas as funcionalidades necessárias a tornar o processo de homogeneização mais rápido e fácil.
Aos colaboradores da NOVA IMS pela gentileza e preciosa ajuda em todas as etapas deste processo.
Ao Ilyas, pela carta de recomendação escrita há três anos, que creio ter feito mudar o rumo da minha vida académica.
Ao meus amigos e colegas, pelo incentivo e apoio ao prosseguimento deste projeto. Teria sido certamente muito mais dificil este caminho sem o vosso entusiasmo e boa disposição.
xiii
INSTITUTIONAL ACKNOWLEDGEMENTS
The author gratefully acknowledges the financial support of “Fundação para a Ciência e Tecnologia” (FCT), Portugal, through the research project PTDC/GEO-MET/4026/2012
(“GSIMCLI - Geostatistical simulation with local distributions for the homogenization and
CONTENTS
xv
TABLE OF CONTENTS
1 Introduction ... 1
1.1 Problem Statement ... 1
1.2 Scientific Background ... 1
1.3 Relevance ... 4
1.4 Research questions ... 4
1.5 Objectives ... 5
1.6 Expected contribution ... 5
1.7 Thesis outline ... 5
1.7.1 Publications ... 6
2 Review and discussion of homogenisation methods for climate data ... 9
Abstract ... 9
2.1 Introduction ... 9
2.2 Approaches for detecting and correcting inhomogeneities ... 11
2.2.1 Direct and indirect homogenisation methods ... 11
2.2.2 Absolute and relative homogenisation methods ... 13
2.2.3 Multiple breakpoint techniques ... 14
2.3 Statistical homogenisation methods and homogenisation procedures ... 14
2.3.1 Non-parametric tests ... 15
2.3.2 Classical tests ... 16
2.3.3 Regression methods ... 17
2.3.4 Bayesian approaches ... 18
2.3.5 Homogenisation procedures ... 20
2.4 Homogenisation software packages ... 22
2.5 Comparison of homogenisation methods ... 24
xvi
2.5.2 HOME project (Advances in Homogenisation Methods of Climate Series: An
Integrated Approach) ... 25
2.6 Concluding remarks ... 27
3 Detection of inhomogeneities in precipitation time series in Portugal using direct sequential simulation ... 29
Abstract ... 29
3.1 Introduction ... 30
3.2 Data and study background ... 33
3.3 Methodological framework ... 36
3.3.1 Homogeneity tests ... 36
3.3.2 Direct sequential simulation algorithm ... 37
3.3.3 Homogenisation with a geostatistical approach ... 38
3.3.4 Search parameters and sensitivity analysis ... 40
3.4 Results and discussion ... 42
3.4.1 Homogenisation of the first set: four candidate stations ... 42
3.4.2 Homogenisation of the second set: ten candidate stations ... 45
3.5 Concluding remarks ... 47
4 gsimcli: a geostatistical procedure for the homogenisation of climatic time series ... 51
Abstract ... 51
4.1 Introduction ... 51
4.2 Methodology ... 55
4.2.1 gsimcli method ... 55
4.2.2 Performance metrics ... 58
4.3 Climate data and homogenisation framework ... 59
4.3.1 Study area and data ... 60
4.3.2 Specifications of the homogenisation exercises ... 63
4.4 Results and discussion ... 64
CONTENTS
xvii
4.4.2 Monthly precipitation series ... 69
4.5 Concluding remarks ... 70
5 Conclusion ... 73
5.1 Limitations ... 75
5.2 Future research ... 75
References ... 77
Appendix A ... 91
Appendix B ... 121
Appendix C ... 123
LIST OF FIGURES
xix
LIST OF FIGURES
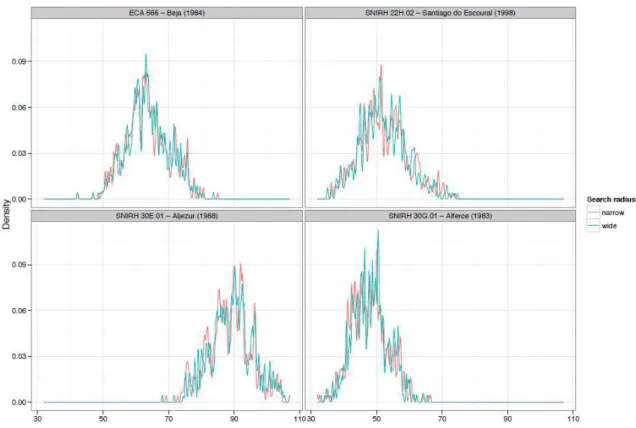
Figure 1 - Location of the 66 monitoring stations in the south of Portugal. ... 34 Figure 2 - DSS procedure schema and local pdf for a candidate station. ... 39 Figure 3 - Local pdfs of four candidate stations computed with 50 and 500 simulations (DN 50 wide and DN 500 wide sensitivity experiments). ... 42 Figure 4 - Local pdfs of four candidate stations computed with “narrow” and “wide” search
LIST OF TABLES
xxi
LIST OF TABLES
Table 1 – Thesis sections and corresponding publications in international scientific journals. .... 7
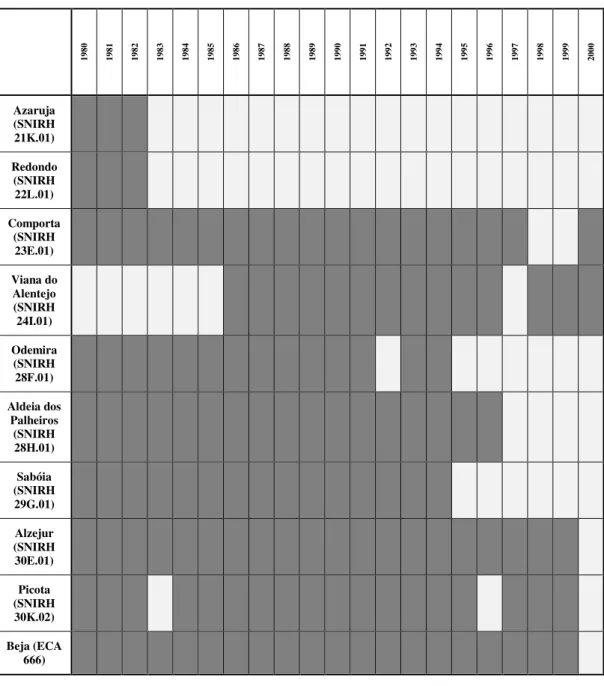
Table 2 - Length of annual time series for wet day count, per candidate station (dark grey - presence of value, light grey - missing value). ... 35
Table 3 - Search parameters used in the different sensitivity experiments. ... 41
Table 4 - Inhomogeneities detected for each of the sensitivity experiments (four candidate stations) using the “data nodes” search method. ... 44
Table 5 - Inhomogeneities detected for each of the sensitivity experiments (four candidate stations) using the “two-part search” method.... 45
Table 6 - Inhomogeneities detected for the second set of ten candidate stations. ... 46
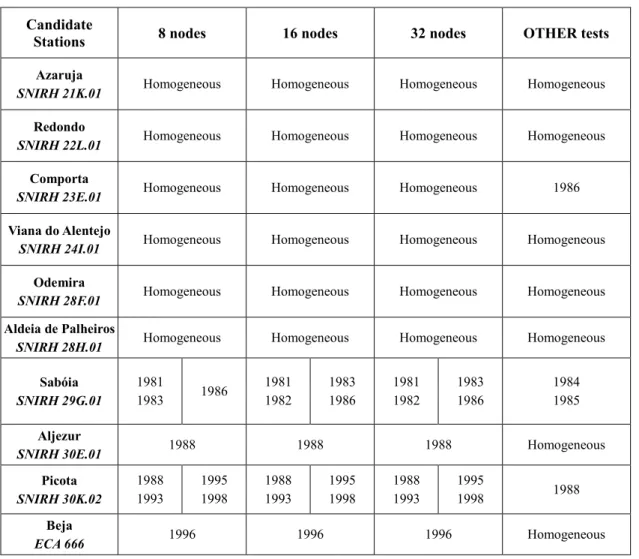
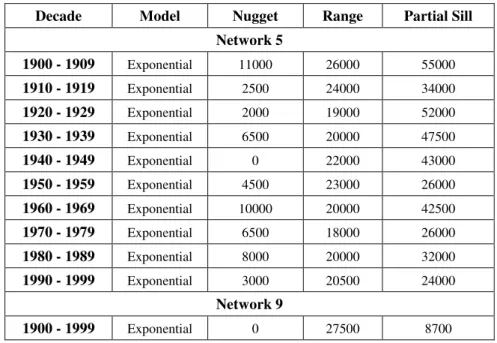
Table 7 - Variogram models of the annual precipitation series from networks 5 and 9. ... 62
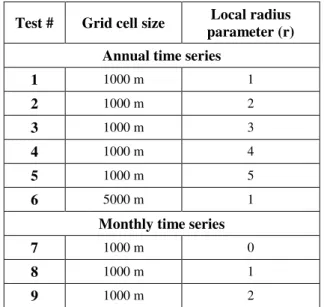
Table 8 - Parameters of the homogenisation exercises with the gsimcli method. ... 63
Table 9 - Performance metrics of the annual precipitation series from network 5 for the homogenisation exercises undertaken and for the blind contributions to the HOME project. .... 67
Table 10 - Performance metrics of the annual precipitation series from network 9 for the homogenisation exercises undertaken and for the blind contributions to the HOME project. .... 68
Table 11 - Performance metrics of the monthly precipitation series from networks 5 and 9 for the homogenisation exercises undertaken and for the blind contributions to the HOME project. .... 70
Table A.1 - Characteristics of the homogenisation methods ... 91
Table A.2 - List of studies where the homogenisation methods were applied ... 97
Table A.3 - Summary of comparison studies for homogenisation methods ... 103
Table B.1 - List of the 66 monitoring stations used in the study depicting the role of the station series (candidate in the set of 4 stations, candidate in set of 10 stations, or reference station). 121 Table C.1 - Variogram models of the monthly precipitation series from networks 5 and 9. .... 123
Table C.2 - List of the years with breakpoints and outliers defined by the HOME project (the “truth”), and of the irregular years that were detected in the homogenisation exercises. Years marked in bold are correctly detected breakpoints (with a tolerance of 2 years), and years marked in bold and underlined are correctly detected outliers. ... 125
Table S.1 - Variogram models of the monthly temperature series from network 4. ... 129
xxii
LIST OF ACRONYMS
xxiii
LIST OF ACRONYMS
2PS– Two-part search
ACMANT– Adapted Caussinus-Mestre Algorithm for Homogenizing Networks of Temperature
series
ACMANT2 - New unit of ACMANT for the homogenization of monthly or daily precipitation
series
BAMS– Bayesian multiple change-point detection in multiple linear regression (model) BARE– Bayesian change-point in multiple linear regression (model)
BNHT– Bayesian normal homogeneity test CRMSE– Centred Root Mean Square Error DN– Data nodes
DSS– Direct Sequential Simulation
ECA&D– European Climate Assessment & Dataset
ETCCDI– Expert Team on Climate Change Detection and Indices
gsimcli – Geostatistical SIMulation for the homogenisation of CLImate data
HOCLIS– Software package for homogenization of climatological time series
HOME – Advances in Homogenization Methods of Climate Series: and Integrated Approach
(COST Action ES 0601)
HOMER - HOMogenization software in R
IPCC– Intergovernmental Panel for Climate Change MASH– Multiple Analysis of Series for Homogenization
MeteoSwiss– Federal Office of Meteorology and Climatology, Switzerland MLR– Multiple linear regression
MPR– multi-phase regression
OHOMs– Objective homogenisation methods pdf(s)– Probability density function(s)
xxiv
RMSE– Root Mean Square Error
SNHT– Standard Normality Homogeneity Test
SNIRH– Sistema Nacional de Informação de Recursos Hídricos SUR– Seemingly Unrelated Regression equations (SUR) THOMAS– Tool for homogenization of monthly data series TPR - Two-phase regression
UBRIS– Urban Bias Remaining in Series
USHCN– United States Historical Climatology Network WMO– World Meteorological Organization
INTRODUCTION
1
1
Introduction
1.1
Problem Statement
Few long-term climate data series are free from irregularities (Auer et al., 2005). Those irregularities comprise two categories: natural and non-natural. Natural irregularities are caused by natural phenomena, such as ashes and gases of an erupting volcano that would prevent solar
radiation from reaching the earth’s surface, introducing a decrease in temperature, or the effect of
the North Atlantic Oscillation in extreme events across Europe (Maugeri et al., 2004). Non-natural irregularities are caused by non-natural factors, like changes in instrumentation, observing practices, relocation of the weather stations. Some changes cause sharp discontinuities (Puglisi et al., 2010) while other changes, particularly changes in the environment around the station, can cause gradual biases in the data (Peterson et al., 1998). A high number of non-natural irregularities are introduced during the process of collecting, calculating, digitizing, processing, transferring, storing and transmitting climate data series (Brunet and Jones, 2011). Also, the magnitude of inhomogeneities may differ with varying weather situations (Nemec et al., 2013).
Most long-term climatological time series have been affected by a number of non-natural factors that make these data unrepresentative of the actual climate variation occurring over time (Aguilar et al., 2003). Those non-natural irregularities, also named inhomogeneities, must be removed prior to the use of the climate data series in studies like climate change monitoring, weather forecasting or other hydrological and environmental projects (Domonkos, 2013a). Reliable results cannot be expected from those projects if the climate data series used as input contain inhomogeneities. In that sense, it is extremely important to homogenise those series, which means detecting and correcting the non-natural irregularities.
Moreover, due to the increase of storage capacity, the recent gathering of massive amounts of weather data implies also a toilsome effort to guarantee its quality. Effective and agile homogenisation procedures should be undertaken to ensure that big data, regarding weather variables, can also be used as a valuable source.
1.2
Scientific Background
2
2007) and Bayesian approaches (e.g., Perreault et al., 2000). Most modern procedures concentrate on methods specifically designed to detect and correct multiple inhomogeneities, such as MASH
– Multiple Analysis of Series for Homogenization (Szentimrey, 1999, 2006b, 2011), ACMANT - Applied Caussinus-Mestre Algorithm for Homogenizing Networks of Temperature series (Domonkos, 2011c, 2015), PRODIGE (Caussinus and Mestre, 2004) and HOMER (Mestre et al., 2013). Those homogenisation techniques typically depend on the type of climate variable (temperature, precipitation, wind speed and direction), the temporal resolution of the observations (annual, seasonal, monthly or sub-monthly), the availability of metadata (station history information) and also the weather station network density or spatial resolution (Costa and Soares, 2009a).
Homogenisation methods can be distinguished in two groups: absolute and relative methods. Absolute methods imply the application of the tests to each station data individually. In case of relative methods, the procedures use records from the neighbouring stations (also named reference stations) to assess the homogeneity of the studied station (named candidate station), presuming neighbouring stations as homogeneous.
Only a limited set of studies (e.g., Ducré-Robitaille et al., 2003; Beaulieu et al., 2008; Domonkos, 2011c; Guijarro, 2013; Yozgatligiland Yazici, 2016) provided comparison exercises between methods to identify the most successful homogenisation procedure. In 2008, the European initiative COST Action ES0601: Advances in Homogenization Methods of Climate Series: an
Integrated Approach (HOME), was released “in order to produce standard methods designed to facilitate such comparisons and promote the most efficient methods of homogenisation” (HOME,
2006). This project included a benchmark dataset, comprising monthly datasets of temperature and precipitation values with inserted, and known, inhomogeneities. These inhomogeneities include outliers, breaks, local and global trends and missing data periods. In order to assess the best techniques, the methods were compared and evaluated using performance metrics (Venema et al., 2012).
Following some of the recommendations of the HOME project (HOME, 2011), homogenisation software packages were developed, such as Climatol (Guijarro, 2011) and HOMER (Mestre et al., 2013). Some of the previously developed homogenisation methods were also improved and converted to automatic software packages, becoming updated versions. Along with HOMER, ACMANT, MASH and PRODIGE were considered the best performing homogenisation methods, due to their capabilities of detecting and correcting multiple breakpoints and working with inhomogeneous references.
INTRODUCTION
3
within the project (HOME, 2011). This recommendation also meets the consideration provided by Auer et al. (2005), referring that precipitation data require much greater effort, as their variability is more spatially complex. In other words, the spatial and temporal correlation between neighbouring stations should be considered when performing homogenisation of precipitation data series.
A geostatistical stochastic approach showed promising results in homogenising precipitation data (Costa et al., 2008a). This work used the direct sequential simulation (DSS) algorithm (Soares,
2001) to calculate the local probability density function (pdf) at a candidate’s station location.
The algorithm generates realisations of the climate variable through the resampling of the global pdf using the local mean and variance of the candidate station, which are estimated through a spatiotemporal model. The local pdf from each instant in time is used to verify the existence of irregularities: a breakpoint is identified whenever the interval of a specified probability p centred in the local pdf, does not contain the observed (real) value of the candidate station. When an irregularity is identified, Costa and Soares (2009a) proposed to adjust the candidate time series by replacing the inhomogeneous records by the mean (or median) of the pdfs calculated at the
candidate’s station location for the inhomogeneous periods.
The use of geostatistical models based on stochastic simulation is a reliable option for addressing problems in environmental and earth sciences, if the purpose is to assess the spatial distribution of a certain attribute as well as spatial uncertainty. With respect to the homogenisation of climate data, Costa and Soares (2009a) enumerate the potential advantages of geostatistical simulation over traditional approaches as follows:
Considers the temporal and spatial correlation between different weather stations;
Avoids the iterative construction of composite reference series, increasing the contribution of records from closer stations, both in spatial and correlation terms, by accounting for the spatial and temporal dependence between observations;
Deals with the problem of missing values and varying the availability of stations through time, by using different sets of neighbouring stations at different periods and by including shorter and non-complete records;
Seems to be able to simultaneously detect multiple breaks;
Is able to identify breakpoints near the start and end of the time series while traditional approaches have less power in detecting them.
This geostatistical stochastic approach was only applied to 4 candidate stations and compared with popular detection techniques by Costa et al. (2008a). The climate variable considered in these studies was the annual number of wet days (threshold of 1 mm). Hence, the method’s
4
research. Moreover, the method assumes that the global pdf is representative of the reference and candidate stations. However, this assumption may not be realistic in many situations, such as when the study area is extensive and includes different climatic zones, or when the local pdf of the candidate station is different from the global pdf due to local circumstances. In order to mitigate this fact, a new version of the geostatistical homogenisation method, which considers the local characteristics of the candidate, should be investigated.
1.3
Relevance
As discussed above, due to the spatial and temporal variability of precipitation, well-established methods for homogeneity testing monthly and sub-monthly precipitation data are lacking (e.g., Auer et al., 2005; Venema et al., 2012). The geostatistical stochastic approach proposed by Costa et al. (2008a), even though promising, as never been comprehensively evaluated. In particular, the detection part of the procedure requires further research, and its homogenisation efficiency has never been assessed. Furthermore, a new homogenisation method based on the geostatistical stochastic approach could be a valuable contribution for the homogenisation of monthly precipitation series, since it could consider the local characteristics of the variable at the temporal and spatial resolution scale.
Regarding one of the recommendations provided by Venema et al. (2012), it is also important to prepare the homogenisation method in order to deal with large data sets, in an easy and seamless manner. Such study would involve the creation of a computer application, and the performance of sensitivity analyses that contribute to the improvement of the homogenisation efficiency. Furthermore, the geostatistical stochastic approach is a ground breaking interpolation method. Like other interpolation methods, it could be used for the construction of a data series within the range of a discrete and georreferenced set of known data points, for all types of attributes. It could also be used as a homogenisation method for other climate variables, at different temporal resolutions.
1.4
Research questions
According to the previous discussion, fundamental research questions are:
Is the geostatistical simulation approach more efficient than some of the existent methods in the homogenisation of precipitation data?
INTRODUCTION
5
1.5
Objectives
Taking into consideration the research questions previously stated, this research has two main objectives:
1. To evaluate the efficiency of the geostatistical simulation approach in the homogenisation of precipitation data;
2. To investigate an extension of the geostatistical stochastic approach for the homogenisation of climate data. In this new method, the local pdf of the candidate station should better estimate the climatic signal of the surrounding area of the candidate station's location.
The specific objectives of the research are: 1. To perform a thorough literature review;
2. To assist in the development of a homogenisation software that comprises the geostatistical approach and the proposed method;
3. To extend the study of Costa et al. (2008a);
4. To investigate the mathematical formulation of the new homogenisation method; 5. To gather and analyse the precipitation data of the HOME benchmark data set;
6. To assess the performance of the geostatistical simulation approach and of the proposed method, considering different parameterization strategies.
1.6
Expected contribution
Expected results of the research encompass an innovative homogenisation algorithm. The local pdf could be characterised at the candidate station’s location in the space-time reference system. This approach could also help dealing with the problem of sparse monitoring networks. If the new method shows to be effective, it will open new perspectives for research on the homogenisation of high temporal resolution data.
1.7
Thesis outline
The following outline describes the content of each of the five sections that are part of the present research.
The current Section 1 stands as the introductory section, including the problem statement, scientific background, relevance, research questions, objectives, and the expected contribution of this research, as well as the outline of the document.
6
homogenisation methods were used, including the study area, the characteristics of the studied variables, and its main conclusions. The text from this section has been published by Ribeiro et al. (2016a).
Section 3 presents the geostatistical approach proposed as the homogenisation method, and provides the results of the homogenisation exercise that was carried out with real data of an annual precipitation index (wet day count) measured in the south of Portugal. This research is an extension of a previous study by Costa et al. (2008a). The text from this section corresponds to the article published by Ribeiro et al. (2016b).
Section 4 describes the homogenisation exercises undertaken with the benchmark data set (prepared by the HOME project), which comprises annual and monthly precipitation time series and the corresponding performance assessment. It also presents the mathematical formulation of the proposed homogenisation method, named gsimcli. The two research questions, previously stated in Section 1.4, are addressed in Section 4. The text from this section has been published by Ribeiro et al. (2016d).
Finally, Section 5 portrays the main conclusions and recommendations for future research.
1.7.1
Publications
INTRODUCTION
7 Table 1 – Thesis sections and corresponding publications in international scientific journals.
Section Reference
2
Ribeiro S, Caineta J, Costa AC. 2016. Review and discussion of homogenisation methods for climate data. Journal of Physics and Chemistry of
the Earth 94: 167–179. doi: 10.1016/j.pce.2015.08.007.
3
Ribeiro S, Caineta J, Costa AC, Henriques R. 2016. Detection of inhomogeneities in precipitation time series in Portugal using direct sequential simulation, Atmospheric Research 171: 147–158. doi:
10.1016/j.atmosres.2015.11.014.
4
Ribeiro S, Caineta J, Costa AC, Henriques H. 2016. gsimcli: a geostatistical procedure for the homogenisation of climatic time series, International Journal of Climatology, in press. doi: 10.1002/joc.4929.
In the scientific paper corresponding to Section 2, the author prepared the manuscript of the literature review, whereas the English corrections and suggestions for improvement were provided by the remaining authors and two anonymous reviewers.
In the scientific paper presented in Section 3, the author prepared the original manuscript text and data analyses, under the supervision of Ana Cristina Costa. Júlio Caineta developed the software, supervised by Roberto Henriques, and collaborated in the data analysis. Three anonymous reviewers provided valuable recommendations that lead to an improved manuscript.
REVIEW AND DISCUSSION OF HOMOGENISATION METHODS FOR CLIMATE DATA
9
2
Review and discussion of homogenisation methods for climate data
1Abstract
The quality of climate data is of extreme relevance, since these data are used in many different contexts. However, few climate time series are free from non-natural irregularities. These inhomogeneities are related to the process of collecting, digitising, processing, transferring, storing and transmitting climate data series. For instance, they can be caused by changes of measuring instrumentation, observing practices or relocation of weather stations. In order to avoid errors and bias in the results of analysis that use those data, it is particularly important to detect and remove those non-natural irregularities prior to their use. Moreover, due to the increase of storage capacity, the recent gathering of massive amounts of weather data implies also a toilsome effort to guarantee its quality. The process of detection and correction of irregularities is named homogenisation. A comprehensive summary and description of the available homogenisation methods is critical to climatologists and other experts, who are looking for a homogenisation method wholly considered as the best. The effectiveness of homogenisation methods depends on the type, temporal resolution and spatial variability of the climatic variable. Several comparison studies have been published so far. However, due to the absence of time series where irregularities are known, only a few of those comparisons indicate the level of success of the homogenisation methods. This article reviews the characteristics of the most important procedures used in the homogenisation of climatic variables based on a thorough literature research. It also summarises many methods applications in order to illustrate their applicability, which may help climatologists and other experts to identify adequate method(s) for their particular needs. This review study also describes comparison studies, which evaluated the efficiency of homogenisation methods, and provides a summary of conclusions and lessons learned regarding good practices for the use of homogenisation methods.
2.1
Introduction
Success in atmospheric modelling, weather forecasting or climate change monitoring depends on the quality of climate data used as input. Long time series without artificial discontinuities in their statistical characteristics are rare (Alexandersson and Moberg, 1997). Those irregularities can be due to climatic factors, or can be related to facts that happened during the process of collecting or recording climate data. Examples of climatic factors are the eruption of a volcano and the emission of its gases and ashes to the atmosphere contributing to the decrease of solar radiation,
10
or the effect of the North Atlantic Oscillation in extreme temperature and precipitation records across Europe (Gaffen et al., 2000).
Non-climatic factors may introduce abrupt or gradual changes in the time series (Alexandersson and Moberg, 1997). Examples of the former are changes in the method of measuring and calculating climate values, such as the use of different daily times in the calculation of daily mean temperature (Peterson et al., 1998), change of measurement units (K, º C and º F for temperature)
without any notice (Aguilar et al., 2003), changes in the formula for calculation of the variable’s
average (Puglisi et al., 2010), relocation of a station (Venema et al., 2013), or its repositioning to a different height (Auer et al., 2005). Gradual and soft changes can be exemplified by the presence of a tree or bush growing nearby the weather station, or the development of an urban area on its surroundings – the increasing of nocturnal temperature called the “Urban Heat Island Effect” (Brunet et al., 2006; Li et al., 2004; Sahin and Cigizoglu, 2010). A high number of non-natural irregularities are also introduced during the process of collecting, digitising, processing, transferring, storing and transmitting climate data series (Brunet and Jones, 2011).
These non-climatic factors may introduce artificial discontinuities, or inhomogeneities, in the time series. Such discontinuities can lead to misinterpretations of the studied climate. In order to avoid errors and obtain homogeneous climate time series, non-natural irregularities in climate data series must be detected and removed prior to its use.
Three main types of inhomogeneities can be distinguished: point errors (coming from the observation to transmission and mechanisation processes); breakpoints corresponding to change-points or shifts in the mean (changes of location, instrumentation, observing practices or land use of the surroundings); and trends (sensor decalibration or urban growth) (Guijarro, 2006). Breakpoints are the most frequent form of inhomogeneities, since most technical changes happen abruptly (Domonkos, 2011a). Trend inhomogeneities are generally more difficult to detect, because they may be superimposed on a true climate trend (Easterling and Peterson, 1995). Homogenisation is known as the process of detecting and correcting inhomogeneities (Aguilar et
al., 2003). Another definition is provided by Štěpánek et al. (2006), where homogenisation
includes the following steps: detection, verification and possible correction of outliers, creation of reference series, homogeneity testing (various homogeneity tests), determination of inhomogeneities in the light of test results and metadata, adjustment of inhomogeneities and filling in missing values. Mathematics, software and metadata are referred by Szentimrey (2011) as indispensable for homogenisation of climate data.
REVIEW AND DISCUSSION OF HOMOGENISATION METHODS FOR CLIMATE DATA
11
variability (Rustemeier et al., 2011). This variability also results in great uncertainty in homogenisation. True climatic fluctuations in daily precipitation may be interpreted as change-points and removed from time series as inhomogeneities. Moreover, the magnitude of inhomogeneities may differ with varying weather situations (Nemec et al., 2013). Another problem is associated with errors linked to the measuring process, particularly during extreme weather events. For example, larger adjustments are likely to be required for precipitation as its recording is strongly affected by wind strength (Auer et al., 2005). Systematic underestimation of snowfall is also a serious problem in areas where a substantial part of precipitation is collected by rain gauges as snow (Auer et al., 2005; Eccel et al., 2012). To overcome these issues, daily homogenisation methods require complex techniques or the improvement of homogenisation methods previously used for monthly and annual climate series. Those homogenisation methods are of paramount importance as those series are the basis for political decisions with socio-economic consequences (Venema et al., 2013).
The present section provides a description and discussion of homogenisation methods for climate data series, and summarises the conclusions of some comparison studies undertaken to assess their efficiency. Section 2.2 addresses the classification of homogenisation methods, Section 2.3 comprises a review of the available homogenisation methods, and Section 2.4 presents several homogenisation software packages. Comparison studies are briefly described in Section 2.5, where it is also given focus to the HOME project (COST Action ES0601). Finally, some conclusions are drawn in Section 2.6.
2.2
Approaches for detecting and correcting inhomogeneities
Homogenisation methods may have different characteristics, depending on the use of metadata, the subjectivity involved, the use of additional climate time series, the capability of detecting multiple breakpoints, etc. Those characteristics are discussed in the following subsections.
2.2.1
Direct and indirect homogenisation methods
12
(absolute approaches), the development of reference time series (relative approaches), and include both subjective and objective methods.
2.2.1.1 Direct methods
Direct methods aim to keep the climate time series homogeneous by anticipating changes in and around a meteorological station and limit their impact on data homogeneity (Aguilar et al., 2003, pp. 30-31). Direct methods rely on registering in the station history a metadata entry describing any change, and on collecting parallel measurements for a long enough period of time or by reproducing the old conditions (Aguilar et al., 2003, pp. 30-31; Peterson et al., 1998). Metadata information can provide precise knowledge of when the discontinuity occurred and what caused it, but correction factors can only be objectively derived from the records of the “new” and “old” conditions or from a plausible correction model.
2.2.1.2 Indirect methods
Indirect methods use a variety of statistical and graphical techniques to test the homogeneity and adjust the data series (Peterson et al., 1998; Szentimrey, 2006a). Many of these procedures use metadata for identifying or validating the discontinuities found in a time series, as recommended by Aguilar et al. (2003, pp. 33). Among the indirect methods, Peterson et al. (1998) also distinguish between subjective and objective approaches. Subjective methods rely mostly on
experts’ judgments. Subjective judgement can be useful in the exploratory analysis stage to identify discontinuities, for example by plotting the stations’ data, by using the Double-mass analysis (Kohler, 1949), or by assessing the reliability of metadata.
Domonkos and Štěpánek (2009) define objective detection methods as those that can be applied
in automatic way, without any subjective step. Objective homogenisation methods (OHOMs) have become increasingly more complex (e.g., Domonkos, 2006, 2011b). Domonkos (2006) discusses the conditions, advantages, and limitations related to the practical application of many of these methods.
REVIEW AND DISCUSSION OF HOMOGENISATION METHODS FOR CLIMATE DATA
13
Aguilar et al. (2003, pp. 32-40) and Peterson et al. (1998) include in the set of objective methods the group of absolute and relative approaches, which will be detailed in the following sections.
2.2.2
Absolute and relative homogenisation methods
Considering the use of additional climate data series, homogenisation methods can be distinguished in two classes: absolute and relative methods. Absolute methods consider only the time series of a single station to identify and adjust inhomogeneities (candidate station). Relative methods use data from the surrounding stations (reference stations) to homogenise the candidate station. Some relative approaches are based on a pairwise comparison of the candidate time series with the reference stations data, while other methods are based on composite reference series of differences (for temperature or pressure) or ratios (for precipitation) between candidate and reference stations. According to Domonkos (2013a), there are three main approaches for time series comparisons: building one reference series from composite series for each candidate series; using multiple reference comparisons for each candidate series; and using multiple comparisons without defining which are the candidate and the reference series.
When detecting a discontinuity, an absolute method cannot distinguish if it is natural or artificial without the support of the station’s history records. Begert et al. (2005) referred a clear limitation in the absolute methods’ capacity to separate discontinuities from true climate signals. Same
opinion is shared by Guijarro (2011), advising that absolute homogenisation methods are to be avoided in favour of relative methodologies.
Surrounding stations are exposed to almost the same climate signal. Relative homogenisation is favoured when the spatial density and coherence of the climate data series allows it, because the climatic variation that is common for the study region does not appear in the differences between the candidate and nearby stations (Domonkos, 2013a). The difference time series can be used to detect inhomogeneities, but if a break is detected it may be not clear to which of the stations it belongs to. Furthermore, time series typically have more than just one break. These are two of the problems that homogenisation techniques try to solve. Moreover, the difference time series is useless when the whole network has been simultaneously affected by changes. However, such collective changes are usually well documented, otherwise changes can be detected by comparing multiple networks, and thus this situation is not so problematic.
14
detection/adjustment. Peterson et al. (1998) mention the use of metadata to determine which nearby stations would not be expected to have inhomogeneities during specific time periods. Another possible solution is to combine data from different reference stations into a composite reference series assumed as homogenised. Szentimrey (2006a) refers that the spatial covariance structure of data series is very important to develop efficient methods addressing reference series creation, difference series constitution or multiple comparisons of series.
Menne and Williams Jr. (2009) discuss the limitations and challenges of many relative homogeneity testing methods, and propose an algorithm that is able to deal with inhomogeneous neighbouring series. Other methods currently address the presence of change points within the reference series (e.g., Caussinus and Mestre, 2004; Domonkos, 2011c, 2015; Mestre et al., 2013; Szentimrey, 1999, 2006b, 2011).
2.2.3
Multiple breakpoint techniques
One of the fundamental problems of homogenisation is that usually more than one breakpoint is present in the candidate time series (Lindau and Venema, 2013). The majority of the statistical homogenisation methods deals with this problem by applying single-breakpoint techniques multiple times. Typically, when a breakpoint is detected, the time series is divided in two subsets of observations at the identified break and the single-breakpoint algorithm is applied separately to each subset of data. This process is repeated until no more breaks are found or the number of observations becomes too small. The disadvantage of this segmentation process is that the same test applied several times on the same observations can increase the risk of false detection (Beaulieu et al., 2009). The most efficient single-breakpoint technique is known as cutting algorithm (Domonkos et al., 2012), which is a hierarchic method for identifying multiple breakpoints proposed by Easterling and Peterson (1995).
Multiple breakpoint methods are those that detect and correct multiple change-points jointly, and not step-by-step. Recent studies indicate that these are the most effective detection procedures (e.g., Domonkos, 2011b; Venema et al., 2012). Multiple breakpoint algorithms use as detection criterion the maximum external variance between the means of constant time segments in between multiple breakpoints (Lindau and Venema, 2016). These methods apply a relatively simple model (step-function) and select the most probable parameters of this model by the examination of all possible combinations of breakpoint positions (Domonkos, 2013a).
2.3
Statistical homogenisation methods and homogenisation procedures
REVIEW AND DISCUSSION OF HOMOGENISATION METHODS FOR CLIMATE DATA
15
homogenisation algorithms that are able to handle inhomogeneous reference series and multiple structures of inhomogeneities. The homogenisation techniques are classified by type of approach (Table A.1 of the Appendix A). Statistical techniques were classified based on their characteristics: non-parametric tests, classical tests (traditional techniques), regression models and Bayesian approaches. Techniques that were directly proposed as methods for the
homogenisation of climate data series are named “homogenisation procedures”. These procedures
may include more than one statistical technique. Moreover, considering the discussion in Section 2.2, the procedures listed in Table A.1 (Appendix A) are classified as objective bearing in mind
the definition provided by Domonkos and Štěpánek (2009). Several techniques are used in the detection stage only (qualifying tests), thus they are useful for homogeneity diagnosis. A sample of studies where the referred methods were applied is provided in Table A.2 (Appendix A), to illustrate their applicability regarding the study region, climate variable and temporal resolution.
2.3.1
Non-parametric tests
The most common non-parametric tests used for homogeneity testing are: Von Neumann ratio test (Von Neumann, 1941), Wald-Wolfowitz runs test (Wald and Wolfowitz, 1943), Mann-Kendall test (Mann, 1945; Mann-Kendall, 1975), Wilcoxon-Mann-Whitney (Wilcoxon, 1945; Mann and Whitney, 1947), Kruskall-Wallis test (Kruskal, 1952; Kruskal and Wallis, 1952) and Pettitt’s test
(Pettitt, 1979).
The Von Neumann ratio test (Von Neumann, 1941) calculates a ratio of the mean square between successive (year-to-year) differences to the variance, which is closely related to the first-order serial correlation coefficient (Talaee et al., 2014). The calculated value of this ratio is an indicator of the presence of irregularities in the series. This test does not provide the information regarding the date of the discontinuity (Costa and Soares, 2009a) and usually it is used together with other homogeneity tests.
The Wald-Wolfowitz runs test (Wald and Wolfowitz, 1943) is a well-known non-parametric test for randomness. It calculates a statistic based on the sum of the number of changes, by comparing every datum from the time series with the median, over time. This test is sensitive to shifts and trends, but gives little information about the probable dates for breaks. This method is not powerful enough to be used individually in the relative homogeneity analysis and must be supported by graphical analysis so to increase the power of overall analysis, and to obtain the probable date and magnitude of the inhomogeneity, as stated by Tayanç et al. (1998).
16
advantage of not assuming any special form for the data distribution function, while having a power nearly as high as their parametric competitors. For this reason, it is highly recommended by the World Meteorological Organization (WMO) (Mourato et al., 2010).
The Wilcoxon-Mann-Whitney test (Mann and Whitney, 1947; Wilcoxon, 1945) is based in the use of rank order change-point detection (Aguilar et al., 2003). This approach is advisable when the normality of data is in doubt, such as precipitation data. For this variable, normality is easier to achieve in yearly averaged or in accumulated quantities than in monthly data.
The Kruskal-Wallis test (Kruskal, 1952; Kruskal and Wallis, 1952) is used to compare two or more independent groups of data. The Kruskal-Wallis test allows determining if the difference in the average ranks of three or more independent samples is significant. This test verifies if the hypothesis that all the samples came from the same parent population can be safely rejected.
Pettitt’s test (Pettitt, 1979) is a non-parametric rank test that detects single break points. The calculated statistic, derived from the Mann-Whitney, achieves the maximum value for the year with the most likely break point. The test is capable of locating the period where a break may occur, but is more sensitive to breaks in the middle of the time series (Wijngaard et al., 2003).
2.3.2
Classical tests
Double mass analysis (Kohler, 1949), Craddock’s test (Craddock, 1979), Bivariate test (Potter,
1981), and Buishand Range test (Buishand, 1982) are classified as (statistical) classical tests as they correspond to traditional homogenisation techniques.
The Double-mass analysis (Kohler, 1949) was one of the first techniques specifically proposed for homogeneity testing. The double-mass curve method is performed by plotting the cumulative amounts of the station under consideration against the cumulative amounts of a set of neighbouring stations. The plotted points tend to fall along a straight line under conditions of homogeneity. Cumulative deviations from some average value can alternatively be plotted to verify the time series homogeneity. It is only used during the exploratory analysis of the time series (Costa and Soares, 2009a). For precipitation time series, cumulative deviations are preferred, since changes in the mean amount are easier to be recognised (Buishand, 1982).
The Craddock’s test (Craddock, 1979) is a simple statistical method developed to compare annual precipitation records. This test requires a homogeneous reference series or, in some cases, long enough homogeneous sub-periods. It accumulates the normalised differences between the test series and the homogeneous reference series to determine the inhomogeneities (Aguilar et al.,
2003). Craddock’s test is recommended by Venema et al. (2012). This test was included in two
REVIEW AND DISCUSSION OF HOMOGENISATION METHODS FOR CLIMATE DATA
17
Institute for Meteorology and Geodynamics, Austria) and MeteoSwiss (Federal Office of Meteorology and Climatology, Switzerland), respectively (Auer et al., 2005; Begert et al., 2005). Potter (1981) applied the bivariate test, developed by Maronna and Yohai in 1978, to precipitation annual series. This is a test for detecting a single systematic change in the mean of an independent time series, based on a second correlated series which is assumed as unchanged (Aguilar et al.,
2003). Potter’s method generates a test statistic for each data value and an estimate of the
maximum probable offset, or adjustment, for that year (Plummer et al., 1995). It closely resembles the double mass curve analysis (Aguilar et al., 2003).
Buishand (1982) used the cumulative deviations to perform some statistical tests, which were compared with the Von Neumann ratio test. This author concluded that both methods give nearly the same results. The Buishand Range test is more sensitive to breaks in the middle of the time series (Wijngaard et al., 2003).
2.3.3
Regression methods
Three methods using regression models are described: Two-phase regression (Easterling and Peterson, 1995), Multiple linear regression (Vincent, 1998), and the Method of cumulative residuals (Allen et al., 1998).
Easterling and Peterson (1995) developed the Two-phase regression (TPR) model, following the work of Solow (1987) who has constrained two regression functions to meet at the point of the inhomogeneity. These authors modified the previous technique so that the two regression lines do not need to meet at the discontinuity. For a given year (or time unit), one regression line is fitted to the reference series for the previous time interval of that year, and the second regression line is fitted to the second part of the time series. This process is repeated for all the years of the time series. The lowest residual sum of squares between the two regression functions will determine the point of discontinuity.
Ducré-18
Robitaille et al. (2003) classified MLR as one of the most robust homogenisation methods. More recently, efficiency tests have shown that its detection skills are often lower than other objective methods (Domonkos, 2011b).
The Method of cumulative residuals (Allen et al., 1998) provides a way to relate data sets from two weather reference stations. For a given weather station with a homogeneous time series (independent variable), the records of a second station (dependent variable) can be considered to be homogeneous if the cumulative residuals from their simple linear regression model are not biased. This is tested by verifying if the residuals are contained within an ellipsis, which depends on the size of the data set, the standard deviation of the tested sample and the probability used to test the hypothesis (80% is commonly used). Costa and Soares (2006) proposed an extension of the cumulative residuals method that takes into consideration the concurrent relationship between several candidate series from the same climatic region. This technique uses the residuals from a Seemingly Unrelated Regression equations (SUR) model instead of the residuals from a simple linear regression model.
2.3.4
Bayesian approaches
Bayesian methods have a different approach from classical techniques. Through a prior distribution, the Bayesian approach acquires some knowledge about the climate variable being studied. That information and the observations are combined in a posterior information, which is used to make inference about the parameters. Their advantage is the formal use of non-experimental sources of information to complement the posterior probability distribution function for the studied variable, comprising the position of the shifts, which can be multimodal or skewed. After specifying a loss function, an estimate of the shift’s position can be obtained. Several
Bayesian techniques were already used for the homogenisation of climate data series, which are described in this section: Bayesian multiple change-point detection in multiple linear regression (Seidou and Ouarda, 2007), Bayesian change-point in multiple linear regression (Seidou et al., 2007), Bayesian change-point algorithm (Ruggieri, 2013), Bayesian multiple change-points and segmentation algorithm (Hannart and Naveau, 2009), Change-point detection algorithm (Gallagher et al., 2012), and Bayesian Normal Homogeneity Test (Beaulieu et al., 2010).
REVIEW AND DISCUSSION OF HOMOGENISATION METHODS FOR CLIMATE DATA
19
The Bayesian change-point in multiple linear regression (BARE) model (Seidou et al., 2007) was designed to infer the position of a single change-point in the parameters of a multiple linear regression equation. Seidou et al. (2007) considered non informative prior distributions for the regression parameters and the variance. The prior for the change-point position is a uniform distribution. The method can also be applied for multiple change-points using a segmentation approach. Beaulieu et al. (2009) compared BAMS and BARE using synthetic series of total annual precipitation data series from Canada. Both techniques had similar detection skills, but BAMS performed better for the series with multiple shifts.
Ruggieri (2013) introduced a Bayesian Change-point Algorithm, which provides uncertainty estimates both in the number and location of change-points through a probabilistic solution to the multiple change-point problem. Two main differences should be referred, when comparing this method to BAMS: the nature of recursion and the prior distributions on the model parameters. This algorithm follows three steps: calculation of the probability density of the data; forward recursion (dynamic programming) and stochastic back-trace via Bayes rule (by sampling the number of change-points, the locations of change-points and the regression parameters for the interval between adjacent change-points). Ruggieri (2013) studied the performance of this method by analysing the irregularities in annual global surface temperature.
Hannart and Naveau (2009) used Bayesian Decision Theory to minimise a cost function for the detection of multiple change-points, the Bayesian multiple change-point and segmentation algorithm. The method identifies subsequences of the time series that isolate a unique change-point. These authors studied the performance of this method, by comparison with other methods using simulated series, and they also applied the method to annual temperature data from 16 weather stations located in France (1882-2007).
Gallagher et al. (2012) proposed a Bayesian homogenisation method, the Change-point detection algorithm, for daily precipitation series. The model can be described as a two-state Markov chain with periodic dynamics. The chain serves to induce dependence in the daily (precipitation) amounts, having two different states (dry or wet). If the state considered for a specific day is wet, the amount of the precipitation is modelled as a positive random variable with a seasonally dependent mean (amounts are distribution-equivalent, but the distribution is not necessarily the same). This method was used to homogenise daily precipitation data from Alaska and Massachusetts.
20
change-point (metadata or expert knowledge). Beaulieu et al. (2010) applied this test to synthetic series of total annual precipitation in Canada.
2.3.5
Homogenisation procedures
Techniques that were directly proposed as methods for the homogenisation of climate data series are summarised in this section: SNHT – Standard Normality Homogeneity Test (Alexandersson, 1986), SNHT with trend (Alexandersson and Moberg, 1997), MASH – Multiple Analysis of Series for Homogenisation (Szentimrey, 1999), PRODIGE (Caussinus and Mestre, 1996, 2004), Geostatistical simulation approach (Costa et al., 2008a), ACMANT – Adapted Caussinus-Mestre Algorithm for homogenising Networks of Temperature series (Domonkos, 2011c), and ACMANT2 for homogenising daily and monthly precipitation series (Domonkos, 2015). The Standard Normal Homogeneity test (SNHT) (Alexandersson, 1986) is one of the most popular and robust homogenisation methods for climatic variables (Ducré-Robitaille et al., 2003). The application of SNHT begins with the creation of a composite (ratio or difference) series between the station values and some regional reference values assumed homogeneous. This composite series is then standardised. At a given moment, averages are calculated for the previous and the following period of that composite series. If the difference between those averages meets a critical value, a shift is inferred to exist at that moment, and the series is said to be inhomogeneous (Ducré-Robitaille et al., 2003).
Later, Alexandersson and Moberg (1997) improved the SNHT method to extend its detection to trends as well. In this innovative SNHT with trend, the alternative hypothesis is that the change of the mean level is gradual, starting and ending at arbitrary points of time, a and b. A test value is computed for all combinations of a and b. The pair that maximises this value has the highest likelihood for being the starting and ending of the trend section. When an inhomogeneity occurs as a sudden shift, such inhomogeneity will be determined by the trend test to be an abrupt change. SNHT with trend is suitable for gradual trends in climate time series, like the increasing of the urban heat island effect (Moberg and Alexandersson, 1997).
REVIEW AND DISCUSSION OF HOMOGENISATION METHODS FOR CLIMATE DATA
21
and shifts, confidence intervals are also determined. MASH has turned into a software, where metadata can be used automatically to detect inhomogeneities. This method is included in the HOCLIS-system (Auer et al., 2005). Since MASH v3.01, it is possible to homogenise daily datasets (Szentimrey, 2006b).
Caussinus and Mestre (1996, 2004) proposed a new multiple breakpoint technique named PRODIGE, which is based on penalised likelihood methods. The methodology uses a pairwise comparison for preselecting a set of accidents, which are considered within the framework of a multidimensional approach. This method is based on the principle that the series is reliable between two change-points. Those sections will be used as reference series. Instead of comparing a given series with a reference series whose definition is problematic, the comparisons are performed with all other series, by a series of differences. The series of differences is tested against discontinuities through the Caussinus and Lyazrhi (1997) technique. If a change-point (or an outlier) is constantly detected in all the difference series, it can be attributed to the candidate station. The second step of this method is an overall detection and correction. Those two steps are performed by using moving neighbourhoods. The size and the shape of these neighbourhoods are a compromise between the knowledge of the climatologist about the regional climate and the necessity to have enough data, in order to ensure good estimation. Another technique was later developed on basis of PRODIGE, named ACMANT.
The Geostatistical simulation approach proposed by Costa et al. (2008a) can be summarised as follows (Costa and Soares, 2009a). The Direct Sequential Simulation (DSS) algorithm (Soares, 2001) generates realisations of the climate variable through the resampling of the global probability density function (pdf), using the local mean and variance of the candidate station, which are estimated through a spatiotemporal model. The local pdf for each time instant is used to verify the existence of irregularities: a breakpoint is identified whenever the interval of a specified probability p centred in the local pdf, does not contain the observed (real) value of the candidate station. When an irregularity is identified, the time series can be adjusted by replacing the inhomogeneous record by the mean (or the median) of the pdfs calculated at the candidate station location for the inhomogeneous periods.
22
2011d). Recently, Domonkos (2015) proposed a new unit for the homogenisation of monthly or daily precipitation series, ACMANT2. This new version takes into consideration the climatic regions of snowy winters, by making a distinction between rainy season and snowy season and by searching the seasonal inhomogeneities with bivariate detection. Another main difference from the previous version of ACMANT is that outlier filtering and detection of short-term inhomogeneities are not included in the homogenisation of precipitation series because, in this case, due to the lack of spatial consistency at short-time scale, a possible identified break is very likely to be a true local extreme and not an erroneous precipitation record. Currently, ACMANT and its unit ACMANT2 are a homogenisation software package.
2.4
Homogenisation software packages
Lately, some of the homogenisation methods already described in the previous sections were developed into software, in order to diminish the time consumed during the homogenisation process and to minimise the interaction of users. The examples described are: Climatol (Guijarro,
2006), RHTest (Wang, 2008), AnClim and ProClimDB (Štěpánek, 2008a, 2008b), USHCN
(Menne and Williams Jr., 2009), and HOMER (Mestre et al., 2013).
Climatol (Guijarro, 2006) is a set of routines for climatological applications than run under the cross-platform statistical programming language R. Although it may be applied to daily data, it is generally used in the homogenisation of monthly series. This computational application compares each candidate series with a reference series. Once the reference series has been computed, it can be used to determine which variations in the candidate series are due to the climate variability and which are real inhomogeneities that should be corrected. Climatol avoids the use of regression techniques and enables the use of data from surrounding stations when there is no common period of observation. The comparison between the candidate series and their estimated references allows the detection of point errors, shifts and trends through standard statistical tests. The graphical representations of the results can also be shown. Missing values from the candidate series can be directly replaced by the computed reference values. The application of the method to a dense monthly database indicates the importance of using an iterative strategy, thereby detecting and correcting only the coarser errors in the first place, and leaving the less prominent ones to the following iterations. Literature refers this method as robust and simple. However, the final decision on which inhomogeneities to correct must be complemented with visual inspection of the graphical representations.