Setembro 2014
Rui Dinis Teodoro Candeias
Licenciatura em Engenharia Biomédica
Evaluation of motor neuron excitability
by CMAP scanning with modulated current
Dissertação para obtenção do Grau de Mestre em
Engenharia Biomédica
Orientador:
Dr. Hugo Gamboa, Professor Auxiliar, DF
–
FCT/UNL
Coordenador:
Eng. Tiago Araújo, Doutorando, DF
–
FCT/UNL
Setembro 2014
Rui Dinis Teodoro Candeias
Licenciatura em Engenharia Biomédica
Evaluation of motor neuron excitability
by CMAP scanning with modulated current
Dissertação para obtenção do Grau de Mestre em Engenharia Biomédica
Orientador: Dr. Hugo Gamboa, Professor Auxiliar, Departamento de Física da Faculdade de Ciências e Tecnologia da Universidade Nova de Lisboa
Coordenador: Eng. Tiago Araújo, Doutorando, Departamento de Física da Faculdade de Ciências e Tecnologia da Universidade Nova de Lisboa
Constituição do júri
Presidente: Prof. Doutor Mário Secca, Professor Auxiliar, Departamento de Física da Faculdade de Ciências e Tecnologia da Universidade Nova de Lisboa
Arguente: Prof. Doutora Carla Quintão, Professor Auxiliar, Departamento de Física da Faculdade de Ciências e Tecnologia da Universidade Nova de Lisboa
Evaluation of motor neuron excitability by CMAP scanning with modulated current
Copyright © 2014. Todos os direitos reservados. Rui Dinis Teodoro Candeias, Faculdade de Ciências e Tecnologia e Universidade Nova de Lisboa.
Acknowledgements
I would like to express my thanks to my supervisor Prof. Gamboa, my coordinator Tiago and Neuza of PLUX, for all the help and support in this work.
I’d also like to thank to Prof. Mamede for his collaboration and also to the test subjects of the electrostimulation acquisitions.
Abstract
It is important to have better evaluation and understanding of the motor neuron physiology, with the goal to early and objectively diagnose and treat patients with neurodegenerative pathologies. The Compound Muscle Action Potential (CMAP) scan is a non-invasive diagnosis technique for neurodegenerative pathologies, such as ALS, and enables a quick analysis of the muscle action potentials in response to motor nerve stimulation. This work aims to study the influence of different pulse modulated waveforms in peripheral nerve excitability by CMAP scan technique on healthy subjects.
A total of 13 healthy subjects were submitted to the same test. The stimuli were applied in the medium nerve on the right wrist and electromyography signal collected on the Abductor Pollicis Brevis (APB) muscle surface on the right thumb. Stimulation was performed with an increasing intensities range from 4 to 30 mA, with varying steps, 3 stimuli per step. The procedure was repeated 4 times per subject, each repetition using a different single pulse stimulation waveform: monophasic square, monophasic triangular, monophasic quadratic and biphasic square. Results were retrieved from the averaging of the stimuli on each current intensity step. The square pulse needs less current intensity to generate the same response amplitude regarding the other waves and presents a more steep curve slope and this effect is gradually decreasing for the triangular and quadratic pulse, respectively, being the difference even more evident regarding the biphasic pulse. The control of the waveform stimulation pulse allows varying the stimulus-response curve slope.
Resumo
É importante haver uma melhor avaliação e compreensão da fisiologia neuromotora, com o objectivo de diagnosticar precocemente e objectivamente pacientes com doenças neurodegenerativas. O CMAP Scan é uma técnica de diagnóstico não-invasiva para doenças neurodegenerativas, como a ELA, e permite uma análise rápida dos potenciais de acção do músculo em resposta à estimulação neuromotora. Este trabalho pretende estudar a influência de diferentes tipos de onda com pulso de corrente modelado na excitabilidade do nervo periférico através da técnica de CMAP scan.
No estudo efectuado em pessoas saudáveis, um total de 13 sujeitos foram submetidos ao mesmo teste. Os estímulos foram aplicados no nervo mediano do pulso direito e o sinal de electromiografia recolhido na superfície muscular do APB do polegar. A estimulação foi efectuada com um intervalo crescente de intensidades dos 4 aos 30 mA, distribuídos em vários passos, 3 estímulos aplicados por passo. O procedimento foi repetido 4 vezes por sujeito, cada repetição efectuada usando um tipo diferente de pulso de onda: formas de onda quadrada, triangular e quadráticas monofásicas e uma forma de onda quadrada mas bifásica. Os resultados foram recolhidos efectuando a media de todos os estímulos em cada incremento de corrente. A onda quadrada monofásica necessita de menor intensidade de corrente do estímulo para gerar a mesma amplitude de resposta em relação às outras ondas e apresenta um declive da curva mais acentuado e este efeito é gradualmente decrescente para as ondas triangular e quadrática, respectivamente, sendo a diferença ainda mais evidente comparativamente à onda bifásica. O controlo da forma do pulso de onda permite variar a inclinação da curva representativa da resposta-estímulo.
Index
Acknowledgements ... vii
Abstract ... ix
Resumo ... xi
Figure list ... xv
Table list ... xvii
Acronyms ... xix
1. Introduction ...1
1.1. Motivation ...1
1.2. State of the Art ...2
1.3. Objective ...4
1.4. Thesis overview ...5
2. Theoretical Background ...7
2.1. Eletromyography (EMG) ...7
2.2 Electrical Nerve Stimulation ...9
2.3 Peripheral Nervous System, Motor Unit and Action Potential ... 10
2.4 Compound Muscle Action Potential Scan Technique ... 14
2.5 Amyotrophic Lateral Sclerosis ... 16
2.7 Electrostimulation concepts ... 17
3. Methods ... 19
3.1 Protocol optimization ... 19
3.2 Subjects ... 21
3.3 Stimulation and acquisition ... 22
3.4 Processing ... 25
4. Results ... 29
5. Discussion ... 35
5.1 Results analysis ... 35
Figure list
1.1.A CMAP scan of healthy subject ………..………..…...…………...4
1.1.B CMAP scan of ALS patient ………..…..………..……..………4
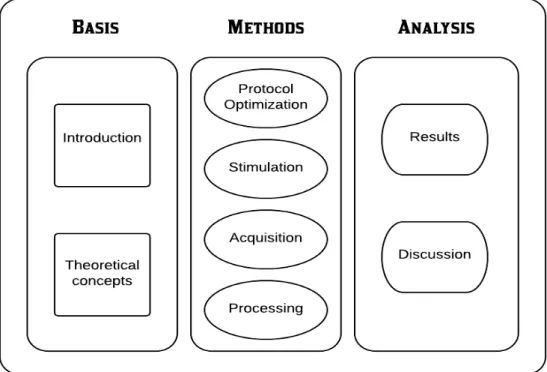
1.2 Schematic thesis overview ..………...………...……..………..……...5
2.1 Representation of an EMG signal ………...…………...………..7
2.2 Examples of different types of waveforms ………..…….……..…….….….10
2.3 Motor Unit schematic ………...……….…….…..11
2.4 Cell membrane potential variation occurred during an action potential ……….…….….12
2.5.A Response with stimulus of 8mA ………...….…………..……….…….15
2.5.B Representation of a CMAP scan ………...………...….15
3.1 Charge equalization: A - Square B - Biphasic square C - Triangular D - Quadratic ...21
3.2 Electrodes positioning schematic …...….…….……….…………22
3.3 Hand fixation schematic ………...……….…….……..……….…...23
3.4 Electrodes positioning schematic …...….…….……….…....…24
3.5 Acquisition flowchart ………...………...…….…...24
3.6 Processing schematic ….………..……….…....….25
3.7 Detection of absolute amplitudes of the response generated ...……….….….26
3.8 Collection of the points necessary to generate the CMAP scan ….…… .………...….26
3.9 Interpolation effectuated to generate the CMAP scan ……….………...….27
3.10 Detection of the excitability parameters S5, S50 and S95 ……..……….……….27
3.11 CMAP scan representation with triangular pulse ……….………..….28
4.1 CMAP with all used waveforms .………….……….………..………...29
4.2 CMAP scan with all used waveforms ………...…………...30
4.3 CMAP scan representation with monophasic and biphasic waveforms ………….……34
xvi
Table list
Table 4.1 S95 response amplitudes.. ... .31
Table 4.2 Waveforms slope differences.. ... .31
Table 4.3 S5 current intensities.. ... 32
Table 4.4 Waveforms current intensity differences.. ... 33
Acronyms
ALS – Amyotrophic Lateral Sclerosis CMAP – Compound Muscle Action Potential sEMG – surface Electromyography
ES – Electrical Stimulation
PNS – Peripheral Nerve Stimulation
TENS – Transcutaneous Electrical Nerve Stimulation PeNS – Peripheral Nervous system
SI – Stimulus Intensity MU – Motor Unit
LMN – Lower Motor Neuron UMN – Upper Motor Neuron AP – Action Potential
1
1.
Introduction
1.1. Motivation
In the last years, there is a growing scientific and clinical interest on objective evaluation of the motor capability and better understanding of the motor neuron physiology, with the goal to early and objectively diagnose and treat patients with neurodegenerative pathologies.
Amyotrophic Lateral Sclerosis (ALS), also known as Motor Neuron Disease or commonly Lou Gehrig’s disease, is one of the major neurodegenerative diseases, characterized by being a progressive incurable motor neuron disorder and also fatal. Population-based studies in Europe estimate that the occurrence of ALS is 2-16 per 100 000 person-year. Patients with ALS are diagnosed when there is already extensive motor neuron degeneration, since no definitive diagnostic test or biomarker for ALS is available at the moment, and neurologists only rely on clinical indicators for diagnosis [1].
The Compound Muscle Action Potential (CMAP) scan is a non-invasive diagnosis technique for neurodegenerative pathologies, such as ALS. It enables a quick analysis of the muscle action potentials in response to motor nerve stimulation, by electrical stimulation applied on the surface of the motor nerve and response evaluation by surface EMG at muscle level. It can be used as a tool for a better understanding of the neuromuscular excitability, allowing the study and development of diagnosis protocols for patients with neurodegenerative disorders [3].
This work aims to study the influence of pulse modulated waveforms in peripheral nerve stimulation, through CMAP scan technique.
2
1.2. State of the Art
Electrical Stimulation (ES) is the activation of the nerve/muscle, applying artificial stimulation through an electronic device directly on the nerve or muscle. Nerve response is evaluated through EMG, with electrodes placed on the surface of the muscle on study. Varying the intensity of the stimuli applied, it is possible to obtain a graphical representation of the evoked action potential of the muscle, in a sigmoid graphic form, that corresponds to the stimulus-response curve and composes the CMAP scan [9].
The CMAP scan technique has been studied as a non-invasive diagnostic and monitoring tool to neurodegenerative disorders, since it gives information about reinnervation processes, number of functional motor units and neuromuscular activity. To be used as a clinical tool, stimulation parameters must be standardized and quantified to enable uniform collection and comparison of data [4].
Several studies have been made recently, in order to verify the potentiality of this technique, investigating the influence of different parameters in the quality of the CMAP scan.
Maathuis et al.[4] studied its reproducibility on healthy patients in several parameters, like the maximum CMAP, S5 (the stimulus intensity that elicited 5% of the maximum CMAP), S50 (stimulus intensity that elicited 50% of the maximum CMAP), S95 (stimulus intensity that elicited 95% of the maximum CMAP), SI range (S95 – S5) and step percentage (steps are clear visible jumps in CMAP amplitude within consecutive stimuli). It was concluded that both inter-observer reproducibility and different-day reproducibility were good for all tested parameters, with evidence that this technique is suitable to detect physiological alterations in the considered parameters [4].
Henderson et al.[9] examined the differences of the stimulus-intensity curve and the variability of the CMAP scan between healthy and ALS subjects. It was showed that there is a significant difference on the CMAP scan, regarding CMAP variability and step number and size, as ALS patients present more and larger steps on the stimulus-response curve than healthy controls, as it is sown in figure 1. The presence of several steps indicates loss of motor units and reinnervation. A CMAP decrement was defined as difference greater than 10% between the first and fifth CMAP negative peak amplitude [9].
3 frequency has no influence on the CMAP variables in healthy controls, although high frequency augments the chance of decrements on the CMAP, so low frequency stimulation is advised. On the referred study, 2 Hz stimulation appeared to present better results concerning recording time and reducing movement artefacts and decrements. Experiments regarding stimuli number recommended that around 500 stimuli give enough detail in the stimulus-response curve, without excessive recording time (which increases movement risk and patient discomfort) [3].
A study has shown that decrement in motor response, due to repetitive nerve stimulation, in ALS patients is different between median and ulnar nerves, as muscle wasting preferentially affects the thenar muscles rather than the hypothenar muscles in these patients. The greater CMAP decrement in the median nerve was related to preferential involvement of the Abductor Pollicis Brevis (APB) in the pathophysiology of ALS [10].
During another work, Maathuis[3] also noticed that downwards recording direction was better tolerated by patients. Fixation of the thumb is highly advised, since it shortens the decrement size and limits the change in muscle fibre conduction velocity, enhancing the CMAP scan [3]. Mamede de Carvalho et al.[11] evaluated clinical neurophysiological methods of diagnosis to measure disease progress in ALS. Review of the CMAP technique acknowledged that CMAP amplitude showed the combined effects of denervation, muscle atrophy, compensatory reinnervation and also constitutes an indirect measure of the number of innervated fibres. CMAP amplitude has significant correlation with muscle strength, motor unit number estimation (MUNE) and functional disability in ALS. It was concluded that MUNE, M-Wave amplitude and Neurophysiological Index are reliable and sensitive to be used in clinical trials in ALS patients [11].
Maathuis et al.[21] refers that LMN disease progression electrophysiological features should be evaluated considering three pathophysiological aspects of the disease progression (axonal/MU loss, reinnervation and remaining number of functioning muscle fibres). All these aspects can be assessed in the CMAP scan [21].
4
Figure1.1A: CMAP scan of a healthy individual, with the stimulus-response curve obtained with 500 stimuli. The horizontal line indicates the CMAP maximum amplitude while the vertical lines refer to S5,S50 and S95. These indicators correspond to the stimulus intensity that elicited 5%, 50% and 95% of the maximum CMAP, respectively. Figure 1.1B: CMAP scan of an ALS patient with 76 years old, six months after being diagnosed. Differences in the CMAP scan between the healthy and the ALS patient are visible because of several steps observed in the ALS CMAP scan and also the decrement in maximum amplitude. Adapted from [3].
1.3. Objective
The main goal of this work was to study the influence of modulated waveforms in the excitability of the peripheral nerve, through the CMAP scan technique.
5
1.4. Thesis overview
Tobegin the preparation of the thesis, an introductory study to biosignals acquisition tools and processing was necessary. In order to process the acquired signals and compute the CMAP scans, Python language was used. An extensive research was conducted regarding the state of the art on the used methodologies and also literature revision concerning the main theoretical concepts.
An electrical stimulation protocol was defined, evaluating the parameters for optimal stimulation, and using different waveforms to study its influence on reflex response of the nervous system. Electrical stimulation using different types of waveforms was applied in the median nerve on the wrist and muscular response on the APB muscle of the thumb evaluated. Acquisition of biosignals was performed, as subjects electromyography signals were recorded, while being submitted to electrostimulation.
In order to extract the desired features and enable the proposed study, data processing algorithms were designed and developed in Python. Obtained results were analysed and influence of the parameters in study discussed. Writing of a scientific paper for a conference was effectuated.
The following figure presents a schematic of the work plan executed for this thesis.
7
2.
Theoretical Background
In this chapter an exposition of the main theoretical concepts will be presented. Surface EMG, electrical nerve stimulation and the CMAP scan technique will be approached. A brief description of the peripheral nervous system, motor units, concepts of electrical stimulation and amyotrophic lateral sclerosis will also be discussed.
2.1.
Eletromyography (EMG)
EMG stands for Electromyography, which is the recording of the electrical activity created on the muscle excitable cell membrane during muscular contraction. The obtained signal is the spatial and temporal algebraic sum of all the detected signals within a certain area and represents voltage as a function of time. It is an important method to analyse muscular functioning, expressing in real time, muscular activation during movement and its intensity and duration [22]. It reflects neuromuscular activity and propagation of action potentials along muscle fibres, as the nervous system controls muscle activity. Besides that, it depends of the muscle anatomical and physiological properties and also acquires noise travelling through different tissues, making it a complicated signal to analyse. The signals can be analysed to detect clinical abnormalities, activation level, recruitment order or to analyse the movement biomechanics. From EMG it is possible to determine whether a particular muscle is responding appropriately to stimulation and whether a muscle remains inactive when not stimulated. One of the reasons for the interest in EMG signal analysis is in clinical diagnosis for neurodegenerative pathologies and biomedical applications as rehabilitation of motor disability [12].
8
The signals can be acquired attaching surface electrodes to the skin over the target muscle or by needle electrodes inserted invasively into the muscles tissue. Surface EMG measures overall action potentials of the muscle fibres under the skin along the entire recorded area underneath the electrodes, while needle electrodes measure action potentials from a small number of fibres and may not be representative of the entire muscle involved. In surface EMG two electrodes are placed on the skin over the muscle region to be analysed and the difference of potential between them is acquired and amplified [14].
In this work surface EMG, which is a non-invasive EMG technique, will be used. It will enable the analysis of motor unit properties that are difficult to measure with invasive technology, like muscle fibre conduction velocity, and provides more information related to the number of detectable motor units (which is a limitation of invasive methods). The sEMG signal can be spread into motor unit action potentials and gives information about neuromuscular activity and membrane fibre properties [13]. On the following figure it is shown an example of an EMG signal.
Figure 2.1: Representation of an EMG signal
Electrodes placement is important in order to acquire EMG signal, since it can occur interference due to neighbour muscles electrical activity, also referred as cross-talk. Other properties like the signal-to-noise ratio and the common mode rejection ratio can influence the quality of the EMG signal, as higher ratios correspond to better signal quality [14].
9
2.2
Electrical Nerve Stimulation
Peripheral Nerve Stimulation (PNS) consists in stimulating the peripheral nervous system, applying electrical current to activate a specific nerve. Electrical Stimulation (ES) on the selected nerve can be performed transcutaneously (transcutaneous electrical nerve stimulation – TENS), percutaneously with temporary electrodes (percutaneous electrical nerve stimulation - PENS) and with surgically or percutaneously implanted electrode [8].
TENS is an external neuromodulation modality, in which electrical current is delivered through intact skin along the path of the underlying chosen nerve. Usually, it is utilised as a non-invasive neuromodulation approach together with other physical therapy modalities and constitutes an alternative to more invasive methods. In contemporary medical practice, it is considered the most common application of peripheral neuromodulation. Electrical stimulation of peripheral nerve is an established modality in treatment of chronic pain and there have been recent reviews showing evidence in application of TENS for treatment of neuropathic and cancer pain [8]. Activation of neuromuscular tissue by electrical stimulation requires a minimum of two electrodes in order to produce a current flow. Electrodes are normally arranged in a monopolar or bipolar configuration. On bipolar configuration an electrode, usually named the active electrode, is placed near the peripheral nerve to be stimulated [15].
Stimulation is delivered as a waveform of electrical current pulses, which is characterized by pulse frequency, amplitude and duration. Suitable electrical stimuli can elicit action potentials in the innervating axons of the nerve, and the strength of the resultant muscle contraction can be controlled by modulating the stimulus parameters [15].
Also referred as transcutaneous systems, surface systems use electrodes that are connected with flexible leads to a stimulator. These electrodes are placed on the skin over the nerve or over the “motor points” of muscle to be activated. Advantages of surface systems are non-invasive and simple technologically, making them easily applied, reversible, relatively inexpensive, and good for utilisation in clinical and therapeutic applications [15].
10
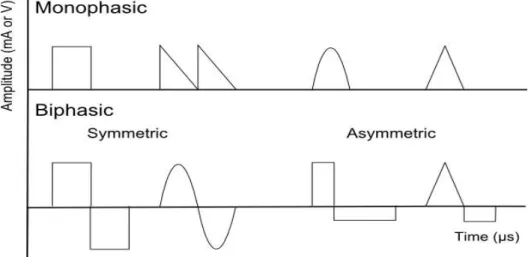
Figure 2.2: Examples of different types of waveforms. The monophasic square and the biphasic square types are some of the waveforms used in this work and are represented on the left.
2.3
Peripheral Nervous System, Motor Unit and Action
Potential
The nervous system can be divided into Central Nervous System (CNS) and Peripheral Nervous System (PeNS).
Central components are nerves entirely contained within the brain and spinal cord. Central nervous system influences muscle activity through two sets of neurons: Upper Motor Neuron (UMN) and Lower Motor Neuron (LMN). They can be classified according to the muscle fibre type they innervate: alpha motor neurons, which innervate extrafusal muscle fibres and are responsible for muscle contraction, and gamma motor neurons, which innervate intrafusal muscle fibres. Peripheral components are nerves originated in the brain or spinal cord and ended peripherally, as well as cranial and spinal nerves. The Peripheral Nervous System includes motor, sensory, sympathetic and parasympathetic neurons, with the majority of nerves comprising a mixture of these types of neurons. Motor nerves are originated in the anterior horn of the spinal cord [6,7].
11 brainstem to a specific nerve while LMNs carry the information from UMNs to muscle fibres. The alpha-motor neurons are the largest neurons in the spinal cord, with myelinated axons that exit the spinal cord through the ventral roots and travel in peripheral nerves to innervate muscles. Each muscle fibre is innervated by only one motor neuron but one motor neuron innervates many muscle fibres, all of the same fibre type, as its axon branches in the muscle. One motor neuron along with all the skeletal muscle fibres it innervates is named Motor Unit (MU), like it is shown on figure 2.3. Muscle fibres in different muscles are grouped into basic types specialised for different functions and there are two major types of muscle fibres: Type I - high level of vascularization, slow contraction and high fatigue resistance; Type II – low level of vascularization, rapid and strong contraction. As physiological properties of motor neurons and the muscle fibres they innervate are related, Motor Units cluster into basic types based on properties of twitch speed, amount of force produced and fatigability. For most movements, MUs are recruited in orderly sequence, based on the size of the motor neuron. According to this, MUs that produce the smallest amount of force will be the first to begin firing, and MUs that produce greater force will be progressively recruited, as the muscle makes progressively stronger contractions. Motor neurons innervating different muscles can be activated with great precision by different sources that together determine the degree of activation and the timing of the motor neurons of a given muscle [6,7].
Figure 2.3: Motor Unit schematic. A Motor Unit is composed by a motor neuron from the spinal cord that innervates the neuromuscular junctions of different muscle fibres.
12
potentials. When a motor neuron receives an excitable signal, an action potential reaches muscles fibres innervated by it through one terminal branch of the axon. The combination of these APs along all the muscle fibres of a single MU is called the Motor Unit Action Potential (MUAP). If the nerve impulse arrives more often, the intensity of muscle contraction is greater. Muscle strength is associated to mechanical summation: as a result of higher stimulation regularity, the generated muscle force increases [14].
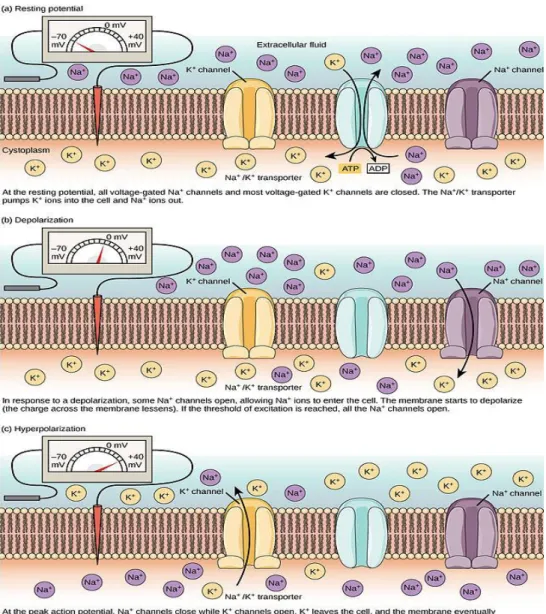
Figure 2.4: Cell membrane potential variation occurred during an action potential. The variation is due to the ionic flux of sodium and potassium through the membrane cell, which is different when the cell is resting (a), when occurs the depolarization (b), and at peak potential (c), which is followed by a period of hyperpolarization.
13 difference by being more permeable to the flux of potassium, which passes through the membrane to the cell exterior, in favour of the concentration gradient, generating a negative cell electrical potential. For the nerves and fibres of the smooth muscle, the value of the resting potential is about -70mV. The action potential translates on an electrical potential wave that goes through the membrane and revert its potential from -70 to +30 mV, in approximately 1ms. The membrane action potential value which generates an action potential is known as excitability threshold. The nervous impulse is initiated by the membrane depolarization due to chemical unbalance or by a perturbation like an electrical impulse. Depolarization above excitability threshold provokes the activation of the sodium channels in the cell membrane, which allows passing of sodium by diffusion to the cell interior, in favour of the concentration gradient, which rapidly revert the cell membrane negative polarity. It also provokes consequent activation of the potassium channels (and inactivation of the sodium channels), which allows the influx of potassium ions, and the potential inside the cell decreases [29]. After this phase, there is a hyperpolarization period, which is a change in a cell’s membrane potential that makes it more negative and inhibits action potentials by increasing the stimulus required to move the membrane potential to the action potential threshold. Hyperpolarization is important in the transmission of information as it assures the signal is propagated in one direction, since it prevents any stimulus already sent up an axon from triggering another action potential in the opposite direction [30].
Functional Electrical Stimulation (FES) applications for motor function operate under the principle that electrical stimulation generally activates nerve rather than muscle, because the threshold charge for producing muscle fibre action potentials is much greater that the threshold for producing neurons action potentials. Electrical current pulses applied to nerves are able to produce Action Potentials (AP). The active electrode creates a localized electric field that depolarizes cell membranes of neighbour neurons. When the depolarization achieves a certain threshold, produces an action potential which is propagated in both directions away from the stimulus region. APs propagating proximally in the peripheral nerves axons will be annihilated at the cell body, and APs propagating distally will be transmitted across the neuromuscular junction causing the contraction of muscle fibres. A single motor unit, with sufficient stimulus, will induce all the skeletal muscle fibres it innervates to contract [16].
Information transmission on the nervous system is due to the propagation of the action potentials over the length of the nervous fibre. According to the propagation on different nervous fibres, the velocity of the nervous impulse varies also and normally the propagation velocity is proportional to the diameter of the nervous fibre. The higher the propagation velocity, the higher the length of the nervous fibre depolarized in each period [31].
14
2.4
Compound Muscle Action Potential Scan Technique
The Compound Muscle Action Potential (CMAP) scan can be used as a diagnostic and monitoring tool for neurodegenerative disorders, as it permits visualization and quantification of disease progression in a muscle with Motor Neuron Disease, such as ALS, like referred by Maathuis et al. [21]. The CMAP scan is a non-invasive electrodiagnostic technique, which records the electrical activity of a muscle in response to repetitive transcutaneous stimuli of motor nerve. Stimulus is applied by an electrostimulator positioned on the surface of the motor nerve in analysis and his response evaluated by surface EMG at the muscle to observe. Each Motor Unit (MU) of muscles has a different Stimulus Intensity (SI) at which it is activated, which means that MUs have different thresholds. If stimulus intensity is gradually increased, from subthreshold to supramaximal values, it will successively activate all of the MUs in the muscle. Making the plot of the CMAP amplitudes versus the stimuli intensities, results in a stimulus-response sigmoid curve, thus obtaining the CMAP scan [32].
The CMAP is recorded using a differential amplifier. The three electrodes connected to the amplifier are usually called active, reference, and ground electrodes. For CMAP recordings the active electrode is placed over the muscle belly, whereas the reference electrode is at the tendon or at other locations off the muscle. Conversely, it is also assumed that the CMAP is composed of signal recorded by the active electrode, as a nearfield potential, generated by muscle fibres that are immediately under the electrode [24].
If made with enough stimuli and therefore a high resolution, the stimulus-response curve provides information not available through conventional methods. For instance, it enables identification and quantification of steps, which are clearly visible size differences in the CMAP amplitudes between consecutive stimuli. These amplitude differences increase with stimulus intensity, which are originated by the firing of large and newly recruited motor units. Henderson et al. showed that patients with ALS had significant differences in the steps and CMAP variability in comparison with healthy controls [9].
15
Figure 2.5.A: Response with stimulus of 8mA. The electrical stimulus marked at 0ms provokes the contraction of the thumb, whose response amplitude is above represented, with a stimulation intensity of 8mA. Figure 2.5.B: Representation of a CMAP scan. When stimulus intensity is gradually increased from subthreshold to supramaximal values, all the MUs in the muscle are recruited and the plot of the CMAP amplitude versus stimulus intensity results in the CMAP scan.
The CMAP scan also provides information on nerve excitability since an increase in SI corresponds to an increase in the recorded CMAP, depending on the excitability of individual Motor Units. The excitability parameters of the CMAP scan are the stimulus intensity that elicits 5%, 50% and 95% of the maximum CMAP - S5, S50 and S95 - and the range between S5 and S95 [33].
In Lower Motor Neuron degeneration, as in amyotrophic lateral sclerosis, occurs loss of Motor Units, subsequent reinnervation and, eventually, muscle fibre loss. Because of collateral reinnervation, the symptoms of motor neuron diseases (MND) like muscle weakness develop late during the disease and are not aligned with the actual disease progression measured considering loss of motor neurons. Before muscle strength decreasing is noticed, up to half of the MUs may be lost [21].
Maathuis refers that LMN disease progression electrophysiological features should be evaluated considering three pathophysiological aspects of the disease progression - axonal/MU loss, reinnervation and remaining number of functioning muscle fibres. All these aspects can be assessed in the CMAP scan [21].
16
tool, the effect of the stimulus settings on the CMAP scan and its quantification must be defined, to enable standardized collection and comparison of CMAP scan data [3,4].
2.5
Amyotrophic Lateral Sclerosis
ALS is a fatal neurodegenerative disease of the human motor system. Its clinical features indicate degeneration of motor neurons at all levels, with destruction of layer V pyramidal neurons from the motor cortex to the anterior horn of the spinal cord. Those features include both Upper Motor Neuron and Lower Motor Neuron physical degeneration signs in multiple neuronal regions: bulbar, cervical, thoracic and lumbar [2].
ALS is a devastating disorder with yet uncertain pathogenesis, rapid progression and fatal, as 50% of the patients die in less than 3 years of symptom onset and about 20% survives 5 to 10 years after symptom onset. Survival in patients with ALS is dependent on several factors, which comprise clinical presentation (phenotype), rate of disease progression, early presence of respiratory failure and nutritional status of the patients [1,2].
Many causal and pathogenic theories have been proposed for ALS over the years, but it still remains poorly understood in terms of causal hypothesis. Some factors can increase the risk of developing ALS such as environmental factors, toxic risk factors, family history, tabacco, neurotoxins, consanguinity and genetic mutations with the copper/zinc superoxide dismutase considered the major one. Recent studies also targeted glutamate-induced excitoxicity, dysregulation of intracellular calcium, autophagy, structural abnormalities of mitochondria, dysfunction of the sodium/potassium ion pump, axonal transport defects and protein aggregation as other additional pathogenic hypotheses [1,2].
There are some prognostic indicators, such as increased age of onset, bulbar onset, low forced vital capacity and short time from first symptom to presentation of disease. The symptoms can be different concerning the neurological regions affected but some common features observed are rapidly progressive weakness, muscle atrophy and spasticity, difficulties in breathing (dyspnea), swallowing (dysphagia) and speaking (dysarthria). All these can greatly diminish the life quality of patients, as they tend to lose the ability to control voluntary movements [1].
17 UMN degeneration, iii) progressive spread of symptoms within a region or to other regions; along with: iv) absence of electrophysiological or pathological evidence of other disease processes, v) absence of neuroimaging evidence of other diseases. When ALS is considered, patients should have electrophysiological studies performed to confirm LMN dysfunction in clinically uninvolved regions and exclude other pathophysiological processes [5].
In terms of medicine, just an inhibitor of glutamate neurotransmitter (Riluzole) has been licensed as disease-modifying for ALS, which extends the life of the patients by 3 to 6 months. Since this disorder is incurable, patients are administered with drugs that can relieve some symptoms and help cope with pain [2].
2.7
Electrostimulation concepts
Current is applied through the use of stimulation electrodes and the selection of the electrode depends of the application desired. This selection has to consider the electrode type, its dimensions and the anatomical positioning required. The electrodes can be self-adhesive, metal or conductive rubber. The self-adhesive electrodes were the ones used in this work, since they are easy to apply and don’t need fixation, while ensuring good electrical contact along all contact surface of the electrode. The type and location of the electrodes influence the dimensions of the selected electrodes and larger electrodes result in a lower current density by area. The electrode positioning defines the larger current density local and the specific positions depend on the stimulation objective. For instance, if it is intended to stimulate an innervated muscle, the electrode positioning must assure that the nerve responsible for the muscle contraction is on the current pathway (over the nervous trunk or the motor point of the muscle or on a muscle termination). One of the most common electrode configurations used is the bipolar configuration, in which the current floats alternatively on both ways and uses two equal sized electrodes positioned over each of the terminations of the nerve or muscle to stimulate [26,27].
18
(mA) or Volts (V), which expresses the stimulation intensity that activates the fibres and the consequent response amplitude.[26]
The pulse duration or pulse width is the duration of the output waveform pulse at 50% of maximum amplitude (usually represented in microseconds (µs)). This parameter is important as it influences the current amplitude necessary to originate an action potential. If the stimulation time is higher than a few hundreds of microseconds there is an event of accommodation to the pulse waveform, which implies that higher current intensity is needed to elicit the action potential. The pulse time instant is also to consider as during the refractory period pulses will not elicit an action potential, unless with high intensity stimulus [25].
19
3.
Methods
In this chapter it will be explained the biosignals collection from the group of subjects, the acquisition protocol and its optimization. It will also be exposed the signal processing applied to analyse the data acquired to evaluate the influence of the parameters in study.
3.1
Protocol optimization
20
some subjects. Number of stimuli, incremental steps and stimulation intensity range were tested and reduced to prevent excessive test duration but at the same time to allow obtaining a graphic with enough resolution of the stimuli-response curve for the study.
Electrode positioning was also subject to testing, with different positioning of stimulation electrodes and acquisition electrodes experimented, in order to allow collecting a good signal with high stimulus-response amplitude and definition of the CMAP scan curve. A short protocol was developed in order to test the response obtained with the different positioning, without having to perform the whole test, making it simpler for tests regarding the optimal positioning. Besides the acquisition and processing scripts, another script was made, which had the functions that generated the different types of waveforms according to determined amplitude and regarding the pulse-width time. It encompassed also the function responsible for the charge equalization between all waveforms, which calculated the pulse-width time necessary for a determined waveform to generate the same amplitude of the other waveforms, in order to equalize the charge.
The current charge difference from each waveform was taken into account in the data analysis. The stimulation charge was computed accordingly to the stimulation intensity and waveform, based on the following formula:
(1) Q=
∫
t1t2I dtWhere Q represents the charge value, I represent the current intensity and the range from t1 to t2 is the stimulus time interval.
21
Figure 3.1: Charge equalization A- Monophasic Square B -Biphasic square C- Monophasic Triangular D- Monophasic Quadratic. In this figure it is shown the differences in pulse-width time regarding the different waveform types needed for the charge value to be equal among them, maintaining the same response amplitude.
3.2
Subjects
To perform the study of the different waveforms influence on the motor neuron excitability, a total of 13 healthy subjects were submitted to the same test and evaluated. This group was composed of 7 males and 6 females, with a mean age of 26 years (standard deviation of 3.63), ages comprehended between 20 to 36 years old. None of the subjects that performed this test had any clinical history on neurologic disorders.
22
nerve and also of signal acquisition. On some other patients it was not possible to obtain the stimulus-response curve of the biphasic waves, since stimulation with this pulse did not elicit any response.
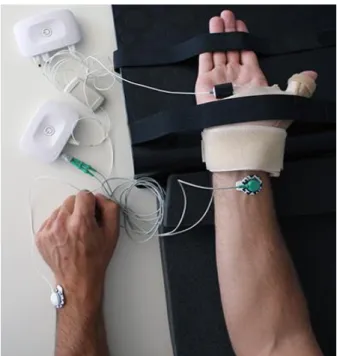
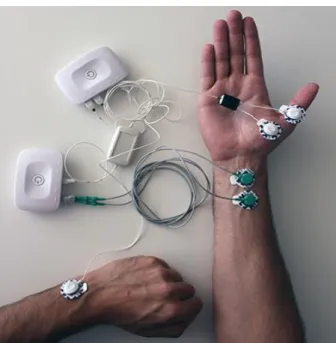
During the execution of the test, the subjects were straight seated, motionless, relaxed and with the right forearm in supination position with the palm of the hand facing posteriorly and making a 45 degree angle with the forearm. Thumb fixation was necessary in order to minimize movement artefacts and also limit the change in muscle fibre conduction velocity. For this purpose, a fixation support for the hand, elastic bands and a glove with lateral supporting bars along the thumb were used, as shown in figure 3.2.
Figure 3.2: Hand fixation schematic. In order to avoid thumb movement during the test, the hand was fixated with elastic bands to a support. It was also used a glove with lateral support bars along the thumb.
3.3
Stimulation and acquisition
23
Figure 3.3: Electrode positioning. Stimulation electrodes are placed on the right wrist (anode on top). Groundelectrode is placed on the opposite wrist. Acquisition electrodes are placed on the muscle surface of the thumb.
The EMG signal was acquired with a 3000Hz sampling frequency, 12bits of resolution and amplified with a gain of 201. For EMG acquisition, a combined wireless, miniaturized and synchronized unit was used [19]. This device has eight analog input channels with 12-bit of resolution, sampling frequency until 5 KHz, an external channel to be used as reference ground electrode for electrophysiology measures and a digital port for external synchronism, which connects with the electrostimulation unit by a synchronization cable. The electrostimulation device allows a stimulation intensity range up to 100mA [20]. The equipment used in this work was developed by PLUX [19,20] and shown on figure 3.4. Self-adhesive pre-gelled Ag/AgCl electrodes were used for EMG acquisition and peripheral nerve stimulation.
24
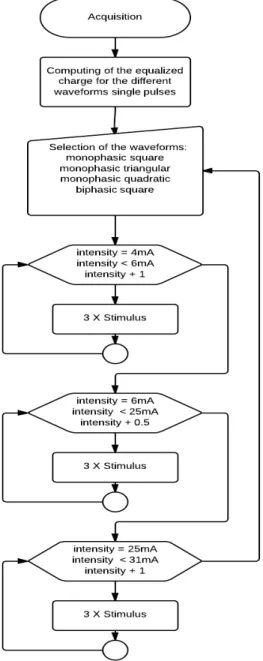
The signal acquisition method is illustrated in the following flowchart.
Figure 3.5: Illustrative flowchart of the steps of the stimulation protocol used in the biosignals acquisition.
25
3.4
Processing
After acquisition step, the collected biosignals were processed and several features were gathered, in order to evaluate the obtained response. To achieve that, processing scripts were developed using Python, for the data analysis of the acquired signals and automated extraction of the selected features. An illustrative schematic is presented in figure 3.6, and main steps described:
Figure 3.6: Diagram of the different steps of the processing
The processing comprehended the following steps:
1. Detection of the peak-to-peak amplitude of the stimulus response M-wave 2. CMAP scan composition
3. Interpolation and plotting of the CMAP scan
4. Extraction of S5, S50, S95 and stimulus-response amplitude elicited by these parameters
5. Detection of the beginning, final and slope of the resulting sigmoid
26
1-Peak-to-peak detection
Detection of the response after stimuli application, through derivate and arithmetic signal changes. It is evaluated if a stimulus generates a disproportionate response or if there is an abnormal movement or event on the stimulation moment and these exceptional transitions are removed from the signal. This procedure is effectuated for all the stimuli and each subject and visually validated. The maximum and amplitude of the peaks are detected (example on figure 3.7).
Figure 3.7: Detection of absolute amplitudes of the response generated
2- CMAP scan
Movement artefact removals were made through considering the mean baseline of the signal before stimulation and recalculating the signal between the stimulation point and the actual contraction of the thumb. After signal conversion and unwanted stimuli transitions and artefacts removed, the stimuli signal averaging of each current step is done. Values of maximum, minimum and absolute amplitude of the peaks for each current increment are collected in order to plot the CMAP scan graphic (example on figure 3.8).
27 3- Interpolation & plot
Given the reduction of the number of stimuli applied in order to maintain an acceptable test duration (since the test was made with four different types of waveforms instead of just one) an interpolation was made to better fit the graphic curve to the given points and enhance the CMAP scan obtained. After that, the final CMAP scan plot with each stimulus, for all amperage range, is generated (example on figure 3.9).
Figure 3.9: Interpolation effectuated to generate the CMAP scan
4- Parameters extraction
Maximum CMAP amplitude is obtained by averaging of the stabilization threshold after reaching the maximum stimulation amplitude on the sigmoid curve. A normalization step is effectuated in order to extract the values of the stimulation parameters that elicit 5%, 50% and 95% of the maximum response amplitude (S5, S50 and S95) as well as the response amplitude correspondent to these parameters (example on figure 3.10).
28
5- Sigmoid evaluation
The variations on the steepness of the sigmoid curve for the different types of waveform are also calculated, as the beginning and final of the curve are detected and slope of the sigmoid calculated. All these parameters and values are saved on a file, as all the points that constitute the CMAP scan.
6- Difference analysis
The analysis of the differences in the computed parameters regarding each waveform is done. The intensity differences values between each waveform to produce the same event and steepness relations are computed.
7- Mean & SD
For all the parameters and values computed, the median and standard deviation values were calculated and saved on file for posterior analysis.
The processing routine generates the plot of the different CMAPs and the CMAP scan and calculates the parameters of interest like the excitability parameters, their response amplitude and characteristics of the sigmoid curve, saving them on a file. These steps are repeated for the different types of waveforms. A CMAP Scan generated with a monophasic triangular waveform with the excitability parameters identified can be seen on figure 3.11.
This procedure was repeated for all subjects and all data had posterior visual validation by two M.D. specialists.
29
4.
Results
Peripheral nerve stimulation is influenced by external variables that are hard to control, like the adipose tissue layer that the electrical current has to pass, the distance between the stimulation electrodes and the nerve to be stimulated, among others. Taking this into consideration, the chosen analysis parameters were the ones that allowed a more objective assessment of the considered effects inter subjects.
Each subject was analysed regarding the CMAP amplitudes, excitability parameters (S5, S50, S95 - regarding stimulus current intensity (mA) and absolute response amplitude (mV)), sigmoid slope and current intensity differences of the CMAP scan between each different waveform. Given certain stimulation intensity it is noticeable the differences in the response amplitude generated by the different kind of waveforms tested. In figure 4.1 it is observable the differences in the response amplitude in the CMAP elicited by the same current intensity, which in this case is 10,5mA, between the different waveform types. The monophasic square waveform reaches almost the maximum amplitude for this intensity stimulus, and the response elicited by the same stimulus is lower to the monophasic triangular waveform and the lowest to the monophasic quadratic waveform, which would need a higher stimulus intensity to reach the same amplitude. The difference is even higher regarding the biphasic square waveform, since this current intensity value does not even provoke a response to the stimulus generated using this type of pulse.
30
Figure 4.1:CMAP acquired in a fixed intensity step for each waveform (10.5mA), where it is observable the
differences in the waves’ response amplitude, generated with the same intensity stimulation.
In figure 4.2 we can observe the CMAP scan originated by stimulation intensity values from subthreshold to supramaximal threshold, which means the recruitment of all motor units of the muscle fibres.
31 The CMAP scan of all the waveform types used in the study are represented and it is observable the differences in the stimulation intensity range needed to provoke the same stimulus response amplitude, regarding the different pulses, with very significant differences to the biphasic waveform in comparison with the monophasic pulses. Also to be noted the differences in the beginning and final of the sigmoid as well as in the steepness of the curve when comparing the different kinds of waveform.
Table 1 presents the CMAP scan S95´s stimulus-response amplitude (the amplitude of the response of the stimulus that elicited 95% of the maximum CMAP amplitude) of the different subjects evaluated.
Table 1 – S95 response amplitudes. Wave 1 corresponds to the monophasic square pulse, wave 2 to monophasic triangular pulse, wave 3 to monophasic quadratic pulse and wave 4 to the biphasic square pulse.
This table presents the value of the amplitude elicited by the excitability parameter S95, which corresponds to the amplitude of the response caused by a stimulus intensity that would generate 95% of the maximum CMAP amplitude value. Although it presents stimulus response amplitude variations inter subjects, the amplitude value obtained for a given subject, regarding the different waveform types, remains approximately constant.
Table 2 presents the mean CMAP scan sigmoid slope differences between the different types of waveforms used in the subjects’ stimulation, using the monophasic square waveform as reference.
32
As it could be observed on figure 5 one of the differences regarding the different kinds of waveforms is the steepness of the sigmoid curve generated. The monophasic square waveform will be used as reference in the comparisons made with the other types of pulses as it is the standard waveform type used in these studies and it presents the lower stimulation intensity range needed to achieve the maximum CMAP amplitude and also the curve with the higher steepness. The monophasic triangular waveform presents a slope approximately of 4/5 in comparison with the monophasic square waveform and this value is reduced to 2/3 relatively to the monophasic quadratic waveform. This difference is again more significant when comparing the monophasic and biphasic square waveforms, as the biphasic pulse presents approximately half of the sigmoid slope regarding the monophasic pulse.
Table 3 and 4 present the waveforms current intensity differences and the data shown allows a better assessment of the current intensity differences between each type of pulse.
In table 3 it is shown the current intensity values of the excitability parameter S5, stimulus intensity that elicited response amplitude that corresponds to 5% of the maximum CMAP amplitude, for the different waveforms and all subjects.
Table 3 – S5 current intensities. Wave 1 corresponds to the monophasic square pulse, wave 2 to monophasic triangular pulse, wave 3 to monophasic quadratic pulse and wave 4 to the biphasic square pulse.
33 In table 4 it is shown the mean arithmetic differences in the stimulation current intensity values for each excitability parameter (S5, S50, S95) between each type of waveform.
Table 4 – Waveforms current intensity differences
Taking into reference the monophasic square waveform, we can analyse on table 4 the differences in the stimulation intensities for the different excitability parameters and between the different waveform types. Once again, there is an increase in the stimulation intensity from the monophasic square waveform to the monophasic triangular waveform, which is higher when comparing the monophasic quadratic waveform with the monophasic square pulse. The increase in the stimulation threshold to reach the same response for the different excitability parameters relatively to the biphasic square waveform is very significant in comparison with the monophasic waveforms.
In table 5 it is shown again data that allow once more observing differences regarding the excitability thresholds of the different waveform pulses type. It is observable through this table the differences between the different kinds of waveforms regarding moment of maximum amplitude, stimulus intensity and response amplitude.
34
Next it is presented, as an example, a CMAP scan graphic with waveforms in a medium phase of testing, which still has implemented three biphasic waveforms.
Figure 4.3: CMAP scan representation with 3 types of monophasic and biphasic waveforms. It is particularly visible the differences in stimulation intensity between monophasic and biphasic waveform types and it is noted an order of appearance in the graphic of the waveforms regarding the type.
On the next figure is illustrated an example of a subject which did not present response to the biphasic waveform stimulation.
35
5.
Discussion
In this chapter it will be analysed and discussed the obtained results in the study with the healthy patients and the application to the diagnosis and monitoring of neurodegenerative pathologies.
5.1 Results analysis
The stimulus-response peak-to-peak maximum amplitude remained constant between different waveforms (Table 1). This fact is common to every subject, as expected given the charge equalization effectuated. However, there were significant differences among the subject’s maximum amplitude absolute. This behaviour was expected because, as it was mentioned before, nerve stimulation is affected by external variables, like the adipose tissue layer, among others, that are intrinsic to each subject.
The results show that the square pulse needs less current intensity to generate the same response amplitude as the other waves (Table 1 and Figure 5), and it is also the one that presents a more steep curve slope (Table 2). This means that, for the square wave, the time interval between the beginning and final of the stimulation is shorter than for the other waves and the stimulation threshold is lower. As we can verify by the tables, this effect is gradually decreasing for the triangular and quadratic pulse, respectively.
The quadratic wave, among the monophasic waves group, represents the stimulation pulse that needs a larger current intensity value and range to elicit the same response amplitude in comparison with the other waves. This fact consequently translates on an inferior sigmoid slope.
36
This is due to the nervous fibre sensibility to charge transfer rate, since in the used setup all waves have charge equalization, meaning that the variable cause is only the waveform, which has different charge transfer rates.
Concerning the biphasic square pulse it is possible to verify that it has a very distinct behaviour from the monophasic pulses, with activation intensities of the response levels S5 and S95 quite superior, with higher stimulation current intensities needed and higher time to reach from subthreshold to supramaximal stimulation value and consequently a rather inferior sigmoid slope. This fact indicates that, possibly, only one of the flanks of the biphasic waveform is activating the nerve fibres (corroborated by comparing to the same waveform but monophasic pulse, since the slope is approximately half and stimulation intensity needed to provoke the same response approximately double).
The monophasic waveforms have a more linear behaviour, while the biphasic waveform presents a more unstable behaviour with greater variations.
The analysis of the effect of the waveform on the peripheral nerve stimulation permits to reveal new effects in the context of the nerves’ excitability. Also the control of this parameter allows varying the stimulus-response curve slope. These facts can open new doors on the context of the CMAP scan applied to ALS diagnosis or other neurodegenerative disorders.
5.2 Application on the diagnostic of neurodegenerative
pathologies like ALS
Given the results observed on the previous study effectuated with healthy subjects, it was intended to make the correlation with neurodegenerative pathologies, verifying if the variations observed when performing the stimulation with different waveform types showed the same results relatively to patients with ALS.
37 30 mA intensity stimulus, where it is visible the response to the stimulus presented by the control and the simple electrical artefact, given by the negative spike presented by the patient.
Figure 6.1: A – Amplitude elicited by a stimulus of 20 mA on control subject. B – Amplitude elicited by the same stimulus on ALS patient. Due to progressive state of disease there is no response amplitude to the stimulus, being only visible electrical artefact on the stimulus moment (sample number 500) contrary to the control patient that presents a visible response after the stimulus moment.
To test other pathologies like Progressive Muscular Atrophy and demyelinated pathologies, the stimulation protocol was altered, with different stimuli intensity range and current increment steps.
Given the results observed on the previous study effectuated with healthy subjects relatively to the biphasic square waveform and discussed before, the acquisition protocol used on the patients only contemplated the monophasic pulse types.
Due to patients’ sensibility and motor limitations, the stimulation protocol had small alterations and fixation support was not used, just the glove with lateral support, optimizing the protocol application time.
39
Bibliography
[1] – Matthew C Kiernan, Steve Vucic, Benjamin C Cheah, Martin R Turner, Andrew Eisen, Orla Hardiman, James R Burrell and Margaret C Zoing. Amyotrophic lateral sclerosis. The Lancet, 377(9769):942–955, 2011.
[2] – JD Mitchell and GD Borasio. Amyotrophic lateral sclerosis. The lancet, 369(9578):2031– 2041, 2007.
[3] – Ellen M Maathuis, Robert D Henderson, Judith Drenthen, Nicole M Hutchinson, Jasper R daube, Joleen H Blok and Gerhard H Visser. Optimal stimulation settings for CMAP scan registrations. Journal of Brachial Plexus and Peripheral Nerve Injury, 7:4, 2012.
[4] – Ellen M Maathuis, Judith Drenthen, Gerhard H Visser and Joleen H Blok. Reproducibility of the CMAP scan. Journal of Electromyography and Kinesiology 21:433–437, 2011.
[5] –Benjamin Rix Brooks1, Robert G Miller2, Michael Swash3, Theodore L Munsat El Escorial revisited: revised criteria for the diagnosis of amyotrophic lateral sclerosis. ALS and other motor neuron disorders 1:293–299, 2000.
[6] – L Squire, H Bloom, N Spitzer, Sascha du Lac, A Ghosh and D Berg. Fundamental Neuroscience, 3rd edition, 2008.
[7] – M Cameron and L Monroe. Physical rehabilitation: evidence based examination, evaluation and intervention, 2007.
[8] – S Y Rasskazoff, K V Slavin. An update on peripheral nerve stimulation. Journal Neurosurgery Sci 56:279-85, 2012.
[9] – R D Henderson, G R Ridall, A N Pettitt, P A McCombe and J R Daube. The stimulus-response curve and motor unit variability in normal subjects and subjects with amyotrophic lateral sclerosis. Muscle Nerve 34: 34–43, 2006.
[10]- S Yamashita, H Sakaguchi, A Mori, E Kimura, Y Maeda, T Hirano and M Uchino. Significant CMAP decrement by repetitive nerve stimulation is more frequent in median than ulnar nerves of patients with amyotrophic lateral sclerosis. Wiley Periodics Inc., 2011.
[11] – Mamede de Carvalho, A Chio, R Dengler, M Hecht, M Weber and M Swash. Neurophysiological measures in amyotrophic lateral sclerosis: markers of progression in clinical trials. Amyotrophic Lateral Sclerosis, 000: 1–12, 2005.
[12] – M. Reaz, M Hussain and F Mohd-Yasin. Techniques of EMG signal analysis: detection, processing, classification and applications. Biol. Proced. Online, 8(1): 11-35, 2006.
[13] - R Merletti, A Holobara, D Farina. Analysis of motor units with high-density surface electromyography. Journal of Electromyography and Kinesiology, 18:879–890, 2008.
[14] – Raafat El-Sayed Shalaby. Development of an Electromyography Detection System for the Control of Functional Electrical Stimulation in Neurological Rehabilitation. PhD thesis,Universitätsbibliothek, 2011.
[15] – Functional electrical stimulation for neuromuscular applications. Annual Review Biomedical Engineering, 7:327–60, 2005.
[16] - L Sheffler and J Chae. Neuromuscular electrical stimulation in neurorehabilitation. Wiley Periodicals Inc, 2007.
40
[18] - Hermens, H.J., Frericks, B., Merletti, R., Hagg, G., Stegeman, D., Blok, J. et al. (1999) SENIAM 8: European recommendations for surface electromyography, ISBN: 90-75452-15-2: Roessingh Research and Development.
[19] - PLUX – Wireless Biosignals, S.A. (2014) [Online] Available from http://www.plux.info . Accessed July 7th, 2014].
[20] - Araujo, T., Nunes, N. and Gamboa, H. (2012) Miniaturized Wireless Controlled Electrostimulator. In Proceedings of Biodevices – International Conference on Biomedical Electronics and Devices. BIOSTEC 2012, Vilamoura, Portugal.
[21] - Maathuis, E.M., Drenthen, J., Van Doorn, P.A., Visser, G.H. and Blok, J.H. (2012) The CMAP scan as a tool to monitor disease progression in ALS and PMA. Amyotrophic Lateral Sclerosis and Frontotemporal Degeneration: 1-7.
[22] - Paulo Henrique Marchetti and Marcos Duarte. Instrumentação em eletromiografia. Laboratório de Biofísica, Escola de Educação Física e Esporte. São Paulo: Universidade de São Paulo, 2006.
[23] - François Hug and Sylvain Dorel. Electromyographic analysis of pedaling: a review. Journal of electromyography and kinesiology: official journal of the International Society of Electrophysiological Kinesiology, 19(2):182, 2009.
[24] –Contribution of reference electrode to the Compound Muscle Action Potential. Sanjeev D. Nandedkar and Paul Barkhaus, MD. Muscle Nerve 36: 87–92, 2007.
[25] - Spielholz N, Nolan M. Conventional TENS and the phenomena of accommodation, adaptation, habituation and electrode polarization. J ClinElectrophysiol. 1995; 7: 16-19.
[26] - Robertson V, Ward A, Low J, Reed A. Electroterapia Explicada: Princípios e prática, 4ª Edição. Rio de Janeiro: Elsevier Ltda; 2006.
[27] - Alon G, Kantor C, Ho H. Effects of electrode size on basic excitatory responses and on selected stimulus parameters. J Orthop Sports Phys Ther.1994; 20: 29-35.
[28] – Paillard, T. Combined Application of Neuromuscular Electrical Stimulation and Voluntary Muscular Contractions. Sports Medicine 2008; 38:161-177.
[29] - Hille B. Ionic channels of excitable membranes. Sunderland, Massachusetts: Sinauer Associates Inc. 1992.
[30] - Becker, W. M., Kleinsmith, L. J., Hardin, J., & Bertoni, G. P. Signal Transduction Mechanisms: I. Electrical and Synaptic Signaling in Neurons. The world of the cell (7th ed.). 2009 San Francisco: Pearson/Benjamin Cummings.
[31] - Nerve Conduction Study. Johns Hopkins Medicine. Retrieved 17 December 2013.
[32] - Blok JH, Ruitenberg A, Maathuis EM, Visser GH. The electrophysiological muscle scan. Muscle Nerve 2007; 36:436–46.
41