Article
, Vol. 30, No. 2, 211-223, 2019 Printed in Brazil - ©2019 Sociedade Brasileira de Química*e-mail: [email protected]
Encapsulating TiO
2into Polyvinyl Alcohol Coated Polyacrylonitrile Composite
Beads for the Effective Removal of Methylene Blue
Zhenhua Han,a Jiali Jin,a Yuchao Wang,a Zihui Zhang,a Junjie Gu,a Minrui Oua and
Xiaoping Xu *,a
aKey Laboratory of Biopharmaceutical, College of Chemistry, Fuzhou University, 350108 Fuzhou, People’s Republic of China
In this work, novel nanocomposite beads based on polyvinyl alcohol (PVA) coated polyacrylonitrile (PAN) with encapsulation of TiO2 nanoparticles (PPT) were developed successfully via a novel green synthetic method and its methylene blue (MB) removal ability by adsorption was also investigated. As-prepared nanocomposite beads were characterized by different techniques such as Fourier transform infrared (FTIR) spectroscopy, X-ray diffraction (XRD), scanning electron microscopy (SEM) and thermogravimetric analysis (TGA). TiO2 nanoparticles were encapsulated into the composite beads to endow the composite beads with photocatalytic ability and enhance its adsorption capacity for MB. Batch experiments with several variables such as TiO2 nanoparticle content, pH of the solution, contact time and initial MB concentration were carried out. The adsorption kinetic study revealed that the MB adsorption process agreed well with pseudo-second order model and showed 3-stage intraparticle diffusion model. The adsorption isotherm study indicated that the MB adsorption process could also be better described by Langmuir isotherm model. According to Langmuir isotherm equation, the maximum adsorption capacity and removal rate for MB was 242.13 mg g-1 and 98.4%, respectively. Moreover, the stability and reusability of as-prepared PPT beads were further explored and results demonstrated that PPT could be reused at least five times with negligible loss of sorption capacity and removal rate. Therefore, PPT is expected to be a potential candidate for effluents treatment.
Keywords: polyvinyl alcohol, nano titanium dioxide, polyacrylonitrile, methylene blue
Introduction
Fast population growth and aggravation of industrial activity generated a great need for clean water resources.1 Recently, diverse types of dyes were directly discharged into environment from numerous chemistry factories, such as pharmaceutical, textile, polymers, refineries, plastic and leather.2 Pollution created by dyes has brought worldwide attention because of its severe biotoxicity and potential mutagenic and carcinogenic effects.3 As a common cationic dye, methylene blue (MB) was broadly applied in many fields including monitoring, printing and dyes. MB can also spread undesirable color to hydrosphere and reduce sunlight penetration in water, which affect photosynthetic activity in aquatic life.4 Hence, there is an urgent need to develop effective, easy, reliable and versatile techniques to remove MB before being discharged into the environment. Numerous methods were explored to remove MB from
effluents including flocculation, coagulation, oxidation, membrane separation, electrochemical methods, biological methods and adsorption.5-7 Among the reported methods, adsorption was most widely employed in removing MB from wastewater due to its amazing efficiency, low energy cost, high selectivity at molecular level, easy design and ease of separating various chemical compounds.8-10 Various types of materials, including activated carbon,11 rhamnolipid-functionalized graphene oxide,12 polyvinyl alcohol (PVA),13 activated carbon aerogels,14 agricultural residues,15 red mud16 and zeolite,17 have been fabricated for absorptive removal of MB from industrial sewage. Recently, developing effective, low cost, non-toxic, renewable and eco-friendly adsorbents with high mechanical, thermal stability and high sorption capacity is considered to be a hot topic in wastewater purification. For instance, Balkız et al.18 reported the removal of MB dye by graphene oxide-alginate quasi-cryogel beads; Anfar et al.19 proposed the removal of MB dye by treated agri-food organic waste; Uyar et al.20 fabricated alginate-clay quasi-cryogel beads
Encapsulating TiO
2into Polyvinyl Alcohol Coated Polyacrylonitrile Composite
Beads for the Effective Removal of Methylene Blue
Zhenhua Han,a Jiali Jin,a Yuchao Wang,a Zihui Zhang,a Junjie Gu,a Minrui Oua and
for the removal of MB dye; and Manikandan et al.21 planned physically/chemically modified Ceiba pentandra seeds for the expulsion of MB dye.
In recent years, TiO2 nanoparticles (NPs) were
considered to be one of the most widely studied and promising semiconductor metal oxide photocatalysts in environmental remediation as a result of their high photocatalytic activity, huge surface areas, low cost, nontoxicity, excellent stability under illumination and their demonstrated efficiency in the mineralization of organic contaminants.22 Nevertheless, there existed few reports with respect to employing pure TiO2 NPs in industrial effluents purification owing to the challenge of recovery of powdered TiO2 NPs after wastewater treatment.23,24 To immobilize TiO2 NPs in various substrates is an effective approach to avoid the problem.25 PVA, as a semi-crystalline hydrophilic polymer with good chemical and thermal stability, is a highly biocompatible, hydrophilic, non-toxic, low cost and easily processed polymer.26 As an effective adsorbent, PVA has been widely applied in effluents treatment due to the presence of large amount of hydroxyl groups in its molecular chain. Besides, PVA can be used as a polymeric matrix in dye removal due to the formation of hydrogen bond between dye molecules and PVA.27 However, PVA-based adsorbents are commonly blended with other water-insoluble polymers or cross-linked by either chemical or physical methods to form insoluble materials due to its high water solubility.28,29 Although numerous PVA-based adsorbents have been prepared successfully for removing dyes from wastewater such as molecularly imprinted sericin/PVA,30 polyaniline/PVA/clinoptilolite composite,31 alginate/PVA/ kaolin composite,32 macroreticular (MR)-PVA/attapulgite (ATP)33 and sericin/β-cyclodextrin/PVA composite,34 there are few reports about PVA/polyacrylonitrile (PAN) blends polymers. PAN is one of the most favorable binding materials owing to its remarkable physical nature such as chemical stability, solubility in organic solvents, easy pelletizing and strong binding force with organic elements. Furthermore, PAN is extremely cheap and can quite easily form into adsorptive spherical beads with large surface area, hydrophilicity, high porosity, excellent kinetics and high adsorption capabilities.35-37
In our present work, PVA coated polyacrylonitrile with encapsulation of TiO2 NPs (PPT) organic/inorganic nanocomposite beads were developed with green reagents-water as gelation agent for effective removal of MB. To our knowledge, this is the first time PAN/PVA/ TiO2 nanocomposite adsorbent beads were developed for effective removal of MB. The novel organic/inorganic nanocomposite beads not only possess additional advantages of both organic and inorganic materials, but
also overcome their defects. For example, as-prepared PPT beads especially exhibited photocatalytic performance and excellent water resistance, and were pretty easily separated from aqueous solution. Then, the physicochemical and mechanical properties of the beads were characterized via Fourier transform infrared (FTIR) spectroscopy analysis, X-ray diffraction (XRD), scanning electron microscopy (SEM) and thermogravimetric analysis (TGA). Meanwhile, adsorption isotherms and kinetic models were explored to analyze the whole sorption process. Lastly, the effects of TiO2 NPs content, pH, initial concentration and contact time on the MB adsorption process were also studied.
Experimental
Materials
PAN (homopolymer, average molecular weight of 150 kDa) was obtained from Sigma. PVA ((C2H4O)n, saponification ratio 99%, polymerization degree 1700, molecular weight 74,800), MB trihydrate (C16H18ClN3S·3H2O) and TiO2 NPs (P25, Degussa; particle size 21 nm) were purchased from Aladdin Bio-Chem Technology Co., Ltd. All chemicals were of analytical grade and were used without further purification. Distilled water was used to prepare all solutions.
Stock solution (1000 mg L-1) of MB was obtained by dissolving 1.169 g MB trihydrate in 1000 mL distilled water. The MB solutions of different concentrations used in sorption experiments were obtained by dilution of the stock solutions.
Synthesis of PPT organic/inorganic nanocomposite beads
PPT organic/inorganic nanocomposite beads were prepared according to the following procedure:
Firstly, a known amount of PAN homopolymer was dissolved (7.5 wt.%) in dimethylformamide (DMF) in a beaker under constant stirring at 333 K for 12 h to prepare the PAN polymeric solution. Subsequently, TiO2 NPs were carefully added into the prepared PAN solution under constant stirring at 333 K for another 8 h to obtain
PAN/TiO2 mixed homogeneous solution. Meanwhile,
outer diameter of the obtained beads was about 2 mm. Finally, the PPT beads were washed five times with distilled water. Thereafter, the PPT beads were dried in vacuum freeze-drying machine for 12 h and stored in vacuum drying oven at room temperature for further use.
Characterizations
FTIR spectra (JASCO FTIR 620 spectrometer) of PPT beads were recorded in the range of 4500-420 cm-1. The surface morphology of PPT beads was studied using SEM (FEI Nova Nano SEM 230). The XRD pattern of the as-synthesized samples were recorded on a Panalytical Empyrean diffractometer in the range of 10 to 90o. The thermal degradation behaviors of PPT beads were analyzed via TGA (STA449C/6/G, NETZSCH) in the range of 10 to 800 oC.
Adsorption experiments
Adsorptive removal of MB by PPT beads was carried out in batch experiments. In each adsorption experiment, 0.02 g PPT beads were added to 20 mL of MB solutions of various known concentrations and desired pH values in a shaker at room temperature (20 oC) with a shaking rate of 150 rpm. pH of MB solutions was adjusted by nitric acid or sodium hydroxide standardized solutions. At the predetermined time intervals, adsorbents were separated and the absorbance of residual solutions were recorded with UV-Vis spectrophotometer (UV-1780, Shimadzu) at 665 nm to determine the adsorption capacity of PPT beads. All experiments were done in triplicate and mean values are presented. The effect of different parameters on the MB sorption process was also investigated by adjusting the contact time, pH, the initial concentration of MB solution and the TiO2 NPs amount. The MB removal rate and the adsorption capacity (qt) of PPT at desired times t and the equilibrium adsorption capacity (qe) of PPT were calculated as follows:
(1)
(2)
(3)
where C0 (mg L-1) and Ce (mg L-1) are the MB concentrations before and after adsorption, respectively, Ct (mg L-1) is the
concentration of MB solution at the time t, W (g) and V (L) indicate the weight of the PPT beads and the volume of the tested dye solution, respectively.
Adsorption isotherm models
Adsorption isotherm and kinetic studies were carried out in batch experiments. Studying equilibrium isotherm can give a better prediction and fairly reliable information of the adsorption performance and optimum sorption conditions of the PPT beads. Two common adsorption isotherms, including Freundlich and Langmuir models, were modeled to analyze the equilibrium characteristic of MB adsorption process.38 The linear form of Langmuir (equation 4) and Freundlich (equation 5) models can be described as follows:
(4)
(5)
where Ce (mg L-1) is equilibrium MB concentration, qe (mg g-1) is equilibrium adsorption capacity of PPT beads adsorbent, qm (mg g-1) is the maximum adsorption capacity of adsorbent, b (L mg-1) is the Langmuir constant, and KF (mg g-1) and n are Freundlich constants. The values of qm and b can be taken from the slope and intercept of the linear plot of (Ce / qe) vs. Ce, while the values of n and KF can be obtained from the slope and intercept of the linear plots of lnqevs. lnCe.
Moreover, the essential features of the Langmuir isotherm can be expressed by a dimensionless equilibrium parameter RL to make a prediction about the favorability of sorption process,39 which is written by the following expression:
(6)
where C0 (mg L-1) represents the initial MB concentration. The value RL shows the type of the isotherm, such as unfavorable (RL > 1), linear (RL = 1), favorable (0 < RL < 1) or irreversible (RL = 0).
Adsorption kinetic study
process. Three widely accepted adsorption kinetics such as pseudo-first order model, pseudo-second order model and intraparticle diffusion model were applied to fit the adsorption kinetic data.40
The pseudo-first order model equation is expressed as follows:
(7)
where qe (mg g-1) and qt (mg g-1) are the MB adsorption capacity of PPT beads at equilibrium and time t, respectively. k1 is the pseudo-first order model adsorption rate constant (min-1).
The pseudo-second order model equation is given as follows:
(8)
where k2 (g mg-1 min-1) is the pseudo-second order model sorption rate constant. The values of qe and k2 can be obtained from the slope and intercept of the plot of t / qtvs. t.
The intraparticle diffusion model equation is described as follows:
(9)
where kp is the intraparticle diffusion model adsorption rate constant (mg g-1 min-1/2) and C reflects the boundary layer thickness. The value of kp and C can be taken from the slope and intercept of the plot of qtvs. t1/2, respectively.
Regeneration study
To evaluate the reusability of the PPT beads for MB removal, a regeneration study was carried out in adsorption-desorption circles with HCl as elution solution. Briefly, 0.01 g MB loaded PPT beads were immersed in 50 mL desorption solution containing HCl (0.1 M) under stirring for 5 h after finishing adsorption. After that, the eluted PPT beads were filtered and employed in MB sorption once again. The above process was repeated five times and the capacity of PPT beads after finishing each MB adsorption process was calculated.
Results and Discussion
FTIR analysis
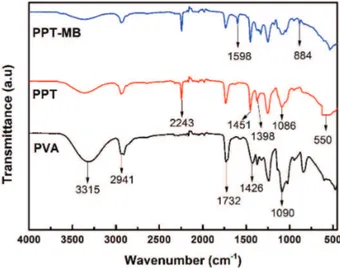
FTIR spectrometry analysis was used to investigate the functional groups of the samples. The FTIR spectrometry
patterns are shown in Figure 1. TiO2 typical characteristic peaks at 550-800 and 1404 cm-1 are related to the formation of Ti–O and Ti–O–Ti bonds,41 which can be observed from the spectrometry of PPT. The typical characteristic peaks of PAN were at 2243, 1451 and 1086 cm-1, corresponding to C≡N stretching, –CH and –C–N bending vibrations, respectively.42 In case of PVA, typical characteristic peaks located at 3100-3500 and 1750-1735 cm-1 related to the stretching vibrations of –OH and the stretching vibrations of C=O, can be ascribed to the acetate groups of PVA molecules.43 FTIR spectrometry of PPT showed the most typical characteristic peaks of PAN, PVA, and TiO2, which indicated the successful preparation of PPT beads. Nevertheless, the peak of PPT at 3100-3500 cm-1 became weaker due to the formation of hydrogen bonds between PVA chains and PAN segments. In addition, some peak shift, peak disappearance and new peak appearance were observed by comparing the spectrometry of PPT with
PPT-MB. The disappeared peak was at 3100-3500 cm-1
and the peak shift located at about 1250 cm-1. New peaks appeared at 1598 and 884 cm-1 in FTIR spectrometry of PPT-MB, assigned to the aromatic ring vibrations and wagging vibration of C–H in aromatic ring of MB dye,44 which indicated the functional groups participated in adsorption process.
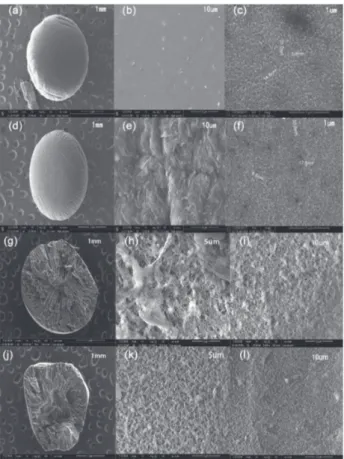
SEM
entrance into the interior of PPT beads and forming a resistance to contraction in PPT beads drying process, simultaneously. Moreover, the small pores with a size of about 6-40 nm on the external surface were clearly visible in Figures 2c and 2f. Nevertheless, it can be clearly observed from Figures 2b and 2e that a smooth surface of PPT beads gradually turned into rough, protrusion and satiation after adsorption of MB, which demonstrated the firmly bonding of MB molecules with –COOH or –OH of the PPT.
The cross-sectional morphology of PPT beads before and after adsorption of MB are shown in Figure 2. As can be seen, the low magnification SEM images shown in Figures 2g and 2j indicated textured surface and porous three-dimensional internal structure. This structure showed that PPT beads exhibited large surface area and excellent mass transfer performance. Before adsorption, the inner part of PPT beads (Figures 2h and 2i) had obvious porous structure with very coarse large surfaces and many large-sized pores, which contributed to full contact between PPT and MB molecules. After adsorption, the inner part of PPT beads (Figures 2k and 2l) obviously changed into satiation.
TGA
TGA was conducted aiming to investigate the thermal behavior of the composite materials. The TGA curves of TiO2 NPs, PAN/PVA and PPT are presented in Figure 3. As to TiO2 NPs, mass loss of about 4.5 wt.% happened in the temperature range of 10-800 oC. In the case of PAN/PVA and PPT beads, three stages of mass loss occurred. The first stage weight loss of 10 wt.% happened in the temperature range of about 10-250 oC for PAN/PVA and 10-280 oC for PPT beads, respectively. This can be attributed to the evaporation of adsorbed bound water and the residue of acetic acid.45 In the second stage, 43 wt.% of weight loss happened in the temperature range of 320-450 oC for PAN/PVA and 280-450 oC for PPT, which can be caused by the breakage of the hydrogen bonds formed between PAN and PVA molecule and the decomposition of –OH groups in PVA molecular chain.46,47 In third stage, further weight loss occurred within 450-800 oC for both PAN/PVA and PPT beads, which can be attributed to the degradation of PVA and PAN. The total mass loss approached 50 and 46 wt.% for PAN/PVA and PPT beads, respectively. In conclusion, as-prepared PPT beads showed high thermal stability and strong force existed between PAN and PVA molecules, which was in accordance with the FTIR and XRD analysis.
XRD
XRD characterization of three different samples were carried out in the 2θ range of 10-80o. The XRD spectra of PAN/PVA beads, PPT beads, and MB loaded PPT beads are displayed in Figure 4. For the XRD pattern of the three materials, the strong characteristic diffraction peaks at 2θ = 18.5o (101) are related to crystalline PVA in the three samples,48 which indicate the steady existence of Figure 2. SEM images of PPT beads (a)-(c) before adsorption, and
(d)-(f) after adsorption of MB. Cross-sectional SEM images of PPT beads (g)-(i) before adsorption, and (j)-(l) after adsorption of MB.
PVA. For XRD pattern of PPT and PPT-MB, characteristic diffraction peaks were at 2θ = 25.3o (101), 37.8o (004), 48.0o (200), 55.1o (211), 62.7o (204), 68.8o (116), 70.3o (220) and 75.0o (215), which are assigned to crystal planes of anatase TiO2.49 This indicates the successful introduction of TiO2. All characteristic diffraction peaks of PVA and TiO2 appeared in the XRD pattern of PPT beads, indicating the successful preparation of PPT beads.
Effect of TiO2 NPs content on MB adsorption
TiO2 NPs content can greatly affect the MB adsorption efficiency. Therefore, it is necessary to determine the
optimal amount of TiO2 NPs to get the maximum MB
adsorption capacity. Effects of TiO2 NPs content on MB adsorption capacity were investigated using PPT beads containing different amounts of TiO2 NPs and the results are presented in Figure 5. The results indicate that MB adsorption capacity increased with TiO2 NPs content within certain limits. The maximum MB adsorption capacity was obtained using PPT beads with 20 wt.% TiO2 NPs. The increase of MB adsorption capacity can be attributed to two reasons: firstly, the increase of surface area of adsorbent provided more binding sites for MB when TiO2 NPs content increased.50 Secondly, the increase of anionic charge of TiO2 surface happened at higher pH,51 which contributed to interacting with cationic MB. Further
increase of TiO2 NPs content causes MB adsorption
capacity to decrease due to the difficulty of MB molecules to diffuse into the internal pore of PPT beads, caused by agglomeration of TiO2 NPs.
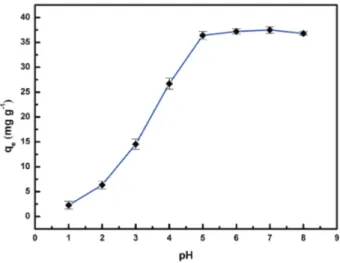
Effect of pH on MB adsorption
The pH of sorption system was an important influence
factor in all adsorptive removing contaminant process. The effect of pH value of sorption system on MB sorption process is presented in Figure 6. According to the results, MB sorption capacity increased when the pH increased from 2 to 5. However, MB sorption capacity remained constant when pH value was over 5. The maximum MB adsorption capacity was 37.5 mg g-1, obtained when pH was over 5. The reasons may be explained as follows: firstly, more negative groups in the adsorbent were ionized with increase of pH, which can interact with more cationic MB; secondly, hydrogen bonding interaction happened between hydroxyl in the PVA and imine groups in the MB. With the further increase of pH, electrostatic repulsion reduced due to the decrease of positive charge density around the PPT beads, thus facilitating dye adsorption.
Figure 4. XRD spectra of (a) PAN/PVA, (b) PPT, and (c) MB loaded PPT.
Figure 5. Effect of the TiO2 weight percentage in PPT adsorbent on the adsorption of MB onto PPT. Initial concentration: 20 mg L-1, contact time: 5 h, adsorbent dose: 0.02 g, pH 7, temperature: 20 oC.
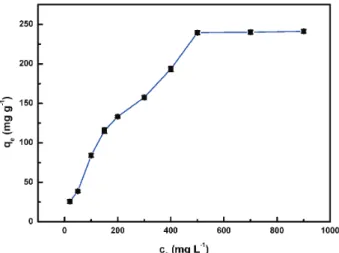
Effect of initial concentration on MB adsorption
Effect of initial concentration on MB removal efficiency was conducted by adjusting MB initial concentration ranging from 20 to 900 mg L-1. As presented in Figure 7, as the initial MB concentration increased from 20 to 900 mg L-1, the MB adsorption capacity increased from 25.8 to 200.3 mg g-1. This phenomenon can be due to the fact that many available sorption sites of the PPT adsorbent were easily occupied by MB molecules at lower concentration. With MB initial concentration increasing, vacant active sites of PPT beads sharply decreased up to saturation, and the adsorption capacity of PPT reached the maximum and remained unchanged.
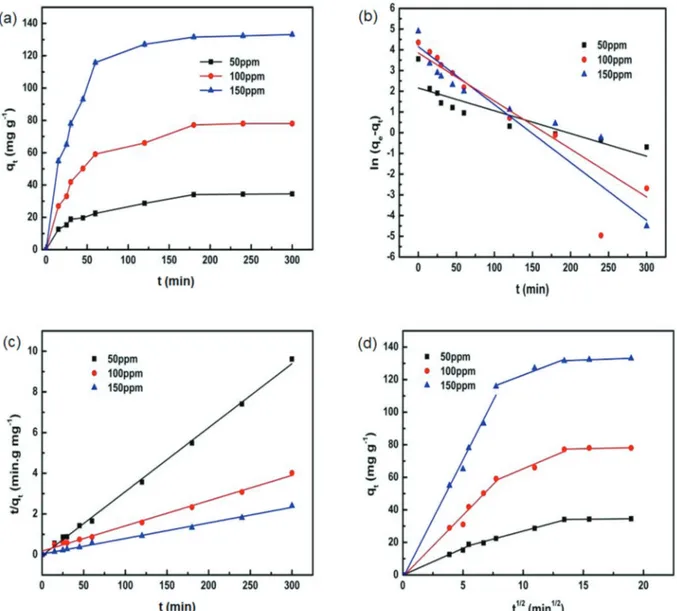
Effect of contact time on MB adsorption
The effect of contact time on MB adsorption was investigated by changing the contact time ranging from 15 to 300 min. As shown in Figure 8a, the curve of the MB adsorption capacity vs. time can be divided into three stages: (i) rapid increase; (ii) slow growth; and (iii) remain level. According to the experimental results, the whole MB sorption process can be divided into three periods: firstly, MB were promptly adsorbed into PPT beads at the first stage. At the second stage, MB adsorption rate slowed down as time passed. At the third stage, MB adsorption rate reached equilibrium and saturation with time prolonged. The first stage rapid increase can be attributed to the presence of many available MB sorption sites on the surface of PPT beads. However, the available sorption sites was gradually occupied by MB molecules as time passed, and available sorption sites also decreased gradually, leading to a slow growth of MB adsorption rate. Finally, sorption
sites of PPT were all occupied and the adsorption capacity reached saturation.
Kinetic study
The fitting curve of the pseudo-first order, pseudo-second order and intraparticle diffusion models are presented in Figures 8b-8d, respectively. The related parameters including correlation coefficients R2, k
1, k2, kp and calculated qe,cal (in mg g-1) values are summarized in Table 1. According to the results, the pseudo-second order model (R2 > 0.99) provides better fit than the pseudo-first order model (R2 < 0.99). The calculated qe,cal according to the pseudo-second order model was closer to the experimental qe. From this point of view, the adsorption of MB molecules onto the PPT beads is chemical adsorption,52 and the MB adsorption process and mechanism are described in Figure 9.
Moreover, intraparticle diffusion model was also used to analyze the stage process of MB sorption. According to the results, it was clear that the fitting plot was multilinear without passing through the origin. From the curve, the whole MB adsorption process can be divided into three different stages. At the first stage, the sharper step represented the diffusion of the MB molecules into the external surface of the PPT beads through the boundary layer. At the second stage, the less sharp step can be due to the gradual diffusion of MB molecules into the pore through the external surface of the PPT beads. Subsequent adsorption happened between MB molecules and internal surface of the composite beads pore. MB adsorption equilibrium was achieved at the last stage. Therefore, it can be concluded that the intraparticle diffusion was not the only rate controlling step,53 where C ≠ 0.
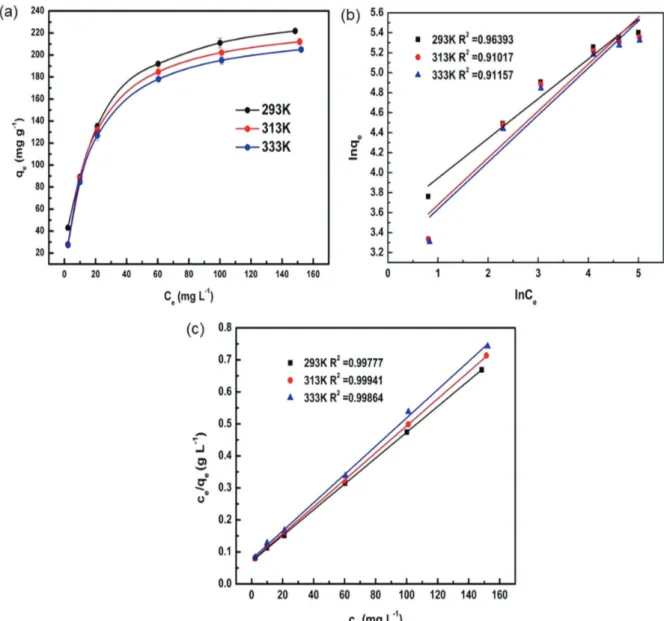
Adsorption isotherm study
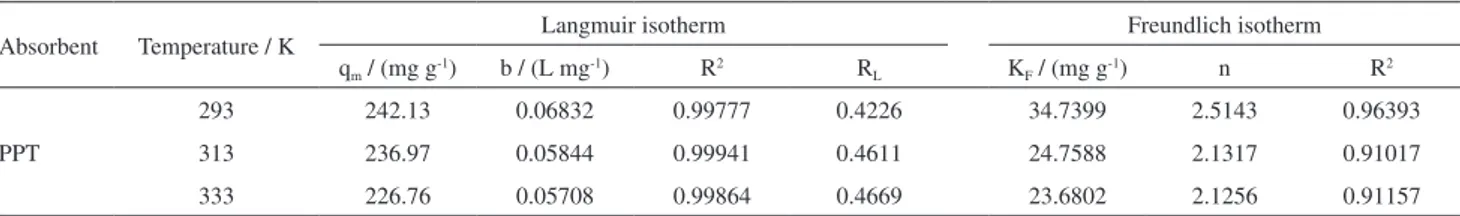
The results of fitting the experimental equilibrium data to Freundlich and Langmuir models are displayed in Figure 10. The related theoretical parameters in the adsorption isotherm study are presented in Table 2. According to the correlates (R2), the Langmuir models (R2 > 0.99) provide better fit to the experimental data than Freundlich models (R2 < 0.99). As shown in Table 2, the calculated RL values belonged in the range of 0 to 1 for all temperatures, demonstrating that the MB adsorption process was favorable.
Photocatalytic activity
To study photocatalytic degradation activity of PPT beads, photocatalytic degradation of MB in aqueous solution Figure 7. Effect of initial MB concentration (20, 50, 100, 150, 200, 300,
was carried out under visible light irradiation and dark atmosphere. As a comparison, photocatalytic degradation of MB in aqueous solution by PAN/PVA beads (without TiO2 NPs) was also investigated under visible light irradiation. In each experiment, 10 mg of adsorbents were added separately into 50 mL of MB solution (50 mg L-1). The results of the photocatalytic activity of PPT beads are shown in Figure 11a. As shown in Figure 11a, the removal rates by the PPT beads with visible light irradiation were obviously higher than that of PPT beads without visible light irradiation and PAN/PVA beads (without TiO2 NPs). Comparing to the PAN/PVA beads, the removal rates of PPT beads (with TiO2 NPs) in the dark were higher, which indicated TiO2 NPs participated in the MB adsorption processes. In addition, within 60 min, about 50% of the MB dye molecules were removed from the bulk solution through a combination process of adsorption Figure 8. Adorption kinetic plots of MB onto PPT at various initial concentrations. (a) Effect of contact time; (b) pseudo-first order; (c) pseudo-second order sorption; and (d) intraparticle diffusion kinetics models.
Table 1. Adsorption kinetic parameters of MB by PPT at pH 7 and 293 K
Model Equation Parameter MB / ppm
50 100 150
Pseudo-first order k1 / min
-1 0.01098 0.02794 0.02317
R2 0.76231 0.88308 0.87516
Pseudo-second order
qe,cal / (mg g-1) 35 82.1 135.5
k2 / (g mg
-1 min-1) 0.02855 0.01218 0.00738
R2 0.997 0.9953 0.998
Intraparticle diffusion
kp1 / (mg g-1 min-1/2) 3.281 7.5576 14.519
kp2 / (mg g-1 min-1/2) 1.9841 3.1269 2.8241
kp3 / (mg g-1 min-1/2) 0.07743 0.1459 0.2707
MB: methylene blue; ppm: concentration in mg L-1; q
e and qt : MB adsorption capacity at equilibrium and time t, respectively; k1: pseudo-first order rate constant; R2: regression coefficient; k
2: pseudo-second order rate constant; qe,cal: calculated equilibrium MB adsorption capacity; kp: intraparticle diffusion rate constant; C: intraparticle diffusion intercept; kp1, kp2, kp3: rate constant of the first, second, and third stage, respectively.
enrichment and photocatalytic degradation by PPT beads; however, only 30% of the MB dye molecules were adsorbed by PPT beads (without visible light irradiation). Furthermore, we observed that the processes of photocatalytic degradation and adsorption had synergistic effects for the removal of MB. At 300 min, similar results can also be found. The above results indicated TiO2 NPs played an important role not only in the processes of photocatalytic degradation of MB dyes, but also in the processes of adsorptive removal of MB, which can be potential candidate as an efficient catalyst and adsorbent in water purification as well as in biological system.
The proposed mechanism for the photocatalytic degradation of organic dyes under visible light irradiation is described in Figure 11b. Under visible light irradiation, TiO2 generated superoxide radicals (•O–•2) and hydroxyl radicals (•OH), which are very potent oxidizing agents for the degradation of methylene blue molecules.
Desorption and regeneration studies
The mechanism of MB adsorption process can be further clarified by desorption studies. Adsorption-desorption experiments were carried out to verify the adsorption
mechanism and the possibility of regeneration of the PPT beads adsorbent. Desorption studies were performed using three desorption eluents, namely pure water, 0.1 M acetic acid and 0.1 M HCl. The results (Figure 12a) indicated that 0.1 M HCl exhibited the best desorption efficiency: 94.37%. Because both the chemical interaction and the electrostatic interaction can be destroyed in acid environment, 0.1 M HCl was used as desorption eluent in the regeneration study.
Excellent regeneration ability is of great significance for any adsorbent from the aspect of practical application. Regeneration test was conducted with 0.1 M HCl solution as elution reagent. In each test, MB loaded PPT beads were immersed in elution reagent for 1 h. The sorption and photocatalytic degradation properties of PPT beads for removal of MB dyes were evaluated in regeneration test and the results are presented in Figure 12b. According to the results, PPT beads can be reused at least five times with negligible loss of removal capacity and removal efficiency. However, the maximum MB adsorption capacity only decreased from 242.13 to 221.07 mg g-1, and the MB removal capacity still stayed above 94% after five recycles. It suggests that the as-prepared PPT beads can be expected to be a potential candidate for effluents treatment. Table 2. Langmuir and Freundlich isotherm model parameters for MB adsorption
Absorbent Temperature / K Langmuir isotherm Freundlich isotherm
qm / (mg g-1) b / (L mg-1) R2 RL KF / (mg g-1) n R2
PPT
293 242.13 0.06832 0.99777 0.4226 34.7399 2.5143 0.96393
313 236.97 0.05844 0.99941 0.4611 24.7588 2.1317 0.91017
333 226.76 0.05708 0.99864 0.4669 23.6802 2.1256 0.91157
PPT: polyacrylonitrile (PAN)/polyvinyl alcohol (PVA)/TiO2; qm: maximum MB adsorption capacity of PPT; b: constant related to the rate of adsorption; R2: regression coefficient; R
L: dimensionless equilibrium parameter; Kf and n: Freundlich constants.
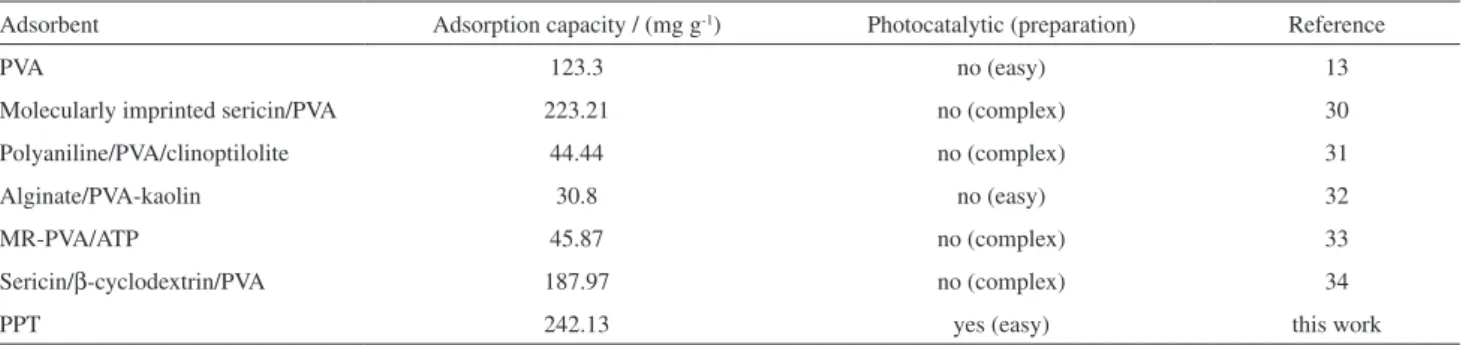
Comparison with other absorbents
The comparison of MB sorption capacity and adsorption performances of varied PVA-based adsorbents are presented in Table 3. Compared with other PVA-based adsorbents, such as PVA, molecularly imprinted sericin/ PVA, polyaniline/PVA/clinoptilolite, alginate/PVA-kaolin, MR-PVA/ATP and sericin/β-cyclodextrin/PVA, as-prepared PPT beads exhibited relatively high MB adsorption capacity. Besides, PPT beads were easy to prepare and showed an especially photocatalytic performance.
Mechanism of adsorption
Three potential adsorption mechanisms may be proposed. The first is an electrostatic interaction between the negative group of the absorbent (TiO2– and O–) and the positively charged MB, which agreed well with the results of pH effects (Figure 6) and TiO2 NPs contents effects (Figure 5). Besides, desorption of MB under strong acidic media showed the adsorption of MB on the PPT beads through cation exchanging or electrostatic interactions.54 For the electrostatic interaction, the negative group of
O– is released on the surface of the PPT beads due to deprotonation with certain pH. The second is chemical reaction between –OH group of the PVA and the reactive group Cl– in MB, leading to MB adsorption on the surface.55 The third one is hydrogen bonding interaction between the reactive –OH groups of PVA and the imines groups –RCH=NR of the MB. As is shown in FTIR analysis, the –OH stretching frequency of PPT almost disappeared in PPT-MB, which indicated the –OH on PVA participated in MB dye adsorption process through hydrogen bonding.
Conclusions
In this study, novel PAN/PVA/TiO2 organic/inorganic nanocomposite beads with high MB removal efficiency and excellent regeneration ability were successfully developed by an easy and feasible strategy. The adsorption kinetics and isotherms studies suggested that the whole adsorption process was fitted better with pseudo-second order model (R2 > 0.99) and the maximum MB adsorption capacity approached 242.13 mg g-1 with a removal percentage of 98.4% calculated by Langmuir isotherm model (R2 > 0.99). Additionally, the PPT beads can be pretty easily separated Figure 12. (a) Desorption efficiency for different desorption eluent, and (b) regeneration cycle.
Table 3. Comparison of adsorption capacities for MB of various adsorbents
Adsorbent Adsorption capacity / (mg g-1) Photocatalytic (preparation) Reference
PVA 123.3 no (easy) 13
Molecularly imprinted sericin/PVA 223.21 no (complex) 30
Polyaniline/PVA/clinoptilolite 44.44 no (complex) 31
Alginate/PVA-kaolin 30.8 no (easy) 32
MR-PVA/ATP 45.87 no (complex) 33
Sericin/β-cyclodextrin/PVA 187.97 no (complex) 34
PPT 242.13 yes (easy) this work
from MB solutions after finishing adsorption and can be reused at least five times with negligible loss of adsorption capacity and removal efficiency. Therefore, the as-prepared PPT beads are expected to be a potential candidate for effluents treatment.
Acknowledgments
This work was supported by the Doctoral Scientific Research Foundation of Fuzhou University (No. 022578).
References
1. Han, S.; Wang, T.; Li, B.; J. Appl. Polym. Sci. 2017, 134, 23. 2. Liu, C.; Omer, A. M.; Ouyang, X.; Int. J. Biol. Macromol. 2018,
106, 823.
3. Zhang, P.; Lo, I.; O’Connor, D.; Pehkonen, S.; Cheng, H.; Hou, D.; J. Colloid Interface Sci. 2017, 508, 39.
4. Liu, F.; Zou, H.; Hu, J.; Liu, H.; Peng, J.; Chen, Y.; Liu, F.;
Chem. Eng. J. 2016, 287, 410.
5. Petrucci, E.; Di Palma, L.; Lavecchia, R.; Zuorro, A.; J. Ind. Eng. Chem. 2015, 26, 116.
6. Wang, Y.; Song, X.; Zhang, J.; J. Radioanal. Nucl. Chem. 2015,
306, 477.
7. Mittal, H.; Maity, A.; Ray, S. S.; Int. J. Biol. Macromol. 2015,
79, 8.
8. Zhuang, Y.; Yu, F.; Chen, J.; Ma, J.; J. Environ. Chem. Eng. 2016, 4, 147.
9. Postai, D. L.; Demarchi, C. A.; Zanatta, F.; Melo, D. C. C.; Rodrigues, C. A.; Alexandria Eng. J. 2016, 55, 1713. 10. Chang, J.; Ma, J.; Ma, Q.; Zhang, D.; Qiao, N.; Hu, M.; Ma,
H.; Appl. Clay Sci. 2016, 119, 132.
11. Dahlan, N. A.; Ng, S. L.; Pushpamalar, J.; J. Appl. Polym. Sci. 2017, 134, article ID 44271.
12. Wu, Z.; Zhong, H.; Yuan, X.; Wang, H.; Wang, L.; Chen, X.; Zeng, G.; Wu, Y.; Water Res. 2014, 67, 330.
13. Agarwal, S.; Sadegh, H.; Monajjemi, M.; Hamdy, A. S.; Ali, G. A. M.; Memar, A. O. H.; Shahryari-ghoshekandi, R.; Tyagi, I.; Gupta, V. K.; J. Mol. Liq. 2016, 218, 191.
14. Yu, M.; Li, J.; Wang, L.; Chem. Eng. J. 2017, 310, 300. 15. Balarak, D.; Jaafari, J.; Hassani, G.; Mahdavi, Y.; Tyagi, I.;
Agarwal, S.; Gupta, V. K.; Colloid Interface Sci. Commun. 2015, 7, 16.
16. Coruh, S.; Geyikci, F.; Ergun, O. N.; Environ. Technol. 2011,
32, 1183.
17. El-Mekkawi, D. M.; Ibrahim, F. A.; Selim, M. M.; J. Environ. Chem. Eng. 2016, 4, 1417.
18. Balkız, G.; Pingo, E.; Kahya, N.; Kaygusuzet, H.; Erim, F. B.;
Water, Air, Soil Pollut.2018, 229, 131.
19. Anfar, Z.; Haouti, R. E.; Lhanafi, S.; Benafqir, M.; Azougarh, Y.; Alem, N. E.; J. Environ. Chem. Eng. 2017, 5, 5857.
20. Uyar, G.; Kaygusuz, H.; Erim, F. B.; React. Funct. Polym. 2016,
106, 1.
21. Manikandan, G.; Senthil, K. P.; Saravanan, A.; J. Ind. Eng. Chem. 2018, 62, 446.
22. Lam, W. H.; Chong, M. N.; Horri, B. A.; Tey, B. T.; Chan, E. S.; J. Appl. Polym. Sci. 2017, 134, ID 45002.
23. Nagarjuna, R.; Roy, S.; Ganesan, R.; Microporous Mesoporous Mater.2015, 211, 1.
24. Hegedűs, P.; Szabó-Bárdos, E.; Horváth, O.; Szabó, P.; Horváth, K.; Catal. Today2017, 284, 179.
25. Thomas, M.; Naikoo, G. A.; Sheikh, M. U. D.; Bano, M.; Khan, F.; J. Photochem. Photobiol., A2016, 327, 33.
26. Islam, M. S.; Karim, M. R.; Colloids Surf., A2010, 366, 135. 27. Katmiwati, E.; Nakanishi, T.; Macromol. Res. 2014, 22, 731. 28. Sulaiman, S. L.; Harun, Z.; Ahmad, S.; Taib, H.; J. Teknol.2013,
65, 25.
29. Stone, S. A.; Gosavi, P.; Athauda, T. J.; Ozer, R. R.; Mater. Lett. 2013, 112, 32.
30. Zhao, R.; Li, X.; Sun, B.; Li, Y.; Li, Y.; Wang, C.; Chem. Res. Chin. Univ.2017, 33, 986.
31. Rashidzadeh, A.; Olad, A.; Desalin. Water Treat.2013, 51, 7057.
32. Abd El-Latif, M. M.; El-Kady, M. F.; Ibrahim, A. M.; Ossman, M. E.; J. Am. Sci. 2010, 6, 280.
33. Yang, L.; Li, Y.; Hu, H.; Jin, X.; Ye, Z.; Ma, Y.; Zhang, S.; Chem. Eng. J. 2011, 173, 446.
34. Zhao, R.; Wang, Y.; Li, X.; Sun, B.; Jiang, Z.; Wang, C.; Colloids Surf., B2015, 136, 375.
35. Moon, J. K.; Jung, C. H.; Lee, E. H.; Kim, H. T.; Shul, Y. G.;
Korean J. Chem. Eng.2002, 19, 838.
36. Sebesta, F.; John, J.; Motl, A.; Stamberg, K.; Evaluation of Polyacrylonitrile (PAN) as a Binding Polymer for Absorbers Used to Treat Liquid Radioactive Wastes, Contractor Report SAND95-2729; National Technical Information Service: Springfield, 1995.
37. Moon, J. K.; Kim, K. M.; Jung, C. H.; Shul, Y. G.; Lee, E. H.;
J. Radioanal. Nucl. Chem. 2000, 246, 299.
38. Sun, D.; Zhang, X.; Wu, Y.; Liu, X.; J. Hazard. Mater. 2010,
181, 335.
39. Mahmoud, M. E.; Nabil, G. M.; El-Mallah, N. M.; Bassiouny, H. I.; Kumar, S.; Abdel-Fattah, T. M.; J. Ind. Eng. Chem. 2016,
37, 156.
40. Zhou, C.; Wu, Q.; Lei, T.; Negulescu, I. I.; Chem. Eng. J. 2014,
251, 17.
41. Thakur, S.; Pandey, S.; Arotiba, O. A.; Carbohydr. Polym. 2016,
153, 34.
42. Deng, S.; Bai, R.; Chen, J. P.; Langmuir2003, 19, 5058. 43. Abbasizadeh, S.; Keshtkar, A. R.; Mousavian, M. A.; J. Ind.
Eng. Chem.2014, 20, 1656.
44. Zhang, F.; Yin, X.; Zhang, W.; Ji, Y.; J. Taiwan Inst. Chem. Eng.
45. Zhu, H.; Fu, Y.; Jiang, R.; Yao, J.; Xiao, L.; Zeng, G.; Bioresour. Technol. 2012, 105, 24.
46. Zhu, G.; Wang, F.; Xu, K.; Gao, Q.; Liu, Y.; Polim.: Cienc. Tecnol.2013, 23, 146.
47. Ma, S.; Hou, J.; Yang, H.; Xu, Z.; J. Porous Mater. 2018, 25, 1071.
48. Wang, B.; Chen, Z.; Zhang, J.; Cao, J.; Wang, S.; Tian, Q.; Gao, M.; Xu, Q.; Colloids Surf., A 2014, 457, 318.
49. Wang, M.; Cai, L.; Jin, Q.; Zhang, H.; Fang, S.; Qu, X.; Zhang, Z.; Zhang, Q.; Sep. Purif. Technol. 2017, 172, 217.
50. Piscopo, A.; Robert, D.; Weber, J. V.; Appl. Catal., B2002, 35, 117.
51. Bouzaida, I.; Ferronato, C.; Chovelon, J. M.; Rammah, M. E.; Herrmann, J. M.; J. Photochem. Photobiol., A 2004, 168, 23. 52. Cao, C.; Xiao, L.; Chen, C.; Shi, X.; Cao, Q.; Gao, L.; Powder
Technol. 2014, 260, 90.
53. Bhattacharyya, K. G.; Gupta, S. S.; Adsorption2006, 12, 185. 54. Wang, L.; Zhang, J.; Wang, A.; Colloids Surf., A2008, 322, 47. 55. Umoren, S. A.; Etim, U. J.; Israel, A. U.; J. Mater. Environ. Sci.
2013, 4, 75.
Submitted: June 2, 2018 Published online: August 31, 2018