strong predictor of metabolic syndrome in type 2
diabetes mellitus
M. Zahid Kocak1 Gulali Aktas1 Edip Erkus1 Isa Sincer2 Burcin Atak1 Tuba Duman1
1. Abant Izzet Baysal University, Faculty of Medicine, Department of Internal Medicine, Bolu, Turkey
2. Abant Izzet Baysal University, Faculty of Medicine, Department of Cardiology, Bolu, Turkey
http://dx.doi.org/10.1590/1806-9282.65.1.9
SUMMARY
OBJECTIVE: Metabolic syndrome (MS) is a clinical entity that associated with increased risk of type 2 Diabetes Mellitus (DM) and car-diovascular diseases. Serum uric acid levels are correlated MS criteria. We hypothesized whether a uric acid to HDL-cholesterol ratio (UHR) could predict diabetic regulation and presence of MS in type 2 diabetic subjects.
METHODS: Admissions of the subjects with type 2 DM to outpatient clinics of our institution were retrospectively analyzed. Study pop-ulation grouped into well-controlled and poorly controlled diabetics according to the HbA1c level (cut off 7%) and further grouped into type 2 DM with and without MS according to the presence of MS. UHR of study groups compared.
RESULTS: A hundred diabetic subjects enrolled. Mean UHR was significantly lower in well-controlled diabetics (9.7 ± 3.7%) compared to poorly controlled subjects (14 ± 5.4%) (p<0.001). Median UHR of diabetics with MS (13 (6-29) %) was greater than that of the diabetics without MS (9 (3-16) %) (p<0.001). UHR greater than 11% has 77% sensitivity and 60% specifity in predicting worse diabetic control (AUC: 0.752, p<0.001) and a UHR greater than 10.6% has 83% sensitivity and 71% specifity in predicting MS (AUC: 0.839, p<0.001). Sensitivity and specifity of UHR in predicting MS were better than most of the sensitivities and specifities of the five criteria of MS.
CONCLUSION: We suggest utilization of UHR in diagnosis of MS as a novel criteria. Nevertheless, prospective studies with larger popu-lation may make a better scientific evidence in that issue.
KEYWORDS: Metabolic syndrome. Diabetes mellitus, type 2. Uric acid. HDL-cholesterol.
DATE OF SUBMISSION: 27-May-2018
DATE OF ACCEPTANCE: 20-Jun-2018
CORRESPONDING AUTHOR: Gulali Aktas
Abant Izzet Baysal University Hospital, Department of Internal Medicine, 14280 Golkoy, Bolu, Turkey Phone Number: +903742534656
Fax Number: +903742534615 E-mail: draliaktas@yahoo.com
mehmetzahidkocak@hotmail.com dr.ediperkus@gmail.com isasincer@yahoo.com burcinatak@hotmail.com doktortuuba@gmail.com
INTRODUCTION
The term of metabolic syndrome (MS) first used by Haller and Hanefeld1 and was defined as combi-nation of risk factors attributable to adverse events, such as, type 2 diabetes mellitus and cardiovascular diseases. Synonyms of MS are syndrome X, Reav-en syndrome, dysmetabolic syndrome X, CHAOS, plurimetabolic syndrome, the deadly quartet, and
Associa-tion for the Study of Obesity in 2009. CombinaAssocia-tion of three or more of 5 criteria (systolic blood pressure ≥130 mmHg or diastolic blood pressure ≥85 mmHg or treated, fating plasma glucose≥100mg/dl or treat-ed, waist circumference ≥102 cm in men and 88 cm in women, HDL-cholesterol <40 mg/dl in men and <50 mg/dl in women, triglyceride ≥150 mg/dl) make the diagnosis of MS.
Uric acid is synthesized by the enzyme xanthine oxidase during the metabolism of purines. High lev-els of serum uric acid contribute to development of adverse conditions3. Criteria of MS were found to be correlated with serum uric acid levels4-6. Population with higher uric acid levels are more likely to develop MS7.
Both type 2 diabetes mellitus (DM) and MS are considered as metabolic disorders. Presence of MS and its components are increased by elevated serum uric acid levels in type 2 diabetic subjects8.
According to strong relation between serum uric acid and type 2 DM and MS, we hypothesized wheth-er a uric acid to HDL-cholestwheth-erol ratio (UHR) could predict diabetic regulation and presence of MS in type 2 diabetic subjects.
METHOD
Admissions of the subjects with type 2 DM to outpatient clinics of our institution between Octo-ber 2017 and January 2018 were retrospectively an-alyzed, after institutional approval obtained. Type 2 diabetics were enrolled to the study. Exclusion cri-teria were as follows; pregnancy, active malignant disease, treatment with drugs that interfere with serum uric acid levels (thiazides, furosemide, ace-tyl salicylic acid, etc…) and on medications that may alter serum lipid levels (i.e. statins, fibrates, niacin). Subjects with established hemolytic conditions and end stage renal failure were also excluded.
Age, gender, height, weight, waist circumference, duration of diabetes mellitus, systolic blood pressure and diastolic blood pressure were recorded from the patient files and computerized database of our clinic. Body mass index (BMI) is calculated with division of weight (in kg) by square of height (in meters). Arith-metic mean of blood pressure that measured in con-secutive 2 clinic visit in both arms were used as blood pressure measures.
Laboratory parameters, such as, fasting plasma glucose, blood urea, serum creatinine,
total-choles-terol, LDL-cholestotal-choles-terol, HDL-cholestotal-choles-terol, triglyceride, serum uric acid, glomerular filtration rate (eGFR), glycated hemoglobin (HbA1c) were obtained from the same database and patient files. Plasma non HDL-cholesterol was simply calculated by following formula: total cholesterol- HDL cholesterol. UHR is calculated with division of serum uric acid by HDL cholesterol. Uric acid to non HDL cholesterol ratio is measured by the following formula: uric acid/non HDL cholesterol.
Patients grouped in to two groups according to HbA1c levels. Diabetics with HbA1c lower than 7% were classified as well-controlled type 2 DM group and subjects with HbA1c equal to or greater than 7% were classified as poorly controlled diabetics.
Study population were grouped into another two groups according to the presence of MS. Diagnosis of MS established according to the 2009 harmonized criteria of IDF, AHA/NHLBI, the World Heart Feder-ation, the International Atherosclerosis Society, and the International Association for the Study of Obe-sity. Presence of three of five criteria (systolic blood pressure ≥130mmHg or diastolic blood pressure ≥85 mmHg or treated, fasting plasma glucose≥100mg/dl or treated, waist circumference ≥102 cm in men and 88 cm in women, HDL-cholesterol <40 mg/dl in men and <50 mg/dl in women, triglyceride ≥150 mg/dl) make the diagnosis of MS.
Data were analyzed by SPSS software. (SPSS 15.0; IBM Inc., Chicago, IL, USA). Distribution of the vari-ables in study groups were conducted by Kolmog-orov-Smirnov test. Homogenously distributed vari-ables expressed as mean ± standard deviation and compared with independent samples t test. Non-ho-mogenously distributed variables were expressed as median (minimum-maximum) and compared with Mann Whitney U test. Categorical variables were compared in study groups with Chi-square test. Re-ceiver Operative Characteristics (ROC) analyze used to determine cut-off values of UHR in predicting poor-ly controlled DM and in predicting MS. A Pearson’s analyze was used to find out correlation between uric acid, HDL-cholesterol, triglyceride, BMI, waist circumference, UHR and HbA1c. Statistically signifi-cance was set on a p value that lower than 0.05.
RESULTS
poorly controlled diabetics were 58.6 ± 10 years and 59.5 ± 8.4 years, respectively. Age difference was not statistically significant between well-controlled and poorly controlled type 2 DM groups (p=0.61). 22 (55%) of 40 in well-controlled group and 29 (48.3%) of 60 in poorly controlled group were women. Gender was not statistically different among well-controlled and poorly controlled type 2 DM groups (p=0.51).
Height (p=0.97), body weight (p=0.17), waist cir-cumference (p=0.06), BMI (p=0.12), systolic (p=0.28) and diastolic (p=0.73) blood pressures were not sig-nificantly different between well-controlled and poorly controlled type 2 DM groups.
Serum uric acid was 4.9 ± 1.4 mg/dl in well-con-trolled diabetics and 6 ± 1.6 mg/dl in poorly conwell-con-trolled type 2 DM subjects (p=0.001). HDL cholesterol of well-controlled type 2 DM group (50 [33-117] mg/dl) was significantly higher than that of the poorly con-trolled diabetic group (44 [25-73] mg/dl), (p<0.001). The mean UHRs of well-controlled and poorly con-trolled type 2 DM groups were 9.7 ± 3.7% and 14 ± 5.4%, respectively. The UHR difference was
statis-tically significant (p<0.001). Comparison of clinical and laboratory data of the well-controlled and poorly controlled diabetic subjects is summarized in table 1.
A ROC analyze performed to determine sensitivi-ty and specifisensitivi-ty of UHR in selecting poorly control in type 2 DM. UHR greater than 11% has 77% sensitivity and 60% specifity in predicting worse diabetic con-trol (AUC: 0.752, p<0.001).
Study population further grouped according to the existence of MS. There were 63 subjects with MS and 37 subjects without MS. Mean ages of the subjects with and without MS were 59.6 ± 9.1 years and 58.4 ± 9.2 years, respectively. Age difference was not statistically significant between groups (p=0.54). 29 (46%) of 63 in type 2 DM with MS group and 22 (59.5%) of 37 in type 2 DM without MS group were women. Gender was not significantly different be-tween groups (p=0.20). A total of 36 subjects were on antihypertensive treatment (28 in diabetics with MS and 8 in diabetics without MS groups).
Height (p=0.41), BMI (p=0.07), duration of type 2 DM (p=0.93), blood urea (p=0.92), serum creatinine
TABLE 1: COMPARISON OF CLINICAL AND LABORATORY DATA OF THE WELL-CONTROLLED AND
POORLY CONTROLLED TYPE 2 DM GROUPS
Well-controlled Type 2 DM Poorly controlled type 2 DM p
Gender Men (n (%)) 18 (45) 31 (51,7)
0.51
Women (n (%)) 22 (55) 29 (48,3)
Mean ± Standard Deviation
Age (years) 58,6 ± 10 59,5 ± 8,4 0.61
Height (m) 1,62 ± 0,1 1,63 ± 0,1 0.97
Weight (kg) 80 ± 15 84 ± 14 0.17
Total cholesterol (mg/dl) 185 ± 44 214 ± 45 0.003
Non HDL cholesterol (mg/dl) 132 ± 42 169 ± 46 <0.001
LDL cholesterol (mg/dl) 106 ± 33 125 ± 38 0.01
UHR (%) 9,7 ± 3,7 14 ± 5,4 <0.001
Uric acid (mg/dl) 4,9 ± 1,4 6 ± 1,6 0.001
eGFR (mL/min/1.73 m²) 86 ± 14 81 ± 14 0.08 Urea (mg/dl) 30,4 ± 9,8 34,8 ±12,7 0.07
Median (Min- Max)
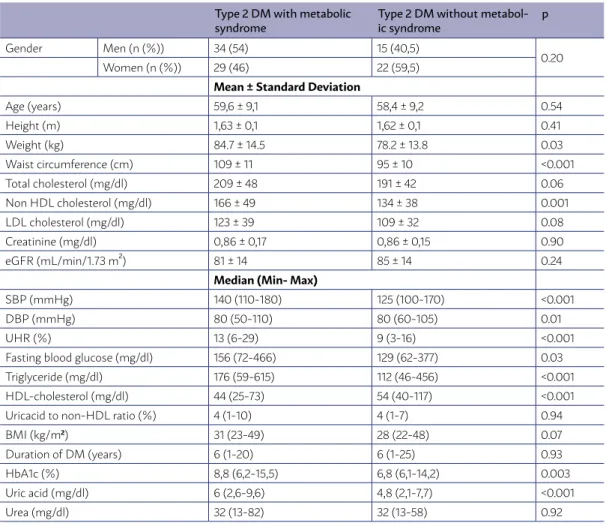
TABLE 2: COMPARISON OF CLINICAL AND LABORATORY DATA OF THE DIABETICS WITH AND WITHOUT METABOLIC SYNDROME
(p=0.90), total cholesterol (p=0.06), LDL cholesterol (p=0.08), and eGFR (p=0.24) were not significantly different between type 2 DM with and without MS groups.
Serum uric acid was 6 (2.6-9.6) mg/dl in diabet-ics with MS and 4.8 (2.1-7.7) mg/dl in diabetdiabet-ics with-out MS, reaching the difference significance level (p<0.001). HDL cholesterol of diabetics with MS group (44 [25-73] mg/dl) was significantly lower than that of the diabetics without MS group (54 [40-117] mg/dl), (p<0.001). The median UHRs of diabetics with and without MS groups were 13 (6-29) % and 9 (3-16) %, respectively. The UHR difference between groups was statistically significant (p<0.001). Comparison of clinical and laboratory data of the diabetics with and without MS groups is summarized in table 2.
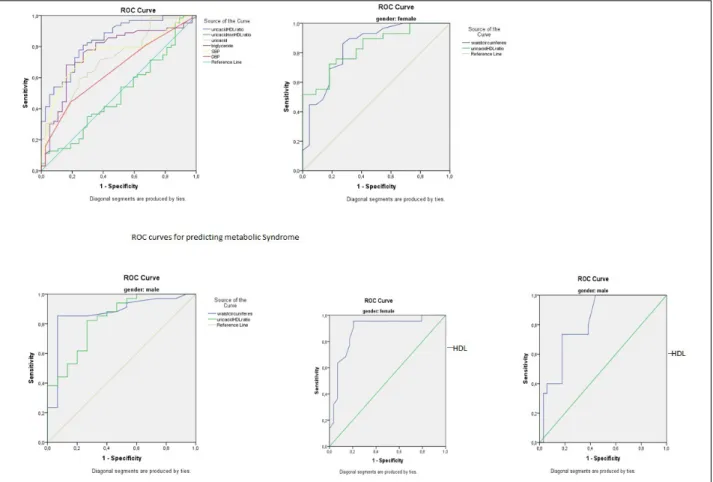
A ROC analyze performed to determine sensitiv-ity and specifsensitiv-ity of uric acid, UHR, uric acid to non-HDL cholesterol ratio, SBP (at ≥ 130 mmHg level), DBP (at ≥ 85 mmHg level), triglyceride (at ≥ 150mg/ dl level), waist circumference (at levels of ≥102 cm
for men and ≥88cm for women) and HDL cholesterol (at < 40 mg/dl for men and <50 mg/dl for women) lev-els in selecting subjects with MS. UHR greater than 10,6% has 83% sensitivity and 71% specifity in predict-ing MS (AUC: 0.839, p<0.001). Figure 1 shows the ROC curves of study parameters in predicting MS.
Pearson’s correlation analysis showed that UHR was positively correlated with waist circumference (r=0.32, p=0.001), fasting blood glucose (r=0.39, p<0.001), triglyceride (r=0.59, p<0.001) and HbA1c (r=0.54, p<0.001) levels. Neither body weight (r=0.19, p=0.06), nor BMI (r=0.13, p=0.21) were correlated with UHR. Additionally, UHR was not correlated with SBP (r=0.15, p=0.13) and DBP (r=0.06, p=0.58), either.
DISCUSSION
In present study, we showed that UHR predicts MS better than all established criteria of this clini-cal entity. Another important finding of our report
Type 2 DM with metabolic syndrome
Type 2 DM without metabol-ic syndrome
p
Gender Men (n (%)) 34 (54) 15 (40,5)
0.20
Women (n (%)) 29 (46) 22 (59,5)
Mean ± Standard Deviation
Age (years) 59,6 ± 9,1 58,4 ± 9,2 0.54
Height (m) 1,63 ± 0,1 1,62 ± 0,1 0.41
Weight (kg) 84.7 ± 14.5 78.2 ± 13.8 0.03
Waist circumference (cm) 109 ± 11 95 ± 10 <0.001
Total cholesterol (mg/dl) 209 ± 48 191 ± 42 0.06
Non HDL cholesterol (mg/dl) 166 ± 49 134 ± 38 0.001
LDL cholesterol (mg/dl) 123 ± 39 109 ± 32 0.08
Creatinine (mg/dl) 0,86 ± 0,17 0,86 ± 0,15 0.90
eGFR (mL/min/1.73 m²) 81 ± 14 85 ± 14 0.24
Median (Min- Max)
SBP (mmHg) 140 (110-180) 125 (100-170) <0.001 DBP (mmHg) 80 (50-110) 80 (60-105) 0.01
UHR (%) 13 (6-29) 9 (3-16) <0.001
is that UHR has high sensitivity and specifity as a marker of diabetic control.
Association between MS and serum uric acid levels is well established in the literature. In 2007, authors identified a substantial association between serum uric acid and MS prevalence9. Chang et al.7
reported that elevated serum uric acid levels were contributed to higher risk of MS. Moreover, elevated serum uric acid has been proposed as a risk factor for MS10. In present study, UHR was better than uric
acid alone as a marker of MS.
Evidence in literature suggest that serum uric acid levels was in association with each one diagnos-tic criteria of the MS10. Risk of development of type
2 DM is increased in subjects with elevated serum uric acid levels11,12. Indeed, increased uric acid was
associated with worse diabetic control in type 2 dia-betic subjects in a recent study13. On the other hand,
insulin resistance plays a pivotal role in development of both MS and type 2 DM. Therefore, such an associ-ation between high uric acid and development of type 2 DM and MS. Similar to the literature knowledge, since it is a uric acid derived indice, UHR was pos-itively and strongly correlated with fasting plasma
glucose and HbA1c levels in present study.
According to the Nakanishi et al.5’s study, not
only type 2 DM but also hypertension was more common in subjects with higher serum uric acid14. In
contrary, hypertension was not associated with high uric acid levels in a recent study by Wang et al.15. In
concordance, there was no significant correlation be-tween blood pressure and UHR levels in our report.
Significant positive correlation between UHR and triglyceride and inverse correlation between UHR and HDL-cholesterol levels in present study, suggest the previous results in literature. Uric acid was found to be positively correlated with serum triglyceride and negatively correlated with HDL-cholesterol lev-els in Peng et al.16’s report. However, increased
tri-glyceride and low HDL levels were not associated with increased risk of hyperuricemia in a Chinese study15. Correlation between UHR and triglyceride
was more significant and stronger than the correla-tion between uric acid and triglyceride in our study. Furthermore, inverse correlation between UHR and HDL was more significant and stronger than the cor-relation between uric acid and HDL.
Obesity is also associated with serum uric acid
levels through increased production pathways17.
However, literature data about association between uric acid levels and waist circumference, a mark-er of central obesity, is conflicting. Waist circum-ference was not associated with hyperuricemia in a recent study15. On the other hand, a significant
and positive correlation reported between waist cir-cumference and uric acid levels in another Chinese study18. We found that correlation between uric
acid and waist circumference was weaker than the correlation between UHR and waist circumference in this report.
Uric acid levels increase in chronic kidney dis-ease. However, serum creatinine and GFR values of subjects with and without MS were not different in present report. Thus, elevated UHR in subjects with MS only reflect the presence of this clinical entity.
Results of the present study showed that, in pre-dicting MS, UHR (at a cut of equal to or greater than 10,6%) had greater sensitivity than uric acid level (at a cut off equal to or higher than 5 mg/dl), triglycer-ide level (at a cut off equal to or higher than 150 mg/ dl), SBP (at a cut off equal to or greater than 130 mmHg), DBP (at a cut off equal to or greater than of 85mmHg), waist circumference in men (at a cut off equal to or higher than 102 cm) and HDL in men (at a cut off lower than 40 mg/dl). Only waist circumfer-ence in women (at a cut off equal to or higher than 88 cm) and HDL in women (at a cut off lower than 50 mg/dl) have higher sensitivity than UHR in predicting MS. Specifity of UHR (at a cut of equal to or greater
than 10,6%) in selecting MS was higher than uric acid level (at a cut off equal to or higher than 5mg/dl), SBP (at a cut off equal to or greater than 130 mmHg), HDL in men (at a cut off lower than 40mg/dl) and waist cir-cumference in women (at a cut off equal to or higher than 88cm). Triglyceride level (at a cut off equal to or higher than 150 mg/dl), DBP (at a cut off equal to or greater than of 85 mmHg), HDL in women (at a cut off lower than 50 mg/dl) and waist circumference in men (at a cut off equal to or higher than 102 cm) have higher specifity than UHR in selecting subjects with MS. Unlike waist circumference and HDL, it was not affected by gender, therefore, we are proud to intro-duce UHR as a novel and useful criteria in the diag-nosis of MS.
Limitations of present study are retrospective de-sign which could cause selection bias, and relatively small size of study cohort. However, to our knowl-edge, it is the first study in literature that reported UHR as a predictor of MS and worse diabetic control in type 2 DM.
CONCLUSION
Present study suggest that utilization of UHR is a useful tool in diagnosis of MS as a novel criteria. Nev-ertheless, prospective studies with larger population may make a better scientific evidence in that issue.
Conflict of interest: None Sources of Funding: None
RESUMO
CONTEXTO E OBJETIVO: A síndrome metabólica (SM) é uma entidade clínica associada ao aumento do risco de diabetes mellitus tipo 2 (DM) e doenças cardiovasculares. Os níveis séricos de ácido úrico estão correlacionados com os critérios estabelecidos de EM. Uma vez que DM tipo 2 e MS são distúrbios metabólicos, nós hipotetizamos se uma relação ácido úrico para HDL-colesterol (UHR) poderia predizer a regulação diabética e a presença de MS em diabéticos tipo 2.
MÉTODOS: As admissões dos sujeitos com DM tipo 2 aos ambulatórios de nossa instituição foram analisadas retrospectivamente. A população do estudo agrupou-se em diabéticos bem controlados e mal controlados, de acordo com o nível de HbA1c (corte de 7%) e posteriormente agrupados em DM tipo 2 com e sem EM de acordo com a presença de EM. UHR dos grupos de estudo comparados.
RESULTADOS: Um total de 100 indivíduos diabéticos tipo 2 inscritos no estudo. A média UHR foi significativamente menor em diabéticos bem controlados (9,7 ± 3,7%) em comparação com indivíduos com DM tipo 2 mal controlada (14 ± 5,4%) (p < 0,001). A mediana da UAR de diabéticos com EM (13 (6-29)%) foi maior que a dos diabéticos sem SM (9 (3-16)%) (p < 0,001). Um UHR maior que 11% tem 77% de sensibilidade e 60% de especificidade em predizer um pior controle diabético (AUC: 0,762, p < 0,001) e um UHR maior que 10,6% tem 83% de sensibilidade e 71% de especificidade em prever MS (AUC : 0,839, p < 0,001). A sensibilidade e especificidade de UHR em predizer MS foram melhores do que a maioria das sensibilidades e especificidades dos cinco critérios de MS.
CONCLUSÃO: Sugerimos a utilização da UHR no diagnóstico da SM como um novo critério. No entanto, estudos prospectivos com maior população podem fazer uma melhor evidência científica nessa questão.
REFERENCES
1. Haller H, Hanefeld M. Synoptische betrachtung metabolischer risikofak-toren. Lipidstoffwechselstörungen. 1975;254-64.
2. Samson SL, Garber AJ. Metabolic syndrome. Endocrinol Metab Clin North
Am. 2014;43(1):1-23.
3. Nejatinamini S, Ataie-Jafari A, Qorbani M, Nikoohemat S, Kelishadi R,
As-ayesh H, et al. Association between serum uric acid level and metabolic syndrome components. J Diabetes Metab Disord. 2015;14(1):1-7.
4. Sundström J, Sullivan L, D’Agostino RB, Levy D, Kannel WB, Vasan RS. Relations of serum uric acid to longitudinal blood pressure tracking and hypertension incidence. Hypertension. 2005;45(1):28-33.
5. Nakanishi N, Okamoto M, Yoshida H, Matsuo Y, Suzuki K, Tatara K. Serum
uric acid and risk for development of hypertension and impaired fasting glucose or type II diabetes in Japanese male office workers. Eur J Epidemi-ol. 2003;18(6):523-30.
6. Shih M-H, Lazo M, Liu S-H, Bonekamp S, Hernaez R, Clark JM.
Associa-tion between serum uric acid and nonalcoholic fatty liver disease in the US population. J Formos Med Assoc. 2015;114(4):314-20.
7. Chang JB, Chen YL, Hung YJ, Hsieh CH, Lee CH, Pei D, et al. The role of
uric acid for predicting future metabolic syndrome and type 2 diabetes in older people. J Nutr Health Aging. 2017;21(3):329-35.
8. Bonakdaran S, Kharaqani B. Association of serum uric acid and metabolic syndrome in type 2 diabetes. Curr Diabetes Rev. 2014;10(2):113-7.
9. Choi HK, Ford ES. Prevalence of the metabolic syndrome in individuals with hyperuricemia. Am J Med. 2007;120(5):442-7.
10. Chen YY, Kao TW, Yang HF, Chou CW, Wu CJ, Lai CH, et al. The
associ-ation of uric acid with the risk of metabolic syndrome, arterial
hyperten-sion or diabetes in young subjects: an observational study. Clin Chim Acta. 2018;478:68-73.
11. Krishnan E, Pandya BJ, Chung L, Hariri A, Dabbous O. Hyperuricemia in
young adults and risk of insulin resistance, prediabetes, and diabetes: a 15-year follow-up study. Am J Epidemiol. 2012;176(2):108-16.
12. Woyesa SB, Hirigo AT, Wube TB. Hyperuricemia and metabolic
syn-drome in type 2 diabetes mellitus patients at Hawassa university compre-hensive specialized hospital, South West Ethiopia. BMC Endocr Disord. 2017;17(1):76.
13. Duman TT, Kocak MZ, Atak BM, Erkus E. Serum uric acid is correlated with
HbA1c levels in type 2 diabetes mellitus. Exp Biomed Res. 2018;1(1):6-9.
14. Kelliny C, William J, Riesen W, Paccaud F, Bovet P. Metabolic syndrome
according to different definitions in a rapidly developing country of the African region. Cardiovasc Diabetol. 2008;7(1):1-11.
15. Wang J, Chen RP, Lei L, Song QQ, Zhang RY, Li YB, et al. Prevalence and
determinants of hyperuricemia in type 2 diabetes mellitus patients with central obesity in Guangdong Province in China. Asia Pac J Clin Nutr. 2013;22(4):590-8.
16. Peng TC, Wang CC, Kao TW, Chan JY, Yang YH, Chang YW, et al.
Relation-ship between hyperuricemia and lipid profiles in US adults. Biomed Res Int. 2015;2015(2015):127596.
17. Hikita M, Ohno I, Mori Y, Ichida K, Yokose T, Hosoya T.
Relation-ship between hyperuricemia and body fat distribution. Intern Med. 2007;46(17):1353-8.
18. Chen LY, Zhu WH, Chen ZW, Dai HL, Ren JJ, Chen JH, et al. Relationship