www.jped.com.br
ORIGINAL ARTICLE
Association of uric acid levels with components of metabolic
syndrome and non-alcoholic fatty liver disease in overweight or
obese children and adolescents
夽
Anajás S. Cardoso
a, Nathalia C. Gonzaga
b,∗, Carla C.M. Medeiros
c,
Danielle F. de Carvalho
caPhD Student in Nursing. Universidade Federal da Paraíba (UFPB), João Pessoa, PB, Brazil bPhD Student in Nursing. Universidade Federal do Ceará (UFC), Fortaleza, CE, Brazil
cPhD in Child and Adolescent Health. Professors, Programa de Pós-graduac¸ão em Saúde Pública, UEPB, Campina Grande, PB,
Brazil
Received 6 September 2012; accepted 27 December 2012 Available online 19 June 2013
KEYWORDS
Uric acid;
Metabolic syndrome X;
Fatty liver; Cardiovascular diseases; Obesity
Abstract
Objective: To investigate the association between serum uric acid concentration according to the presence or absence of non-alcoholic fatty liver disease (NAFLD) and/or metabolic syndrome (MS) in overweight or obese children and adolescents.
Methods: This was a cross-sectional study conducted from April of 2009 to March of 2010, including 129 children and adolescents treated at the Center for Childhood Obesity. Anthro-pometric data, blood pressure measurements, and laboratory test results were obtained, and NAFLD diagnosis was made by ultrasound. The diagnosis of MS was made using the criteria of the National Cholesterol Education Program/Adult Treatment Panel III, adapted to age range. The chi-squared test or or Fisher’s test were used to evaluate the association of uric acid with the groups, with a 95% confidence interval. One-way analysis of variance (ANOVA) was used for comparison of means. Multiple logistic regression was used for adjustment of variables. The data were analyzed with the Statistical Package for Social Sciences (SPSS), release 17. Results: High levels of uric acid were significantly associated with adolescence, MS, and sys-tolic blood pressure. The highest quartile of uric acid showed significantly higher values of body mass index, waist circumference, systolic blood pressure, diastolic blood pressure, triglyceri-des, total cholesterol, and homeostatic model assessment index (HOMA-IR), and lower mean values of HDL cholesterol. In the final model, only age range and the presence of MS remained associated with uric acid levels.
Conclusions: High levels of uric acid were associated with MS and adolescence, which was not observed with NAFLD.
© 2013 Sociedade Brasileira de Pediatria. Published by Elsevier Editora Ltda. All rights reserved.
夽 Please cite this article as: Cardoso AS, Gonzaga NC, Medeiros CC, de Carvalho DF. Association of uric acid levels with components of metabolic syndrome and non-alcoholic fatty liver disease in overweight or obese children and adolescents. J Pediatr (Rio J). 2013;89:412---8.
∗Corresponding author.
E-mail:nathaliacgonzaga@gmail.com (N.C. Gonzaga).
PALAVRAS-CHAVE
Ácido úrico; Síndrome X metabólica; Fígado gorduroso; Doenc¸as
cardiovasculares; Obesidade
Relac¸ão entre ácido úrico e os componentes da síndrome metabólica e esteatose hepática não alcoólica em crianc¸as e adolescentes com sobrepeso ou obesidade
Resumo
Objetivo: Verificar a relac¸ão entre a concentrac¸ão de ácido úrico sérico de acordo com a presenc¸a ou não de esteatose hepática não alcoólica e/ou síndrome metabólica (SM) em crianc¸as e adolescentes com sobrepeso ou obesidade.
Métodos: Estudo transversal desenvolvido no período de abril/2009 a marc¸o/2010, incluindo 129 crianc¸as e adolescentes atendidos no Centro de Obesidade Infantil. Foi realizada antropometria, aferic¸ão da pressão arterial, dosagem dos exames laboratoriais e o diagnóstico de esteatose hepática por exame ultrassonográfico. Para o diagnóstico de SM, foram utilizados os critérios daNational Cholesterol Education Program/Adult Treatment Panel IIIadaptados para faixa etária. Para avaliac¸ão da associac¸ão do ácido úrico com os grupos, foi realizado o teste do Qui-quadrado ou Fisher, adotando-se o intervalo de confianc¸a de 95%. Para comparac¸ão de médias, utilizou-se o ANOVA One Way. Para o ajuste das variáveis foi utilizada a regressão logística múltipla. Os dados foram processados no SPSS versão 17.
Resultados: Níveis elevados de ácido úrico associaram-se significativamente à adolescência, SM e pressão arterial sistólica. O maior quartil de ácido úrico apresentou valores médios signi-ficativamente mais elevados de índice de massa corpórea, circunferência abdominal, pressão arterial sistólica, pressão arterial diastólica, triglicerídeos, colesterol total e HOMA-IR, e menor média do colesterol HDL. No modelo final só permaneceram associadas aos níveis de ácido úrico a faixa etária e a presenc¸a de síndrome metabólica.
Conclusões: Níveis elevados de ácido úrico estiveram associados à síndrome metabólica e à adolescência, o que não foi observado com a esteatose hepática.
© 2013 Sociedade Brasileira de Pediatria. Publicado por Elsevier Editora Ltda. Todos os direitos reservados.
Introduction
Uric acid at normal plasma levels has been known to exert a neuroprotective effect, by acting as a free-radical scavenger; however, several observational studies have indi-cated that high levels of serum uric acid are associated with the risk of cardiovascular disease and may be useful in the assessment of individual cardiovascular risk. Further-more, high uric acid levels have also been associated with insulin resistance (IR), diabetes mellitus type 2 (DM2), and metabolic syndrome (MS).1,2
Among these cardiometabolic alterations, MS has been stressed, as it represents a set of risk factors, which con-sists of alterations in the metabolism of carbohydrates --- hyperinsulinemia, IR, glucose intolerance or DM2, lipid metabolism alterations (increased triglycerides (TG) and/or decreased cholesterol bound to high-density lipoprotein [HDL]), abdominal obesity, and high blood pressure.3
The hepatic expression of MS is nonalcoholic fatty liver disease (NAFLD), which is characterized by fat deposition in the hepatocytes of patients with little or no alcohol ingestion.4 In a study of 102 adults diagnosed with dia-betes, it was observed that almost half NAFLD, and they also presented higher BMI and uric acid levels than individuals without NAFLD.5
Despite evidence that uric acid is considered a car-diometabolic risk factor,6 there is no reference in the literature to the association between this biochemical vari-able and steatosis in the pediatric population, especially among obese or overweight children and adolescents. Thus, this study aimed to investigate the association between
serum uric acid levels according to the presence or absence of NAFLD and/or MS in overweight or obese children and adolescents.
Methods
This was a cross-sectional study with a quantitative approach performed between July of 2009 and March of 2010, as part of a larger project entitled ‘‘Prevalence of cardiometabolic risk factors in overweight or obese children and adolescents’’, approved by the Ethics Research Commit-tee of the Universidade Estadual da Paraíba, under process No. 0040.0.133.000-08.
A convenience sample was used, consisting of overweight or obese children and adolescents aged between 2 and 18 years who were referred by health teams to the Childhood Obesity Center (Centro de Obesidade Infantil --- COI), imple-mented at the Instituto de Saúde Elpídio de Almeida (ISEA), located in Campina Grande, state of Paraíba, Brazil, The enrollment was carried out at the Basic Health Units under the supervision of the health department of that municipal-ity. The COI consists of researchers and a multidisciplinary team comprising endocrinologists, nutritionists, psychol-ogists, nurses, pharmacists, social workers, and physical trainers.
that interfered with glucose metabolism or lipids, such as steroids, were excluded. Two individuals were excluded due to corticosteroid use; thus, a total of 129 individuals were evaluated.
Parents or guardians who agreed to let their children participate in the study signed an informed consent, after being informed of the goals, methods, and procedures to be followed.
Data on socioeconomic status and personal and fam-ily history were obtained; anthropometric measurements were assessed by previously trained students, and labora-tory testing and ultrasound examination were scheduled. Two measurements of anthropometric data (weight, height, and waist circumference) were performed on the same day, and the mean value was used in the analysis. Nutritional sta-tus was classified using the World Health Organization (WHO) Anthro (for children younger than 5 years) and AnthroPlus (≥5 years) software, obtaining the z-score related to body mass index (BMI) for age.
For children younger than 5 years, the use of the international reference by the WHO published in 2006 is recommended, classifying them as: at risk for overweight (z score + 1 < BMI≤z score + 2), overweight (z score + 2 < BMI ≤z score + 3), and obesity (BMI > z score + 3). For children aged 5 to 19 years, the use of the reference published by the WHO in 2007 is recommended, considering the follow-ing categories: overweight (z score + 1 < BMI≤z score + 2), obesity (z score + 2 < BMI≤z score + 3), and severe obesity (BMI > z score + 3).7
For statistical analysis, the nutritional status was cate-gorized into two groups, considering children younger than 5 years to be overweight when z score + 1 < BMI≤z score + 3 and obese, when BMI > z score + 3; those aged 5 years or older were considered to be overweight when z score + 1 < BMI < z score + 2 and obese, when BMI≥z score + 2.
The waist circumference (WC) was measured using an inelastic tape at midpoint between the superior border of the iliac crest and the inferior costal margin. Values >90th percentile were considered increased. However, girls with WC≥88 cm and boys with WC≥102 cm were considered as having altered results regardless of the percentile.8
Three blood pressure measurements were performed with a two-minute interval between them, according to the method established in the V Brazilian guidelines on hypertension.9The mean of the last two measurements was considered as the systolic (SBP) and diastolic (DBP) blood pressure values.
The diagnosis of steatosis was based on the results of ultrasonography of the upper abdomen, performed at the Hospital Universitário Alcides Carneiro (HUAC), by a sin-gle radiologist blinded to clinical data and laboratory test results. The equipment used was a MedisonSonoAce Prime 8000EX, with a multifrequency convex transducer of 5 MHz. Alterations in liver parenchyma were classified as nor-mal, mild, moderate, and severe diffuse steatosis.10 This classification uses as parameters the liver echogenicity in comparison with the renal cortex, the echo penetration intensity in the liver parenchyma, the diaphragm visibility, and the echogenicity of the liver vascular structures.11
Blood collection was performed after a 10 to 12 hour fast, at the Clinical Analysis Laboratory of the Universidade Estadual da Paraíba (LAC/UEPB).
The measurements of uric acid, HDL-C, TG, and glucose were performed by the enzymatic colorimetric method in automated equipment (BioSystems 310 model), according to the recommendations of the Labtest® kit manufacturer. Insulin was measured by chemiluminescence in automated equipment (IMMULITE 1000 - SIEMENS®). Hyperuricemia was considered with values > 5.5 mg/dL.12The homeostatic model assessment index (HOMA-IR) was used as the criterion for the diagnosis of IR. The cutoff used was HOMA-IR≥2.5.13 The diagnosis of MS was attained using the criteria recommended by the National Cholesterol Education Pro-gram/Adult Treatment Panel III14adapted to the age group, which considers as MS the presence of at least three of the following items: WC≥90th percentile for age, gender, and ethnicity; TG≥130 mg/dL and/or HDL-C < 45 mg/dL, fasting glucose≥100 mg/dL, SBP and/or DBP > 90th percentile for gender, height, and age. The cutoffs for TG, HDL-C, and fasting glucose followed the values recommended in the I guideline for atherosclerosis prevention in childhood and adolescence.15
The following groups were considered according to the presence and/or absence of MS and NAFLD: G1 - presence of MS and steatosis; G2 - presence of MS without steatosis; G3 - absence of MS and presence of steatosis; G4 --- absence of MS and steatosis.
The data were presented as proportions, means, and standard deviations (SD). After applying the Kolmogorov-Smirnoff test to assess for normality, the association of uric acid levels with gender, age range, ethnicity, nutri-tional status, WC, SBP, DBP, TG, fasting glucose, IR, MS, and hepatic steatosis was verified using the chi-squared or Fisher’s exact test, when necessary, with a 95% confi-dence interval (95% CI) and prevalence ratio (PR). One way analysis of variance (ANOVA) was used for comparison of the means of MS components according to quartiles of uric acid and, when necessary, using Bonferroni’s post hoc test.
Multiple logistic regression was used for variable adjust-ment, whose criterion for variable inclusion was the association with the dependent variable in the bivariate analysis with p-value < 0.20. The variables were included in the regression analysis using the ‘enter’ method, according to the decreasing value of odds ratio. The Hosmer-Lemeshow test was used as a measure of quality-of-fit for the logistic regression models, in which a p-value≥0.05 indicates that the model is adjusted.
All analyses were two-tailed and were performed using the Statistical Package for Social Sciences (SPSS), release 17.0 (SPSS Inc, Chicago, USA) with the significance level set at 5%.
Results
The mean uric acid level found was 4.191 mg/dL (± SD = 2.32). Hyperuricemia was observed in 12.4% (16/129) of assessed individuals, MS in 49.6% (64/129), and RI was diagnosed in 44.2% (57/129) of them. NAFLD was diagnosed in 28.7% (37/129) of children and adolescents.
Low levels of HDL-C were observed in 85.3% (110/129) of the assessed individuals, and 39.5% (51/129) had hyper-triglyceridemia. Hyperglycemia was observed in only 0.8% (1/129) of the assessed individuals. SBP was high in 34.1% (44/129) and DBP in 64.3% (83/129) of the individuals.
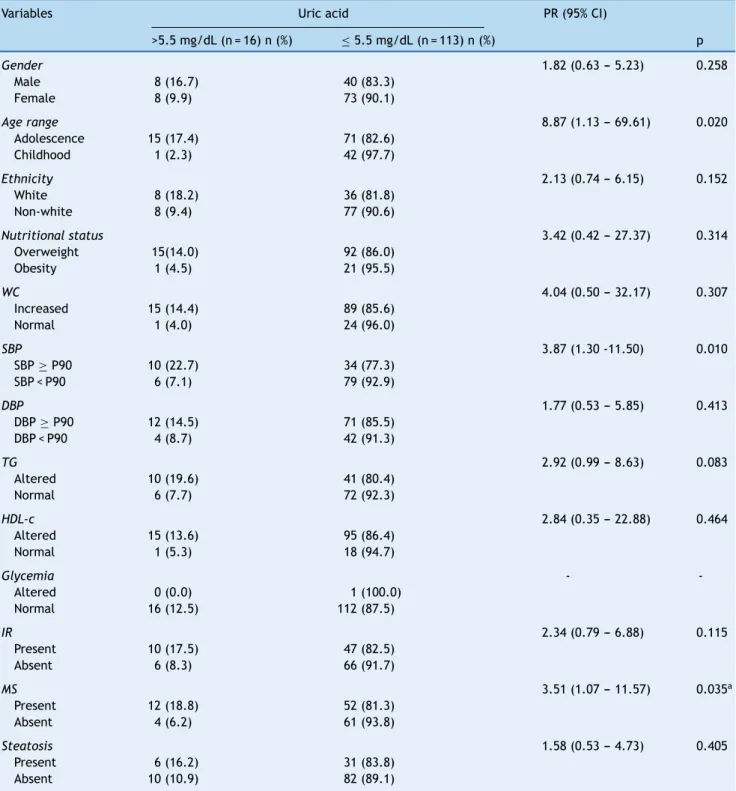
Table 1 Social, anthropometric, clinical and laboratory variables according to serum levels of uric acid in 129 overweight or obese children and adolescents. Centro de Obesidade Infantil, ISEA, Campina Grande-PB, 2009-2010.
Variables Uric acid PR (95% CI)
>5.5 mg/dL (n = 16) n (%) ≤5.5 mg/dL (n = 113) n (%) p
Gender 1.82 (0.63 --- 5.23) 0.258
Male 8 (16.7) 40 (83.3)
Female 8 (9.9) 73 (90.1)
Age range 8.87 (1.13 --- 69.61) 0.020
Adolescence 15 (17.4) 71 (82.6) Childhood 1 (2.3) 42 (97.7)
Ethnicity 2.13 (0.74 --- 6.15) 0.152
White 8 (18.2) 36 (81.8)
Non-white 8 (9.4) 77 (90.6)
Nutritional status 3.42 (0.42 --- 27.37) 0.314
Overweight 15(14.0) 92 (86.0) Obesity 1 (4.5) 21 (95.5)
WC 4.04 (0.50 --- 32.17) 0.307
Increased 15 (14.4) 89 (85.6)
Normal 1 (4.0) 24 (96.0)
SBP 3.87 (1.30 -11.50) 0.010
SBP≥P90 10 (22.7) 34 (77.3) SBP < P90 6 (7.1) 79 (92.9)
DBP 1.77 (0.53 --- 5.85) 0.413
DBP≥P90 12 (14.5) 71 (85.5) DBP < P90 4 (8.7) 42 (91.3)
TG 2.92 (0.99 --- 8.63) 0.083
Altered 10 (19.6) 41 (80.4)
Normal 6 (7.7) 72 (92.3)
HDL-c 2.84 (0.35 --- 22.88) 0.464
Altered 15 (13.6) 95 (86.4)
Normal 1 (5.3) 18 (94.7)
Glycemia -
-Altered 0 (0.0) 1 (100.0) Normal 16 (12.5) 112 (87.5)
IR 2.34 (0.79 --- 6.88) 0.115
Present 10 (17.5) 47 (82.5)
Absent 6 (8.3) 66 (91.7)
MS 3.51 (1.07 --- 11.57) 0.035a
Present 12 (18.8) 52 (81.3)
Absent 4 (6.2) 61 (93.8)
Steatosis 1.58 (0.53 --- 4.73) 0.405
Present 6 (16.2) 31 (83.8) Absent 10 (10.9) 82 (89.1)
CI, confidence interval; DBP, diastolic blood pressure; HDL-C, high-density lipoprotein; IR, insulin resistance; MS, metabolic syndrome; PR, prevalence ratio; SBP, systolic blood pressure; TG, triglycerides; WC, waist circumference.
Table 2 Mean values of BMI, blood glucose, WC, SBP, DBP and HOMA-IR quartiles according to uric acid of 129 overweight or obese children and adolescents. Centro de Obesidade Infantil, ISEA, Campina Grande-PB, 2009-2010.
Uric acid
Variables P1 < 3.0 n = 30 P25 3.0-3.9 n = 32 P50 4.0-4.8 n = 32 P75≥4.9 n = 35 p Mean (SD) Mean (SD) Mean (SD) Mean (SD)
BMI 25.02 (2.74) 26.66 (4.25) 28.17 (4.55) 30.33 (4.32) 0.000a WC 80.15 (8.88) 81.77 (12.25) 89.54 (12.38) 93.12 (12.52) 0.000b SBP 103.20 (10.51) 104.84 (10.19) 110.53 (11.34) 113.86 (12.66) 0.001c DBP 69.20 (8.70) 68.91 (7.15) 75.31 (9.66) 75.69 (11.86) 0.003d TG 106.00 (53.87) 117.59 (54.94) 134.63 (68.09) 165.40 (77.28) 0.002e HDL-c 38.50 (11.59) 39.13 (7.54) 38.53 (7.56) 33.23 (6.49) 0.014f HOMA- IR 1.81 (1.09) 2.18 (1.62) 2.52 (1.48) 3.39 (1.76) 0.000g Glycemia 78.90 (7.75) 80.56 (7.67) 79.75 (6.75) 82.69 (6.54) 0.172
BMI, body mass index; DBP, diastolic blood pressure; HDL-C, high-density lipoprotein; HOMA-IR, homeostatic model assessment index; SBP, systolic blood pressure; SD, standard deviation; TG, triglycerides; WC, waist circumference.
aDifferences between quartile 1 with 3 and 4, and between 2 with 4. b Between quartile 1 with 3 and 4, and between 2 with 3 and 4. c Difference between quartile 1 and 4, and 2 and 4.
d Between quartile 1 and 4, and 2 and 4.
e Difference between quartile 1 and 4 and 2 and 4. f Between quartile 2 with 4.
gDifference between quartile 1 and 4.
Table 1 shows that higher values of uric acid were significantly associated with adolescence, altered SBP, hypertriglyceridemia, and MS. No significance was observed when correlating levels of uric acid with the presence of steatosis. The chance of having hyperuricemia was higher in the following groups: adolescence (PR = 8.87), high SBP (PR = 3.87), and those with MS (PR = 3.51).
The quartiles of uric acid observed were: < 3.0; 3.0-3.9; 4.0-4.8; and≥ 4.9. Table 2 shows that the group consist-ing of individuals from the 4thquartile (percentile > 75thfor uric acid values) showed significantly higher values of BMI, WC, SBP, DBP, TG, and HOMA-IR, and lower mean of HDL-C (Table 2).
There was no association between levels of uric acid and the combined groups according to the presence/absence of MS and nonalcoholic hepatic steatosis (Table 3).
Through multiple logistic regression analysis, it was observed that in the final model, only age and the presence of MS remained associated with uric acid lev-els. It was observed that, among adolescents, the odds of having increased uric acid levels was approximately nine times higher than among children; when compared with patients with MS, this probability was 3.7 times greater. As demonstrated by the results of the Hos-mer and Lemeshow test, the model showed a good fit (Table 4).
Table 3 Uric acid values according to the presence and/or absence of metabolic syndrome and liver steatosis in 129 overweight or obese children and adolescents. Centro de Obesidade Infantil, ISEA, Campina Grande-PB, 2009 - 2010.
Uric acid
Variables Mean (mg/dL)±SD 95%CI
Presence of MS and steatosis 4.5±1.64 3.64-5.40 Presence of MS and absence of steatosis 4.4±1.79 3.87-4.91 Absence of MS and presence of steatosis 4.7±4.62 2.58-6.80 Absence of MS and steatosis 3.6±1.05 3.29-3.92
CI, confidence interval; MS, metabolic syndrome; SD, standard deviation. p = 0.220.
Table 4 Crude and adjusted odds ratio (95% confidence interval) of alterations in uric acid in 129 overweight or obese children and adolescents. Centro de Obesidade Infantil, ISEA, Campina Grande-PB, 2009 --- 2010.
Parameter Variables Crude OR
Adjusted OR
Adjusted p-value (95%CI)
p-valueHosmer and Lemeshow
Discussion
Serum uric acid is the primary end product of purine metabolism in humans, and its levels are strictly controlled by the balance between production and excretion.16In this study, high levels of uric acid were associated with adoles-cence and MS. It is noteworthy that there was no association between increased levels of uric acid with the diagnosis of overweight and obesity and with the presence of NAFLD.
In this study, the prevalence of MS was higher than that found by other authors who evaluated obese children and adolescents,17,18and confirms previous results from a sample of hypertensive adults from Cuiabá, state of Mato Grosso, in which the prevalence of high levels of uric acid was signifi-cantly higher in patients with MS.19
The evidence that explains the association of uric acid with MS is based on two mechanisms. The first mechanism is related to the fact that glucose uptake in skeletal mus-cle partially depends on the increase in insulin-mediated blood flow, stimulating the release of nitric oxide from endothelial cells. Components of MS developed in mice with endothelial nitric oxide synthesis. The second mechanism is related to the fact that uric acid induces oxidative and inflammatory alterations in adipocytes, since xanthine oxi-doreductase (the enzyme that generates uric acid from xanthine) is expressed in adipocytes and is critical to the adipogenesis process.20
Pacifico et al.,21 in a study performed in Italy to verify the association of hyperuricemia with MS and atherosclerosis in obese children and adolescents, concluded that patients with high uric acid levels had a higher incidence of carotid atherosclerosis as demonstrated by the thickening of the carotid intima-media, assessed by Doppler ultrasonography of this region.
It was observed that individuals with high SBP were approximately four times more likely to have hyperuricemia; a biological explanation for this fact is supported by a study performed in an animal model with rats, which demon-strated that after induction of hyperuricemia there was development of hypertension, probably due to reduction in nitric oxide in renal macula densa and by direct stimulation of the renin-angiotensin system, as both mechanisms cause vasoconstriction and therefore increase blood pressure.22
Regarding the variables of lipid metabolism an asso-ciation between uric acid levels and the means of TG and HDL (inversely associated with the latter) has been demonstrated,1,23 confirming the findings of the present study.
The finding of hyperglycemia in this age group is unusual, as the more frequent manifestation of glucose metabolism is IR, which is a compensatory mechanism, while glucose tolerance remains normal.24
Although no association with hepatic steatosis was observed in this sample, recent studies have described a significant association between high levels of uric acid and NAFLD, representing an independent risk factor for liver disease.25---27
The most plausible explanation for this association, which has been inferred from the current understanding of NAFLD progression, would be the ‘‘two-hit’’ theory. According to this theory, the accumulation of fat in the liver is the
first ‘‘hit’’, which makes the hepatocytes more vulnera-ble to further damage due to certain triggers, such as IR, excess inflammation, alcohol consumption, and obesity. In this process, IR plays a central role in the vicious circle, which promotes lipolysis of the peripheral adipose tissue and increases the influx of free fatty acids into the liver. This IR leads to hyperinsulinemia, which increases the synthesis of uric acid and decreases its renal excretion.24
Oxidative stress appears to be involved in the ‘‘hit’’ process, which promotes lipid peroxidation and the inflam-matory response. Uric acid reflects the rate of cell renewal, which in itself can be a part of the inflammatory process, making it a pro-inflammatory factor. Uric acid increases interleukin (IL)-6 and tumor necrosis factor alpha (TNF-␣) levels. Thus, high levels of uric acid in blood are due to oxidative stress that occurs in response to metabolic disorders.28
A study by Roberts et al.29 demonstrated that uric acid clearance in the obese group was lower than in the control group, suggesting that hyperuricemia in the obese popu-lation would be mainly attributed to a decrease in the clearance of uric acid, rather than to an overproduction of urates.
The method used to diagnose NAFLD was considered a limitation of the present study, as the gold standard is biopsy, an invasive and expensive technique. Thus, the ultra-sound technique was chosen, which has been widely used in public health studies due to its easy accessibility, safety, and excellent sensitivity, especially when evaluating the pedi-atric population.
In conclusion, high levels of uric acid were associated with MS and adolescence, which was not observed with NAFLD. The possibility of cardiovascular complications does not depend on a particular factor, rather on the concomitant presence of individual characteristics capable of increas-ing this possibility --- symptomatic or not --- in target organs and associated clinical complications. Thus, the inclusion of measurement of uric acid levels in the assessment pro-tocols for obese or overweight children and adolescents is suggested, in order to verify possible complications of early cardiovascular alterations.
Funding
This study received financial support from the Fundac¸ão de Apoio à Pesquisa do Estado da Paraíba (FAPESQ) through Edict 01/2008 (FAPESQ/PB-MCT/CNPq Termo de Concessão No. 198/08) and from Universidade Estadual da Paraíba, through Programa de Incentivo à Pós-Graduac¸ão e Pesquisa (PROPESQ) Edict 01/2008 (PRPGP/UEPB Termo de Concessão No. 98/2008).
Conflicts of interest
The authors declare no conflicts of interest.
References
risco cardiovascular em uma populac¸ão não hospitalar. Arq Bras Cardiol. 2011;96:212---8.
2. Serpa Neto A, Rossi FM, Valle LG, Teixeira GK, Rossi M. Relation of uric acid with components of metabolic syndrome before and after Roux-en-Y gastric bypass in morbidly obese subjects. Arq Bras Endocrinol Metab. 2011;55:38---45.
3. Grundy SM, Brewer B, Cleeman JI, Smith Jr SC, Lenfant C. Def-inition of metabolic syndrome. Circulation. 2004;109:433---8. 4. Hwang IC, Suh SY, Suh AR, Ahn HY. The relationship between
normal serum uric acid and nonalcoholic fatty liver disease. J Korean Med Sci. 2011;26:386---91.
5. Ferreira VS, Pernambuco RB, Lopes EP, Morais CN, Rodrigues MC, Arruda MJ, et al. Frequency and risk factors associated with non-alcoholic fatty liver disease in patients with type 2 diabetes mellitus. Arq Bras Endocrinol Metab. 2010;54:362---8.
6. Chen LY, Zhu WH, Chen ZW, Dai HL, Ren JJ, Chen JA, et al. Relationship between hyperuricemia and metabolic syndrome. J Zhejiang Univ Sci B. 2007;8:593---8.
7. Brasil, Ministério da Saúde. Sistema de Vigilância Ali-mentar e Nutricional (SISVAN). Classificac¸ão do estado nutricional. Jun 2009 [cited 11 Dec 2012]. Available from: 189.28.128.100/nutric¸ão/docs/geral/sisvan norma tecnica criancas.pdf.
8. International Diabetes Federation (IDF). Worldwide definition of metabolic syndrome [cited 24 Oct 2010]. Available from: www.idf.org/home/index.cfm?node=1429
9. Sociedade Brasileira de Cardiologia (SBC). V diretrizes brasileiras de hipertensão arterial. 2006.
10. Cerri GG, Oliveira IRSde. Ultra-sonografia abdominal. 2nd ed. Revinter: Rio de Janeiro; 2008.
11. Saverymuttu SH, Joseph AE, Maxwell JD. Ultrasound scanning in the detection of hepatic fibrosis and steatosis. Br Med J (Clin Res Ed). 1986;292:13---5.
12. Feig DI, Jonhson RJ. Hyperuricemia in childhood primary hyper-tension. Hyperhyper-tension. 2003;42:247---52.
13. Madeira IR, Carvalho CN, Gazzola FM, de Matos HJ, Borges MA, Bordallo MA. Ponto de corte do índice Homeostatic Model Assessment for Insulin Resistance (HOMA-IR) avaliado pela curva receiver operating characteristic (ROC) na detecc¸ão de sín-drome metabólica em crianc¸as pré-púberes com excesso de peso. Arq Bras Endocrinol e Metab. 2008;52:1466---73. 14. Third Report of the National Cholesterol Education Program
(NCEP). Expert panel on detection, evaluation, and treatment of high blood cholesterol in adults (adult treatment panel III) final report. Circulation. 2002;106:3143---421.
15. Giuliano IC, Caramelli B, Pellanda L, Dunca B, Mattos S, Fonseca FH, Sociedade Brasileira de Cardiologia. I Diretriz de Prevenc¸ão
Da Aterosclerose Na Infância E Na Adolescência. Arq Bras Car-diol. 2005;85:1---36.
16. Burns CM, Wartmann RL. Disorders of purine and pyrimi-dine metabolism. In: Longo DL, Fauci AS, Kasper DL, Hauser SL, Jameson JL, Loscalzo J, editors. Harrison’s principles of internal medicine. 18th ed. New York: McGraw Hill; 2012. p. 3181---7.
17. Duarte MA, Silva GA. Hepatic steatosis in obese children and adolescents. J Pediatr (Rio J). 2011;87:150---6.
18. Ferreira AP, Oliveira CER, Franc¸a NM. Metabolic syndrome and risk factors for cardiovascular disease in obese children: the relationship with insulin resistance (HOMA-IR). J Pediatr (Rio J). 2007;83:21---6.
19. Franco GP, Scala LC, Alves CJ, Franc¸a GV, Cassanelli T, Jardim PC. Síndrome metabólica em hipertensos de Cuiabá - MT: prevalência e fatores associados. Arq Bras Cardiol. 2009;92:472---8.
20. Feig DL, Kang DH, Johnson RJ. Uric acid and cardiovascular risk. N Engl J Med. 2008;359:1811---21.
21. Pacifico L, Cantisan V, Anania C, Bonaiuto E, Martino F, Pas-cone R, et al. Serum uric acid and its association with metabolic syndrome and carotid atherosclerosis in obese children. Eur J Endocrinol. 2009;160:45---52.
22. Choi HK, Ford ES. Prevalence of metabolic syndrome in individuals with hyperuricemia. Am J Med. 2007;120: 442---7.
23. Zoccali C, Maio R, Mallamaci F, Sesti G, Perticone F. Uric acid and endothelial dysfunction in essential hypertension. J Am Soc Nephrol. 2006;17:1466---71.
24. Quinones Galvan A, Natali A, Baldi S, Frascerra S, Sanna G, Cio-ciaro D, et al. Effect of insulin on uric acid excretion in humans. Am J Physiol. 1995;268:E1---5.
25. Lee K. Relationship between uric acid and hepatic steatosis among Koreans. Diabetes Metab. 2009;35:447---51.
26. Lee YJ, Lee HR, Lee JH, Shin YH, Shim JY. Association between serum uric acid and non-alcoholic fatty liver disease in Korean adults. Clin Chem Lab Méd. 2010;48:175---80.
27. Li Y, Xu C, Yu C, Xu L, Miao M. Association of serum uric acid level with non-alcoholic fatty liver disease: a cross-sectional study. J Hepatol. 2009;50:1029---34.
28. Amin KA, Kamel HH, Abd Eltawab MA. The relation of high fat diet, metabolic disturbances and brain oxidative dysfunc-tion: modulation by hydroxy citric acid. Lipids Health Dis. 2011;10:74.