R
UI
M
IGUEL
L
OURENÇO
R
OCHA DE
A
LMEIDA
NMR
S
TUDIES OF
T
RANSIENT
P
ROTEIN
C
OMPLEXES
iii Nº DE ARQUIVO:
v
RUI MIGUEL LOURENÇO ROCHA DE ALMEIDA
NMR
S
TUDIES OF
T
RANSIENT
P
ROTEIN
C
OMPLEXES
Dissertação apresentada para obtenção do Grau de Doutor em Bioquímica, especialidade Bioquímica Física, pela Universidade Nova de Lisboa, Faculdade de Ciências e Tecnologia
LISBOA
vii Uma tese de doutoramento, embora corolário de quatro anos de esforço e dedicação individual, decerto não poderia ser levada a cabo com sucesso sem a importante ajuda de muitos intervenientes em diversos campos. Aqui deixarei o meu agradecimento a todos os que de alguma forma ajudaram ao sucesso desta desafiante mas estimulante tarefa.
Ao Prof. Doutor José J. G. Moura, meu orientador, agradeço-lhe ter-me acolhido no seu laboratório, e por fazer o seu melhor para estar sempre disposto a ajudar e apoiar, apesar dos seus muitos afazeres. O seu grau de dedicação à ciência e gosto pessoal pela área da química bioinorgânica servem como uma fonte de inspiração inesgotável.
À Doutora Sofia Pauleta agradeço o sua incansável vontade e rigor científico que me permitiram não só aprender bastante como também melhorar ao máximo o trabalho apresentado. Sem as suas valiosas sugestões, decerto este trabalho não teria sido levado a bom porto.
À Prof. Doutora Isabel Moura agradeço ter-me levado debaixo da sua asa e ensinado a purificar proteínas logo em tenra idade. Tive desde logo oportunidade de observar o seu estilo pessoal e inconfundível de fazer ciência, rigoroso, sério e pragmático, que serviu de grande fonte de inspiração.
À Prof. Paola Turano e ao Prof. Ivano Bertini (CERM, Universitá degli Studi di Firenze, Italia) agradeço a oportunidade de três meses de trabalho frutuosos em Florença, Itália, onde pude aperfeiçoar os meus conhecimentos de NMR bi-dimensional. Queria também aproveitar para agradecer aos Drs. Marco Allegrozzi e Leonardo Gonnelli todo o apoio técnico prestado, bem como as estimulantes discussões sobre a importância do Rui Costa no panorama do futebol mundial e da cidade de Florença em particular.
Ao Prof. Edgar Groenen, ao Dr. Peter Gast, à Jennifer Mathies e a todos os elementos do grupo MoNOs da Universidade de Leiden (Holanda), agradeço a magnífica oportunidade de ter passado uma semana a aprender elementos básicos de EPR de alta frequência.
A todos os membros dos grupos BioIn e BioProt, passados e presentes, entre estagiários e pós-docs e investigadores, agradeço-vos toda a ajuda prestada, quer profissional quer em termos pessoais. Sem a vossa ajuda este trabalho dificilmente teria dado tão bons frutos. Às vezes bastam pequenas coisas como facilitar a troca de um horário de utilização ou dar um olhinho por uma experiência que decorre para nos fazer sentir mais seguros e descansados. Por isso, Patrícia, Marta, Gabi, Pablo, Cristiano, Luísa, Célia, Alexandra, Florina, Jacopo, Simone, Ana Teresa, Raquel, Bruno, Carlos e Tiaguinho, obrigado por tudo – esta é para vocês. Destaco ainda o Rui Duarte, que me acolheu logo ao início e partilhou comigo conselhos importantes. Infelizmente, já não nos poderá acompanhar nesta parte final do trajecto…
Outras pessoas merecem também especial menção:
viii
mundo™ no laboratório. Obrigado por todos os momentos de boa-disposição e carinho.
- Ao Américo agradeço toda a ajuda prestada na parte de Biologia Molecular e pela animação constante que a sua presença confere ao 6º piso.
- À Cristina Cordas agradecerei sempre os bons conselhos prestados, com aquela sapiência que só a experiência adquirida ao longo do tempo pode trazer.
- Ao Pedro e à Alice só posso agradecer toda a ajuda prestada, bem como as estimulantes discussões que versaram desde pormenores científicos relevantes até à eterna guerra entre PCs e Macintosh. - Ao Ludi agradeço todo o tempo e ensinamentos partilhados comigo à volta do BiGGER.
Agradeço também profusamente ao Prof. Eurico Cabrita, ao Aldino Viegas e ao Daniel Jana todo o apoio técnico e sabedoria transmitidos sobre os novos AvanceIII 400 e 600 MHz, em especial quando surgiam estranhas mensagens de erro no ecrã de aquisição (algo muito recorrente para quem está habituado a trabalhar com software da Bruker). Agradeço-lhes também a amizade e solicitude que sempre demonstraram, e o sotaque algarvio que sempre me ajudou a sentir em casa. Não posso esquecer também os valiosos ensinamentos da Dra. Rosário Caras Altas, que me transmitiu as primeiras noções de NMR experimental no velhinho mas robusto AMX-400.
Não podia também deixar de agradecer aos restantes amigos e colegas da FCT que, de uma maneira ou de outra, ajudaram a que esta minha experiência se tornasse mais agradável ou completa. Leonor, Filipe Freire, Filipe Duarte, Inês & Inês, Vítor, e muito em especial, Engª Lúcia, Pedras, Carla e Marta, esta é para vocês.
Aos meus amigos, em especial o Pedro, o João (“Dr. Froufe”), o Daniel e o Barata, velhos companheiros de há longos anos, de outras batalhas e andanças, agradeço toda a amizade e a necessária perspectiva diferente das coisas.
Ao meu irmão Pedro e à minha mãe agradeço terem estado sempre presentes quando precisei, em momentos de maior dúvida. Adoro-vos. Mesmo apesar da insistente sugestão por parte do meu irmão que “Engenharia no Técnico é que é!».
Finalmente, queria também agradecer à Sílvia, a quem dedico esta tese. Sem todo o seu carinho e amor, bem como compreensão e infindável paciência, decerto não teria conseguido levar esta tarefa a tão bom porto.
ix O trabalho descrito nesta tese versa sobre a utilização de sondas paramagnéticas no estudo de interacções protein-proteína (complexos transientes), e no desenvolvimento de metodologias para o mapeamento das superficies de interacção com base no efeito paramagnético causado pela presence de centros metálicos com electrões desemparelhados. Para esse efeito, foram utilizados em conjunto algoritmos computacionais e NMR 2D em sistemas marcados com 15N.
O citocromo c3 de Desulfovibrio gigas, uma proteína tetra-hémica, foi escolhida como proteína-alvo
para estudar o efeito da sonda paramagnética, rubredoxina-Fe3+, que causa alargamentos de linha
específicos nas ressonâncias M2 e M18 do hemo IV. Os resíduos de rubredoxina envolvidos na interacção foram identificados por titulação NMR 2D. O citocromo c3 possui uma superfície de lisinas
carregadas positivamente em torno do hemo IV que atrai electrostaticamente a rubredoxina, que é acídica. Os complexos mais prováveis previstos por docking com restrições corroboram os resultados experimentais. Pequenas alterações conformacionais foram também detectadas no citocromo após ligação da rubredoxina. Esta interacção tem um Kd de 25 M.
O potencial uso de duas sondas de Gd derivadas de cicleno, DOTAM (carregada positivamente) e DOTP (carregada negativamente), como indutoras de PRE (Aumentos de Relaxação Paramagnética) na determinação de interacções proteína-proteína foi estudada no modelo acima descrito. A complementaridade electrostática confere uma ligação específica da sonda Gd-DOTP junto ao hemo IV do citocromo c3, causando fortes PREs nas ressonâncias dos metilos deste hemo. A interacção,
baseada na diferença dos desvios químicos observados, tem um Kd = 20 M. A sonda Gd-DOTAM
interage especificamente com uma superfície bem-definida junto ao centro metálico da rubredoxina, causando fortes PREs, que são parcialmente revertidos com adição de excesso de citocromo c3.
Ambas as sondas revelaram-se causadoras de fortes PREs mesmo a longas distâncias (>10 Å), servindo como sondas eficientes e reversíveis para a identificação de superfícies de interacção. A experiência previamente adquirida foi usada na determinação do complexo formado entre o redutase do superóxido (SOR) de D. gigas e os seus parceiros de transferência electrónica, rubredoxina e desulforedoxina. Este sistema é importante na destoxificação de espécies reactivas de oxigénio, formadas quando organismos anaeróbios são expostos a oxigénio. A interacção foi caracterizada por NMR 2D e cinética de estado estacionário. A superfície da rubredoxina envolvida no complexo de transferência electrónica com o SOR é constituída pelos resíduos adjacentes ao seu centro metálico (C9, V10, C42, G43, A44). O Kd estimado para esta interacção, a uma força iónica de
50 mM, é de 3.0 ± 0.4 M. Um estudo sobre a dependência da velocidade de reacção com a força iónica revelou um kapp máximo de 37 + 12 min-1 a I = 150 mM. Embora não se tenha conseguido
determinar um complexo definido entre o SOR e a desulforedoxina devido ao curto tempo de meia-vida do complexo na escala de tempo da espectroscopia de NMR, foi possível provar a ocorrência de transferência electrónica com um kapp máximo de 31 + 7 min-1 a I = 50 mM. Ensaios de competição
xi The work described in this thesis aims to study the utilization of paramagnetic probes in the study of protein-protein interactions (transient complexes) and the development of methodologies, using the paramagnetic effect due to the presence of a metal center with unpaired electrons, for the mapping of interacting surfaces. 2D-NMR in 15N labelled systems in conjunction with computational algorithms was used to model the structure of those complexes.
D. gigas cytochrome c3, a tetra-hemic cytochrome, was chosen as target to study the effect of the
paramagnetic probe, Fe3+-rubredoxin), which specifically broaden the resonances of the heme IV
methyl resonances M21 and M181. The Rd residues at the complex interface were identified by
heteronuclear 2D NMR titration. Cytochrome c3 heme IV is surrounded by a patch of positive charges
(lysine residues) that drives an electrostatic interaction with the negatively charged Rd. Indeed, predicted complexes obtained by restrained molecular docking shows a cluster of possible solutions near heme IV and small conformation rearrangements were detected upon binding of the two proteins, which as a dissociation constant of 25 M.
Two cyclen-derived Gd probes, DOTAM (positively charged) and DOTP (negatively charged) were assessed as Paramagnetic Relaxation Enhancement (PRE)-inducing probes for protein-protein interactions, and tested in the previous model system. As predicted by electrostatic complementarity, in a NMR titration Gd-DOTP binds to cytochrome c3 near heme IV, causing
pronounced PREs in its heme methyl resonances. A Kd of 20 M was determined based on chemical
shift perturbation. Gd-DOTAM caused the same PREs on a well-defined patch near the metal center of rubredoxin. This effect was partially reversed when excess cytochrome c3 was added to this
system, mapping the interacting surface. Thus, both probes were successful in causing PREs at large distances from the binding site, serving as good, reversible probes for the identification of interacting surfaces.
The previous acquired experience was used to probe the complex formed between D. gigas superoxide reductase and two redox partners (rubredoxin and desulforedoxin). This molecular system is important in detoxification of reactive oxygen species, formed when the anaerobic bacteria is transiently exposed to oxygen. The interaction between SOR and its electron donors was probed by 2D NMR titrations and steady-state kinetics. The Rd surface involved in the electron transfer complex with SOR comprises the solvent exposed hydrophobic residues in the vicinity of its metal center (C9, V10, C42, G43, A44). The Kd for this interaction was estimated to be 3.0 ± 0.4 M, at 50 mM ionic
strength. An ionic strength dependence study on the activity was performed, showing maximum activity at 150 mM, with a kapp of 37 + 12 min-1. Although a complex between Dx and SOR could not
be detected in a 2D NMR titration, due to the very short half-life of the complex in the NMR time scale, it was shown to be able to transfer electrons to SOR, with a maximum kapp = 31 + 7 min-1 at
xiii APSY – Automated Projection Spectroscopy
D. – Desulfovibrio
DOTAM –
1,4,7,10-tetraazacyclododecane-1,4,7,10-tetraacetamide
DOTP -
1,4,7,10-tetraazacyclododecane-1,4,7,10-tetrakis(methylenephosphonate)
Dx – DesulforedoxinET – Electron Transfer FID – Free Induction Decay
HPLC – High-Performance Liquid Chromatography HSQC – Heteronuclear Single Quantum Coherence IPTG - Isopropyl--D-thio-galactopyranoside LIS – Lanthanide Induced Shift
M. – Methanocaldococcus MAS – Magic Angle Spinning Ngr - Nygerythrin
nOe – Nuclear Overhauser Effect
NROR - NADPH:rubredoxin oxidoreductase P. – Pyrococcus
PCS – Pseudo-Contact Shift PDB – Protein Data Bank
PRE – Paramagnetic Relaxation Enhancement
xiv
RDC – Residual Dipolar Coupling RMSD – Root Mean Square Deviation ROO - Rubredoxin:oxygen oxidoreductase ROS – Reactive oxygen species
SOD – Superoxide dismutase SOR – Superoxide reductase ssNMR – Solid State NMR
T. – Thermotoga Tr. – Treponema
xv
I. General Introduction
1
Chapter Index
3
I. General Introduction
5
I.1 Protein Complexes
5
I.2 Characterization of Transient Protein Complexes: Electron-Transfer Proteins 7
I.3 NMR applied to biomarcomolecules – state of the art and latest
Developments
9
I.4 In silico docking
11
I.5 Dealing with O2
12
I.6. Reactive Oxygen Species
12
I.7 ROS targeting of biological macromolecules
13
I.8 Coping with ROS – Fe and Fe centers
14
I.9 Proteins used in this work
15
I.9.1 Rubredoxin
15
I.9.2 Desulforedoxin
17
I.9.3 Superoxide Reductase
18
I.9.4 Cytochrome
c
324
I.10 Objectives
28
Chapter II - Rubredoxin as a paramagnetic-relaxation inducing probe
29
Chapter Index
31
II.1 Abstract
33
II.2 Introduction
35
xvi
II.3.2 Purification of
D. gigas
rubredoxin
39
II.3.2.1 Strains, vectors, and growth conditions
39
II.3.2.2 Purification of rubredoxin
40
II.3.3 NMR titration
40
II.3.3.1 Sample preparation
40
II.3.3.2
1H titration
41
II.3.3.3 2D titration
41
II.3.3.4 Data analysis of binding
41
II.3.4 Molecular docking simulations
42
II.4 Results and Discussion
44
II.4.1 Complex formation studied by
1H NMR: the paramagnetic effect 44
II.4.2 Determination of the binding constant between cytochrome
c
3and rubredoxin
48
II.4.3 2D NMR titration of Zn-rubredoxin with cytochrome
c
351
II.4.4 Model structure of cytochrome
c
3–
rubredoxin complex
52
II.5 Conclusions
57
Chapter III - Gd(III) chelates as protein interaction probes
59
Chapter Index
61
III.1 Abstract
63
III.2 Introduction
65
III.3 Materials and Methods
72
xvii
III.3.3
1H NMR experiments
72
III.3.4 2D NMR experiments
72
III.4 Results and Discussion
73
III.4.1 Cytochrome
c
3, a negatively charged protein with 4 heme groups 73
III.4.2
15N-Zn-rubredoxin, an acidic target protein
78
III.5 Conclusions
87
Chapter IV
–
Superoxide Reductase: different interaction modes with its two
Physiological electron donors
89
Chapter Index
91
IV.1 Abstract
93
IV.2 Introduction
95
IV.3 Materials and Methods
98
IV.3.1 Protein Purification
98
IV.3.1.1 Purification of D. gigas rubredoxin and desulforedoxin
98
IV.3.1.2. Overexpression and purification of
D. gigas
superoxide 98
reductase
IV.3.2. NMR Titrations
99
IV.3.2.1. Sample preparation
99
IV.3.2.2. 2D NMR Titrations
99
IV.3.3. Data analysis of binding
100
IV.3.4. Electron transfer kinetics studies
100
IV.3.4.1. Rate dependence on ionic strength
100
xviii
IV.4 Results and Discussion
103
IV.4.1. Electron transfer complex between rubredoxin and SOR
103
IV.4.1.1. Docking simulations
104
IV.4.1.1.1 Homology modelling of
D. gigas
SOR
106
IV. 4.1.1.2 Molecular docking simulations using BiGGER 108
IV.4.2 Desulforedoxin as an electron donor to SOR
115
IV.4.3. Competition assays
119
IV.5 Conclusions
126
Chapter V
–
Final Remarks
127
xix Figure I.1 – A) Schematic representation of a Cross-Saturation Transfer experiment. Resonances of a non-deuterated partner (Protein A) are selectively irradiated until saturation. Spin-diffusion phenomena will transfer said saturation throughout the polypeptide chain. Upon binding of a perdeuterated partner (Protein B), and depending on the intensity and time of irradiation, the saturation will be transferred either to the interacting residues, or to the whole protein, enabling the identification of the binding region. B) A partner with a paramagnetic center or probe (A) will cause pseudo-contact shifts (PCS) and PRE to a partner (B) that binds at or near the paramagnetic site. Since these effects are distance dependent, this allows the mapping of the interacting surface.
9
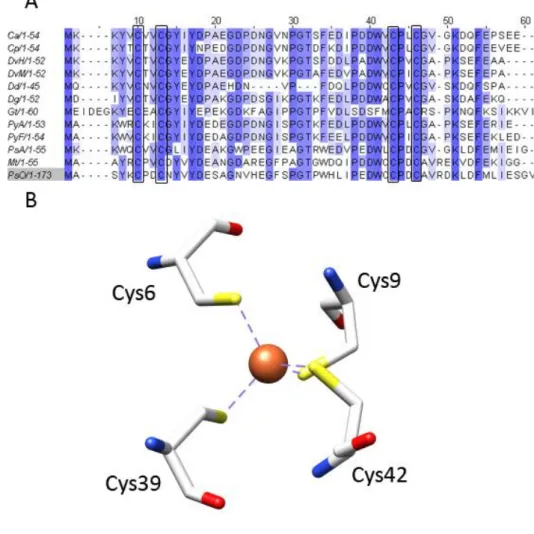
Fig. I.2 – A) Primary sequence alignment of the 12 available rubredoxin structures in the Protein Data Bank (www.rscb.org/pdb) in July 2010. Sequence alignment was performed using ClustalW. Conserved cysteine residues are highlighted by binding boxes. Ca = Chlostridium acetobutylicum. Cp = Chlostridium pasteurianum. DvH = Desulfoviibrio vulgaris strain Hildenborough. DvM = Desulfovibrio vulgaris strain Miyazaki F. Dd = Desulfovibrio desulfuricans ATCC 27774. Dg = Desulfovibrio gigas. Gt = Guillardia theta. PyA = Pyrococcus abyssi. PyF = Pyrococcus furiosus. PsA = Pseudomononas aeruginosa. Mt = Mycobacterium tuberculosum. PsO = Pseudomonas oleovorans rubredoxin type-2. B) FeS4 center from D. gigas rubredoxin, displaying its characteristic tetrahedral geometry. Imagecreated with UCSF Chimera [52].
16
Figure I.3 – A) D. desulfuricans ATCC 27774 Class I SOR monomer (from PDB file 1DFX). The Dx-like domain with ET center is depicted in dark red, while the catalytic domain is colored blue. B) Desulforedoxin monomer from D. gigas (from PDB file 1DXG). C) Pyrococcus furiosus Class II SOR monomer (from PDB file 1DQI). Notice the absence of the Dx-like domain. D) Treponema pallidum Class III SOR (from PDB file 1Y07). The N-terminal domain (colored gray), although similar in geometry to Class I SORs, does not possess the necessary cysteine residues in order to coordinate a
Fe ion.
20
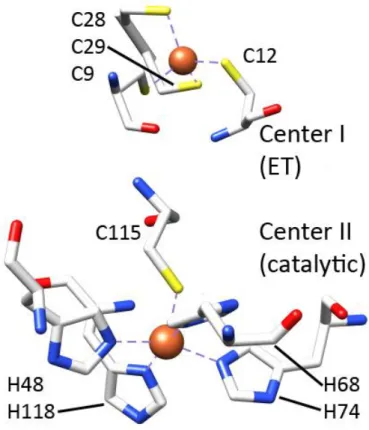
Figure I.4 – Schematic representation of the two centers of a class I SOR from D. desulfuricans ATCC 27774 (PDB: 1DFX). Above: desulforedoxin-like center (center I). Below: center II of SOR. Blue: Nitrogen atoms. Yellow: Sulphur atoms. Red: Oxygen atoms. White: Carbon atoms. Orange: Iron
atoms.
22
xx
step leads to the release of a water molecule. A nearby conserved glutamate residue (when available) will then coordinate Fe(III) in the remaining axial position. Reduction of the catalytic center by one of the redox partners of SOR brings the protein back to its ready state. G) Regeneration may also occur by direct reduction of the Fe ion, with the hydroxide ion being captured by the sidechain amine of the aforementioned lysine residue. Protonation of this hydroxide ion will bring the center
again to the ready state.
23
Figure I.6 – Schematic representation of a type c heme. Methyl groups, which will be analyzed in further detail in coming sections, are identified and numbered according to the IUPAC
recommendations [89].
26
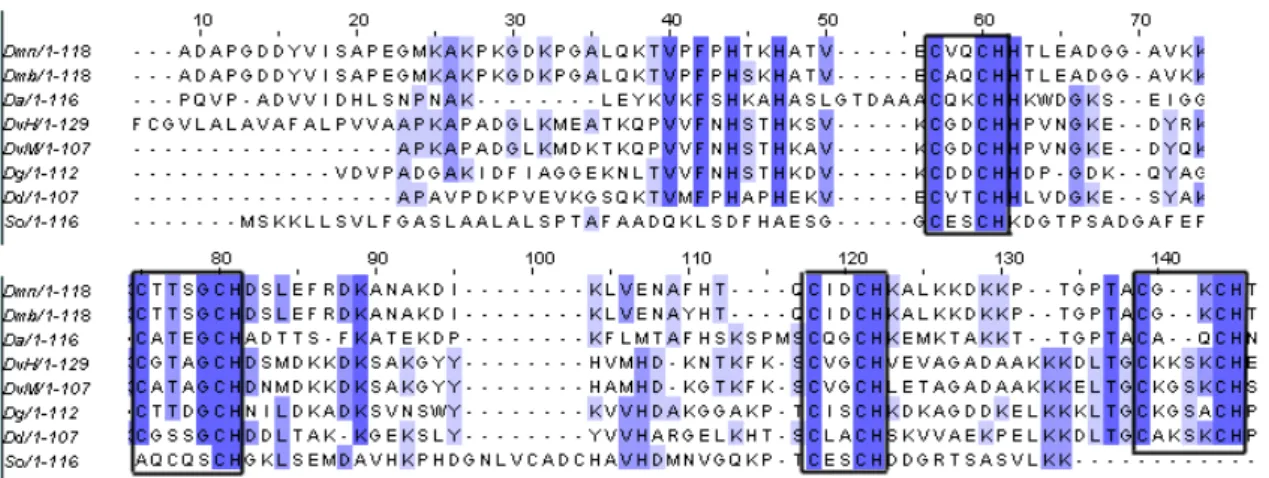
Figure I.7 – Primary sequence alignment of selected cytochrome c3 which structure is available in the
PDB. Dsm = Desulfomicrobium norvegicum. Dmb = Desulfomicrobium baculatus. Da = D. africanus. DvH = D. vulgaris Hildenborough. DvM = D. vulgaris Miyazaki F. Dg = D. gigas. Dd = D. desulfuricans ATCC 27774. So = Shewanella oneidensis. Black binding boxes identify the heme-binding conserved sequences CXnCH (n = 2 or 4). Alignment performed with Clustal W.
26
Figure I.8 –Cytochrome c3 from Desulfovibrio gigas (PDB: 1WAD). Notice the exposed methyl groups
of heme IV, while other heme groups usually have the propionate chains exposed.
27
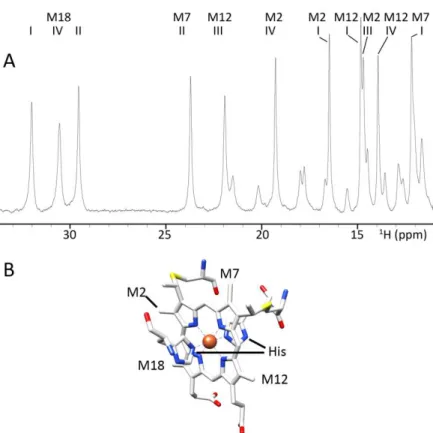
Figure II.1 – A) 1H NMR spectrum of D. gigas cytochrome c3 between 34 and 11 ppm. All resonancesbelong to heme methyl groups and propionate protons. The spectrum was obtained in 10mM Tris-HCl in 100% D2O, pH 8.0 (uncorrected for isotope effect) in a 400 MHz spectrometer. Heme methyls
are labeled according to the IUPAC nomenclature. B) Scheme of a type c heme, with heme groups
lined out.
36
Figure II.2 – Comparison between the 1H -15N HSQC spectra of Fe-rubredoxin (black resonances) and
Zn-substituted rubredoxin (Red resonances). The resonances broadened beyond detection, which belong to residues that coordinate or are near the metal center, are identified in the figure. The highlighted area (7.0 – 10.2 ppm in the proton frequency, 105-132 ppm in the 15N frequency)
contains 30 resonances of the expected total of 48 (52 residues, minus the first methionine and five proline residues, plus two from Q52’s sidechain) *16+. Spectra were acquired at 298K with the
xxi resonances labelled according to the IUPAC recommendations. The spectra was acquired at pH 8.0, 298 K and I = 1.3 mM, as described in Materials and Methods. The protein samples were (i) R=0, 750 M cytochrome c3, (ii) R=0.5, (iii), R=1.0, (iv) R=3.0. Spectrum v) is the difference spectra between
[rubredoxin]/[cytochrome c3] ratios of 3.0 and 0.
45
Figure II.4 – 1H NMR titration of oxidized D. gigas cytochrome c3 with Zn-rubredoxin. The same
conditions of Figure II.3 apply.
46
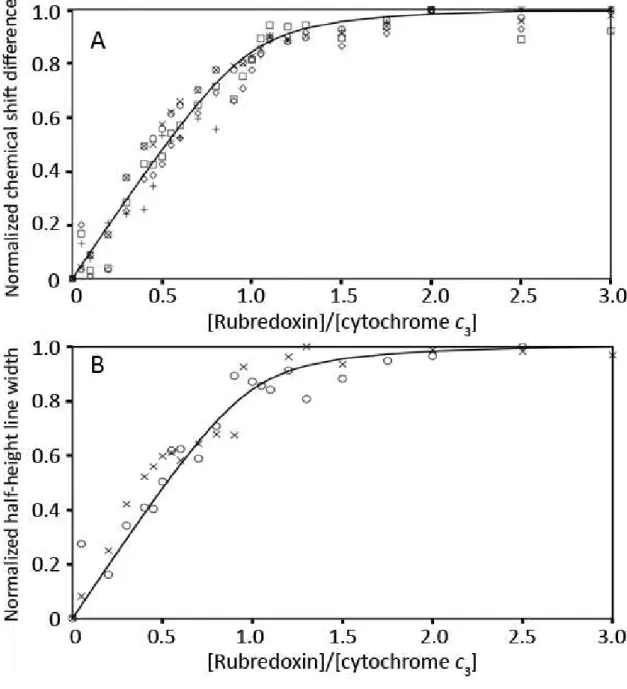
Figure II.5 – A) Normalized chemical shift variation of D. gigas cytochrome c3 heme methyl
resonances: heme I M21 (◊), heme II M71 (□), heme III M21 (O), heme III M121 (×) and heme IV M21 (+),
with increasing molar ratios of Zn- or Fe-rubredoxin. B) Normalized half-height line width variation of D. gigas cytochrome c3 heme IV methyl resonances M181 (O) and M21 (×) during the titration with D.
gigas Fe-rubredoxin. The fitting curves in both panels were simulated for a single binding site with a
Kd of 25 ± 2 M, as described in Section II.3.2.
48
Figure II.6 - (A) Partial view of the [1H, 15N] HSQC spectrum of 550 M Zn-rubredoxin acquired in a
Bruker AvanceIII 600 MHz spectrometer equipped with a cryoprobe, at 298 K in 10 mM Tris–HCl pH 7.6, in the absence of cytochrome c3 (red lines) and in [cytochrome c3]/[rubredoxin] = 1.5 (blue lines).
(B) Chemical shift variation of some D. gigas rubredoxin amide resonances with increasing molar ratios of D. gigas cytochrome c3: V8 (◊), C9 (×), C42 (O) and S45 (◊). The fitting curve was simulated for a single binding site with a Kd of 25 ± 2 M, as described in Section II.3.3.4.
51
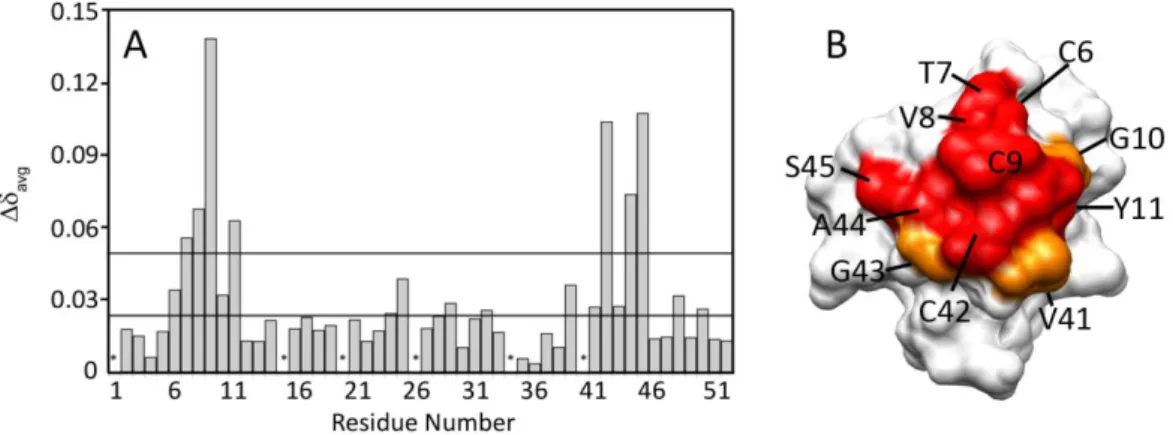
Figure II.7 - (A) Chemical shift change of the cytochrome c3-rubredoxin complex, determined by heteronuclear 2D NMR titration at 298 K in 10 mM Tris–HCl buffer, pH 7.6, as described in Section 2. (B) Mapping of the interacting surface of rubredoxin with cytochrome c3. The residues are coloured
according to their avg: in white are residues with avg < 0.025, in orange are residues with 0.025 <
avg < 0.050 ppm and in red residues with avg > 0.050 ppm.
52
Figure II.8 - Structure of D. gigas rubredoxin (A–C) and D. gigas cytochrome c3 (D–F). Rubredoxin is
depicted as backbone coloured in dark red, with the iron ion displayed as an orange sphere and facing the reader (Panel A). Rubredoxin is displayed with its surface coloured by electrostatic potential in the same orientation as in A (Panel B), or after a 180º rotation in the vertical axis (Panel C). Cytochrome c3 is depicted as backbone coloured in red, with heme IV coloured blue and other
xxii
charges and red negative charges. Figures were prepared with UCSF Chimera [35], using 1RDG.pdb
(Panels A–C) and 1WAD.pdb (Panels D–F).
53
Figure II.9 - A) 300 top model complexes ranked by the Electrostatic energy minimization score of the restrained docking of cytochrome c3 with rubredoxin. B) Same as in A and showing the top 20 best
solutions that have the shorter distance between rubredoxin iron and cytochrome c3 heme IV methyl
M2 or M18 (as described in Section II.2). In Panel A and B the iron of rubredoxin of each putative model complex is represented as a grey-coloured sphere while the top 20 solutions are represented as larger, black-coloured spheres. Panel C shows the top model structure of this complex. In Panel A– C, D. gigas cytochrome c3 is displayed in the same orientation with green backbone and with heme IV
coloured red and the others coloured orange. In Panel C, rubredoxin is represented with a grey backbone with the iron as a red- coloured sphere. Panels D and E represent the residues involved in the interface in the D. gigas rubredoxin (panel D)-cytochrome c3 (panel E) model complex. The
involved residues are coloured red and labeled accordingly. These residues were identified using the PROTORP server. Panels A, B and C were prepared using Chemera, BiGGER's companion molecular graphics software, and panels D and E were prepared using UCSF Chimera [35]. 55
Figure III.1 - Paramagnetic properties of trivalent lanthanide ions. The radii of the yellow spheres indicate the distance from the metal ion where the 1H NMR signals of a protein with a rotational
correlation time of 15 ns would be broadened by 80 Hz on an 800 MHz NMR spectrometer due to paramagnetic relaxation enhancement (PRE). The isotropic χ tensors were calculated according to ref. [10], for a temperature of 25ºC. Representative isosurfaces for pseudocontact shifts (PCSs) of >5 ppm are plotted for χ tensors reported for calbindin D9k [11]. Electronic relaxation times
expected at 18.8 T are indicated at the bottom. Image from ref. [8].
66
Fig. III.2 – General structure of a (tetrakis)-N-substituted cyclen molecule, with the most commonsubstituents and acronyms listed.
69
Figure III.3 – A) Left: Ribbon representation of D. gigas rubredoxin (PDB file 1RDG). Middle, right: Coulombic surface coloring of rubredoxin at 298 K, the right-hand side representing a 180 degree vertical axis rotation of the surface to its left. B) Left: Ribbon representation of D. gigas cytochrome c3. Middle: Coulombic surface coloring at 298 K of cytochrome c3 in the same orientation of the left
hand-side panel. Right: 180 degree vertical axis rotation of the cytochrome c3 surface to its left, to
xxiii Figure III.4 – Electrostatic potential near the four different heme groups of D. gigas cytochrome c3.
Hemes I and III are surrounded mainly by negatively charged (red color) or neutral (white color) residues. On the other hand, hemes II and IV are surrounded by positively charged residues (blue color). Notice that heme IV does not have its propionate groups directly exposed to the solvent, unlike the remaining hemes. Images created with UCSF Chimera. Charges were calculated using the Force Field ff99SB package for the aminoacid residues [33].
73
Figure III.5 – 1H NMR spectra of the titration of Gd-DOTP to 150 M cytochrome c3. i) Cytochrome c3;
ii) cytochrome c3 in the presence of 0.10 equivalents of Gd-DOTP; iii) cytochrome c3 in the presence
of 2.0 equivalents of Gd-DOTP. Spectra were acquired at 298 K in a Bruker Avance III 600 MHz
spectrometer.
74
Figure III.6 - Chemical shift analysis of selected methyl resonances on the Gd-DOTP-cytochrome c3
titration. ◊: Heme III M12; : Heme III M2; Δ: Heme IV M12; X: Heme I M7. An average value of 20 M was calculated for the Kd using Microsoft Excel and the formula described in Chapter II. In this
case, for a best fit in the initial part of the titration, it was predicted that 0.5 Gd-DOTP molecules can
bind one molecule of cytochrome c3.
76
Figure III.7 – 1H NMR titration of 150 M cytochrome c3 with Gd-DOTAM, at pH 7.6. Bottom (black
line): cytochrome c3 alone; top (grey line): cytochrome c3 in the presence of 1.0 equivalents of
Gd-DOTAM. Spectra were acquired at 298 K in a Bruker Avance III 600 MHz spectrometer.
76
Figure III.8 – [1H, 15N] HSQC spectra of the titration of Gd-DOTP (negatively charged) with15
N-Zn-rubredoxin. Legend: 75 M rubredoxin (red); 200 M Gd-DOTP and 50 M rubredoxin (blue). Spectra were acquired in a Bruker Avance III 600 MHz spectrometer with a TCI cryoprobe.
78
Figure III.9 – [1H, 15N] HSQC spectra of the titration betweenD. gigas 15N-Zn-rubredoxin and
Gd-DOTAM (positively charged). Legend: 75 M rubredoxin (red); 200 M Gd-DOTAM and 50 M rubredoxin (blue); 125M Gd-DOTAM, 31 M rubredoxin and 125 M cytochrome c3 (orange).
xxiv
overlapped in all spectra, and cannot be deconvoluted. The intensities were corrected for dilution. Error bars were determined based on the signal to noise ratio.
80
Figure III.11 – Mapping of the most broadened resonances on the surface of D. gigas rubredoxin by Gd-DOTAM. Red: residues which NH resonances were broadened beyond detection. Orange: residues which NH resonances were broadened to more than 30% of the original intensity. The surface on the right hand side represents a 180° vertical axis rotation of the surface on the left-handside.
81
Figure III.12 – Peak intensity ratios, calculated in the same fashion of Fig. III.10. Legend: Blue columns – Rubredoxin : 4 Gd-DOTAM; Red columns – Rubredoxin:4 Gd-DOTAM: 4 cytochrome c3; Green
columns: Rubredoxin: 1.7 cytochrome c3. All intensities have been corrected for dilution. Error bars
were determined based on the signal to noise ratio.
82
Figure III.13 A) – Difference in peak intensity ratio between rubredoxin: 4 Gd-DOTAM:8 cytochrome c3 and rubredoxin: 4 Gd-DOTAM. B) Mapping on rubredoxin surface of residues which NH resonances
increase intensity in the presence of 8 equivalents of cytochrome c3. Asterisks indicate proline
residues and the first methionine residue. Resonances 3 and 49, 9 and 50, and 35 and 42 are partly
overlapped and cannot be deconvoluted (+).
83
Figure III.14 – Garrett plot of the titration between cytochrome c3 and rubredoxin (final ratio 1.7)
(dark grey columns) and rubredoxin:4 Gd-DOTAM: 4 cytochrome c3 (black columns).
84
Figure III.15 – A) D. gigas Rubredoxin residues affected due to the binding of cytochrome c3, in the
absence of Gd-DOTAM (Chapter II, [34]). B) Mapping on rubredoxin surface of residues, whose NH resonances were most affected by the presence of Gd-DOTAM; red: NH broadened beyond detection; pink: NH broadened to below 30% of their initial intensity. ; C) B) Mapping on rubredoxin surface of residues which NH resonances increase intensity in the presence of 8 equivalents of cytochrome c3 (orange color). Residues not detected are colored red. D) Coulombic surface of
rubredoxin surface, calculated as described in Fig. III.3.
85
Figure IV.1 – Titration of Zn-rubredoxin (400 M) with SOR monitored by [1H, 15N] TROSY-HSQC, inphosphate buffer pH 6.8 at 50 mM ionic strength. Spectra were acquired on a Bruker Avance800 spectrometer at 298 K. Red: ZnRd/SOR = 0; Blue: ZnRd/SOR = 1.0. Panels A and B represent insets of the full spectra, highlighting selected resonances that belong to or are in the vicinity of the metal
xxv methionine 1, and to the 5 proline residues. B) Estimation of the Kd for the binding of SOR to Zn-rubredoxin. The residues presenting the biggest chemical shift variation were used in this calculation, C9 (closed circles I=32mM, open circles I=50 mM) and C42 (closed squares I=32 mM, open squares I=50 mM). The data was fitted by adjusting the same Kd value to all data sets simultaneously and considering a 1:1 model. The Kd was estimated to be 3.0 ± 0.4 M. C) Surface mapping of the most affected rubredoxin residues upon complex formation. The structure on the left represents a “head on” view of the metal center, while the structure on the right-hand side represents a 180º rotation on the vertical axis. Black: > 0.03 ppm. Grey: 0.03 ppm > > 0.015 ppm. White: 0.015 ppm > . Molecular graphics images were produced using UCSF Chimera [27].
105
Figure IV.3 – Typical 1H-15N HSQC spectrum ofD. gigas superoxide reductase in solution, at a
concentration of 300 M.
107
Figure IV.4 – Superimposition of the three available class II SOR structures, depicted as ribbons. Purple: T. maritima; Light blue: P. horikoshii. White: P. furiosus. The overall orientation of the beta-sheets and the metal-binding loops are kept. RMSD = 1.8 Å.
108
Figure IV.5 – Sequence comparison between the class II SORs with published three-dimensional structure, and the D. gigas SOR. The conserved metal binding residues are highlighted by rectangles. Asterisks: Conserved residues. Dots: Semi-conserved residues (similar geometry and chemistry). Semi-colons: Semi-conserved residues (similar chemistry).108
Figure IV.6 – PDBSUM analysis of the features of the three-dimensional folds of the SORs of T. maritima (top) and the D. gigas model (bottom). Purple arrows: beta sheets. Pink helix: alpha-helix motif. Hairpin: beta-hairpin motif. Green inverted triangles: active site residues.109
Figure IV.7 - 3D representations of: A, B) rubredoxin (PDB file 1RDG); C,D) desulforedoxin (PDB file 1DXG); and E,F) SOR model constructed by homology modeling from PDB file 2AMU using SwissProt. On the right hand-side column, the Coulombic charge surface of each protein is represented (red = negative charge, blue = positive charge, calculated with a = 4r and ± 10 kcal/mol thresholds. Charges were calculated using the AMBER force field ff99SB package for the aminoacid residues [30]xxvi
conservation. Red: most probable. Green, blue: least probable. Figure created with RasMol [31].
112
Figure IV.9 – A) Restrained-docking simulations for D. gigas rubredoxin – SOR complex. SOR’s backbone is represented as a blue ribbon, and its Fe atom as an orange sphere. The top 100 solutions ranked by the electrostatic score are represented as light-green spheres centered on their Fe ion. B) Three best model structures of the electron transfer complex, with a minimum distance between the NH group of both C9 and C42 of rubredoxin to the Fe ion of SOR center. In these models rubredoxin is coloured blue, magenta and white, with Fe atoms depicted in orange. Images created with UCSFChimera.
113
Figure IV.10 – Determination of the kapp values for the rate of superoxide-mediated rubredoxin
oxidation at 494 nm, at different ionic strengths.
114
Figure IV.11 - [1H, 15N] TROSY-HSQC spectra of 400 M Zn-desulforedoxin in the absence (red) and with 1.5 equivalents of superoxide reductase added. (blue). Spectra were acquired on a Bruker AvanceIII 600 spectrometer at 298 K, at an ionic strength of 50 mM.
116
Figure IV.12 – A) Garrett plot of the titration between 15N-Zn-desulforedoxin and SOR. B) Mostaffected residues (grey colour) above the threshold line of > 0.05. Most are not visible due to
being buried within the protein core.
117
Figure IV.13 – Ionic strength dependence of the electron transfer rate between desulforedoxin and SOR. Values represent a median and the standard deviation.
118
Figure IV.14 – A) 2D NMR competition assay between desulforedoxin and rubredoxin for binding to SOR. Red colour: Rubredoxin:Desulforedoxin:SOR = 1:0:0; Blue colour: Rubredoxin:Desulforedoxin:SOR = 1:0:1; Orange colour: Rubredoxin:Desulforedoxin:SOR = 1:3:1. Note that resonances C9 and C42, which broaden beyond detection upon SOR binding, become sharpened upon addition of excess desulforedoxin. B) Changes in the averaged chemical shift between 1:1 rubredoxin:superoxide reductase complex, and 1:1:3 rubredoxin:superoxidereductase:desulforedoxin.
120
Figure IV.15 – Effect of the addition of increasing amounts of Zn-rubredoxin on the desulforedoxin reoxidation rate in the presence of superoxide and catalytic amounts of SOR, measured at 504 nm.
xxvii SOR’s backbone is represented in blue ribbon, and its Fe atom as an orange sphere. The top 100 solutions ranked by the Fe-Fe distance score are represented as light-green spheres centered on
their Fe ion. B) Best model structure of the electron transfer complex, obtained by intersecting
the top 200 electrostatic energy minimization solutions with the top 200 solutions in terms of
Fe-Fe distance, with a minimum distance between the Fe atoms of both desulforedoxin (dark red
ribbon) and SOR of 10 Å. Images created with UCSF Chimera.
122
Figure IV.17 – Most probable residues involved in the complex interface. A) rubredoxin. B) desulforedoxin. C) Superoxide reductase upon interaction with rubredoxin; D) Superoxidereductase upon interaction with desulforedoxin. Orange colour: residues present in the complex
interface in all the analyzed geometries. Yellow: residues present in the complex interface in part
of the analyzed geometries.
124
Figure IV.18 – Estimation of the Kd value for the desulforedoxin-superoxide reductase interaction,
xxviii
Table II.1 – Chemical shift variation of assigned heme methyl resonances upon addition of 3 equivalents of either Fe- or Zn-rubredoxin per cytochrome c3
47
Table III.1 – Comparison between the induced chemical shifts on cytochrome
c
3resonances induced by Fe-rubredoxin and Gd-DOTP
75
Table IV.1 –Sequence identity and similarity percentages between
D. gigas
SOR
Anybody who has been seriously engaged is scientific work of any kind realizes that over the
entrance to the gates of the temple of science are written the words: “Ye must have faith”.
3
Index
I. General Introduction 5
I.1 Protein Complexes 5
I.2 Characterization of Transient Protein Complexes: Electron-Transfer Proteins 7
I.3 NMR applied to biomarcomolecules – state of the art and latest developments 9
I.4 In silico docking 11
I.5 Dealing with O2 12
I.6. Reactive Oxygen Species 12
I.7 ROS targeting of biological macromolecules 13
I.8 Coping with ROS – Fe and Fe centers 14
I.9 Proteins used in this work 15
I.9.1 Rubredoxin 15
I.9.2 Desulforedoxin 17
I.9.3 Superoxide Reductase 18
I.9.4 Cytochrome c3 24
I.10 Objectives 29
5
I. General Introduction
Ever since oxygen started being produced by some early-developed microorganisms, the
intracellular effects of reactive oxygen species (ROS) generated by incomplete reduction of
this molecule became a problem for organisms, which were unprepared to deal with lipid
oxidation, DNA damage and protein degradation. Radical anion superoxide (O
2.-) scavenging,
among others, became tantamount with survival in an increasingly harsher environment for
anaerobes when exposed to aerobic environments.
In this section, one of the enzymatic systems developed by anaerobes to overcome this
oxidant burden, the superoxide reductase (SOR), will be briefly described, as well as its two
putative physiological electron donors, rubredoxin and desulforedoxin. These two small
electron transfer proteins, containing a simple FeS center, reduce the catalytic center of
SORs to its ready state, among other electron transfer (ET) partners (
vide infra
).
The electron transfer ET complexes that are formed between SOR and its partners belong to
a class termed weak or transient protein complexes. Therefore, they have a number of
characteristics, such as very fast dissociation rate constants that has always made their
analysis somewhat more difficult than for strong protein complexes.
This chapter will start by explaining the properties that govern the formation of protein
complexes, with special focus on the subgroup of electron transfer complexes, and the
techniques that can be applied to characterize them.
I.1 Protein complexes
In vivo,
the function of most cellular processes involves the interaction between one protein
and one or more protein partners. Hence, it is of the utmost importance to understand the
way that proteins interact with each other and which factors influence or dictate the
formation of these complexes. One of the current topics that draw the most interest in
Biochemistry and Life Sciences, lies in the characterization of the interactome, coupled to
systems biology. Since at the molecular and cellular level, biological structure and function
are related to complex interactions between proteins and other molecules, there has been a
6
protein interactions
in vivo
. To that effect, techniques such as genomic analysis,
ab initio
predictions using algorithms based solely on primary structure and domain conservation
(although still with a very large number of false positives and negatives), or
co-immunoprecipitation and yeast two-hybrid assays can be employed [1-5].
The affinity of these interactions can range from very specific to almost non-specific, and
from the very tight (dissociation constant [K
d] values in the 10
-15M range) to the very loose
(K
din the 10
-3M range, where K
d=
k
off/ k
on). The most stable complexes are usually defined
by very large complementary surface, and examples of these types of complexes include
antibody-antigen interactions, and protease inhibitors - protease complexes.
On the other hand, pathways that require a high turnover for a controlled flow of substrate
or electrons are usually populated/composed by complexes with low binding specificity [6].
This arises from the fact that these proteins need to interact with two (or more) partners,
thus the forces that drive the formation of these complexes are necessarily different in
nature. Hence, the
k
offvalues need to be large in order to guarantee a high turnover,
resulting in contact lifetimes that can be as short as 100
s [7].
There have been numerous hypotheses put forward to identify the factors that govern
protein association and dissociation in the case of electron transfer proteins. Poorly packed
geometric surfaces may be responsible for this phenomenon. Furthermore, the presence of
polar residues in the vicinity of the electron transfer centers may help in the re-solvation
process which is essential for the dissociation process. Usually, the electron-transfer
assembly is formed by surface charge complementarity between the two partners acting as
a tether or pre-orientation step, resulting in an ensemble of possible conformations known
as the encounter complex, which is characterized by a reduction in the dimensionality of the
diffusional search [6, 8]. The hydrophobic patch will then confer specificity and increased
affinity, resulting in enhanced rates of electron transfer when compared to chance
7
I.2 Characterization of Transient Protein Complexes: Electron-Transfer Proteins
ET protein complexes are notoriously difficult to co-crystallize due to the weak interaction
between the partner proteins, which can be disrupted by the crystallization conditions or
eventually end up co-crystallizing the complex in a non-physiologically relevant structure [9].
One alternative that has been on the rise since the mid-1990’s to characterize these
complexes consists of multidimensional NMR experiments. In these experiments one can
follow the effect on the resonances of one protein upon binding of its partner (another
protein or a ligand) and thus extract information on the surface of interaction, K
Dor even
make use of nuclear Overhauser effect (nOe) restraints to calculate the structure of the
partner proteins upon complex formation. NMR methods, however, can be cumbersome
and time-consuming
– the cost of over-expressing
15N and/or
13C-labelled proteins aside,
backbone resonance assignment must be performed on at least one of the interaction
partners, but preferably on both, a task that becomes increasingly difficult with the
increased size of the protein. Furthermore, increase in tumbling times resulting from
complex formation can result in severe line broadening (not to mention spectrum crowding),
thus hampering a straight-forward analysis of the obtained spectra. However, in the last
decade a range of new NMR methods have been developed to help overcome these effects
(section I.5).
One of the most used NMR experiments is the Heteronuclear Single Quantum Coherence
(HSQC), which establishes a correlation between the proton and the nitrogen (
15N isotope)
of an amine or amide group. In a
15N-labeled protein, the HSQC spectrum gives rise to
roughly as many resonances as there are amino acid residues, thus being considered the
“fingerprint” of the protein. Briefly, by a combination of scalar coupling and pulse
sequences, coherent resonance is transferred from the proton to the nitrogen and back
before acquiring the free-induction decay (FID) signals, after a certain time of evolution
according to the chemical shift (
t
1). By varying
t
1systematically a determined number of
times, one can obtain several
1H spectra that are effectively modulated by the
15N chemical
shift [9]. Fourier transformation applied to the frequency domain of the resulting FIDs will
yield a plane containing the relevant amide resonances (all the amides from the peptide
8
glutamine, asparagine and tryptophan), with one axis representing the
15N chemical shifts,
and the other the
1H chemical shifts.
A typical NMR-based methodology for complex characterization revolves around chemical
shift perturbation mapping. In this experiment, a
15N-labelled protein (or, in rare cases, a
protein with special, well-resolved resonances, such as cytochrome
c
3used in Chapters II and
IV that has several resonances belonging to the heme methyl groups shifted downfield due
to the paramagnetism of its Fe center, described in more detail below) is titrated against an
unlabelled partner. By monitoring the chemical shift changes of amide proton resonances
that echo the changes in the chemical environment, one can establish the region of
interaction [10]. Furthermore, titrations can also help establish the stoichiometry and
affinity of the complex by fitting observed chemical shifts or linewidth broadenings to a
quadratic equation that depends on the dissociation constant (K
d).
However, the short interaction time of some of these complexes and/or the existence of
several, dynamic, short-lived (ns to
s) functional ET orientations of both partners can lead
to small or virtually undetectable chemical shift differences. In this case, other techniques
based on
15N spin relaxation can provide information about the encounter-complex
formation by establishing the change in correlation time and changes in local dynamics
reflected on the relaxation rate constants
R
1and
R
2(longitudinal and transverse relaxation,
respectively). Cross-saturation transfer techniques (Fig. I.1 A) (in which one of the partners is
perdeuterated) take advantage of the spin-diffusion effect caused by irradiating a specific
region of the non-deuterated partner (usually the methyls region at ~1 ppm) onto the
binding partner, thus decreasing its signal intensity. Finally, paramagnetic relaxation
enhancements (PRE) can also be used to predict the binding interfaces of very weak
9 Figure I.1 – A) Schematic representation of a Cross-Saturation Transfer experiment. Resonances of a
non-deuterated partner (Protein A) are selectively irradiated until saturation. Spin-diffusion
phenomena will transfer said saturation throughout the polypeptide chain. Upon binding of a
perdeuterated partner (Protein B), and depending on the intensity and time of irradiation, the
saturation will be transferred either to the interacting residues, or to the whole protein, enabling the
identification of the binding region. B) A partner with a paramagnetic center or probe (A) will cause
pseudo-contact shifts (PCS) and PRE to a partner (B) that binds at or near the paramagnetic site.
Since these effects are distance dependent, this allows the mapping of the interacting surface.
I.3 NMR applied to biomolecules – state of the art and latest developments
NMR has become an incredible and robust tool for investigating matter, ranging from
powder solids to dilute macromolecules in solution, from 3D body imaging to inorganic
chemistry. All stemming from the same principle: the behavior of magnetization of nuclei
with I ≥ 1/2 in an applied external magnetic field, when a radio-frequency pulse is applied.
Techniques that allow the researcher to assign resonances and determine the
three-dimensional structure of small proteins have become standardized in the past two decades.
Overexpression and purification of single or double-labeled (
15N and
13C) proteins has
10
determination of resonance assignment (2D HSQC, 3D HNCO, HNCA, HNCACO, among
others) and distance constraints (NOESY) are readily available and easier to implement.
Recent years have also seen the development of spectrometers with more potent magnetic
fields (up to 23 T at the moment) and cryo-cooled probeheads that enable increased
resolution and sensitivity, crucial aspects thatfor larger systems that require the correct
assignment of closely co-localized resonances, as well as for less concentrated samples.
X-ray crystallography has been the preferred method for protein structure determination. In
the PDB, the structures solved by X-Ray outnumber the NMR-solved structures by 7 to
1 (asof September 2010).
X-ray crystallography, however, presents a series of drawbacks:
membrane proteins require lipid bi-layers and the right combination of detergents for
stabilization, rendering their crystallization a much more difficult task [11, 12]. Likewise, it is
a harder task to garner insight about molecular dynamics from the static nature of crystals
(though there are several examples of mechanism elucidation of enzymes by analyzing
crystals obtained in different steps of the mechanism [13, 14]). Furthermore, the structure of
complexes, especially weak-binding ones, becomes increasingly difficult to calculate due to
the disruption of the interactions by crystal packing forces. In addition, these structures
reflect the state of minimum energy, which may not reflect the actual complex
in vivo
. NMR
has proved to be a viable alternative to overcome these difficulties in complex
characterization. Solid State NMR (ssNMR) can be applied to magnetically-aligned lipid layers
containing membrane proteins, taking advantage of the anisotropy of magnetic interactions
to infer structural constraints [15]. Magic Angle Spinning (MAS) NMR, in which samples are
spun at the magic angle (54.7º) thus eliminating one of the components responsible for fast
relaxation (see chapter III), also becomes useful in larger systems for extensive resonance
assignments, as they produce narrow lines [16]. Transverse-relaxation optimized pulse
sequences, such as TROSY [17, 18] may also prove helpful in these cases.
Since most of the broadening effects are dependent on the gyromagnetic ratio of the
observed nucleus (according to the relevant Solomon-Bloembergen equations [19]), direct
detection of heteronuclei such as
13C instead of
1H will lead to narrower bands [20]. Finally,
the recent development of fast methods such as SOFAST-HMQC and APSY [21], which take
11
time of spectra (plus the probability of protein degradation and the associated costs) from
several days to within a few hours for smaller subjects.
Furthermore, since most ET complexes possess metal centers that are paramagnetic in
nature, the added NMR spectral effects were also considered a nuisance (line width
broadenings, enhanced chemical shifts; see below for further details). In recent years,
however, paramagnetic effects have also been taken as an advantage in numerous aspects
of biomolecular NMR. Indeed, in the present work, the paramagnetic effects of metal
centers and lanthanide probes will be used to describe the binding surfaces. This will be
achieved by analyzing quantitatively and qualitatively the presence and magnitude of both
chemical shifts and resonance broadening.
I.4
In silico
docking
Ab initio
docking studies can also be used to predict the structure of a complex from which
no information about relative orientation of the proteins is known
a priori
. Using the
structures of the interacting proteins in their free form as a starting point, docking
algorithms will search the conformational space of one protein (the target) by varying the
orientation of the other (the probe), calculating and ranking several aspects of the
interaction, including (but not limited to) steric complementarity of the interaction sites,
electrostatic energy minimization upon binding, and hydrogen bonding [22-24]. It can also
be used to validate complex geometries calculated based on experimental work, or
incorporate information from it for docking refinement
– the so-called restrained docking
approach.
Several docking algorithms are currently available (reviewed in detail in [25]). In general,
they all operate in a similar manner: starting from protein structures deposited in databases,
such as the Protein Data Bank (PDB), the algorithms will try to move one molecule (the
probe) in all six degrees of freedom (rotational and translational) relative to the other
protein (the target), calculating in each step several parameters, such as Coulombic charge
repulsion, accessible solvent area and geometric complementarity. Experimental restraints,
12
residues for the interaction by site-directed mutagenesis can help filter out wrong solutions
by limiting the search to complexes that do not violate these restraints.
Others may include refining steps after the initial searching methodology, by allowing the
most probable structures some conformational mobility, reflecting the small conformational
changes that are likely to occur
in vivo
[25]. Since it is unfeasible to calculate all possible
conformations, flexibility is usually restricted to the side-chains of surface residues.
Scoring is also a key point in
in silico
protein docking. Usually, docking algorithms will present
the lowest energy solutions as the top putative complexes. In order to ensure that this
calculation is indeed correct, several individual (referring to an atom) or collective (referring
to the entire macromolecule) parameters can be used: steric complementarity, electrostatic
energy repulsion minimization, and hydrogen bonding.
BiGGER is one of these algorithms [26, 27], which was developed in Prof. Moura’s laboratory
in the past decade, and the one chosen here to perform the molecular docking studies. Its
main advantages over other docking software include fast computational time and no need
of any
a priori
information or constraints. The mode of action of this algorithm will be
described in further detail on subsequent relevant chapters (chapters II and III). Other
algorithms available (such as HADDOCK or RosettaDock) can present a subset of other
functionalities (side-chain and backbone mobility, simulated annealing) that can, in theory,
help in predicting more accurately complexes (specially those with higher affinities wherein
conformational modifications can occur); however, the long computational times and the
need for experimental restraints can hinder their efficient use for some systems [25].
Furthermore, for the type of complexes under study on this thesis, no significant gain would
be achieved from using these algorithms.
I.5 Dealing with oxygen
Rubredoxin, desulforedoxin, cytochrome
c
3and superoxide reductase are involved in
(though not necessarily limited to) cellular processes dealing with the presence of O
2or one
of its reactive species, in anaerobic organisms. In the
Desulfovibrio
genus, from which all the
proteins used in this work were isolated (either directly or by overexpression of recombinant
13
O
2as the final electron acceptor, while SOR, desulforedoxin and rubredoxin have been
implicated in the detoxification of the radical anion superoxide. In the next sections, the
problem of oxygen exposure in anaerobes and the pernicious effects of reactive oxygen
species will be explained in more detail, as well as, the fundamental characteristics of the
proteins under study.
I.6 Reactive Oxygen Species
Oxygen is an essential molecule for the aerobic domain of life. After the advent of oxygenic
photosynthesis some 2.5 x 10
9years ago [28], the atmosphere rapidly started to show
increased concentration of its reaction product, oxygen, thus leading to the development of
aerobic organisms that utilize it as a final electron acceptor in respiratory chains. This,
however, posed a problem to many anaerobic organisms that used methane, hydrogen or
other small reduced molecules as electron acceptors, and were not prepared to deal with
the consequences of intracellular oxygen (see next section). Oxygen, while essential for life,
can have a lethal effect by promoting the production of ROS. Addition of electrons to
anti-bonding orbitals in the triplet state to form the radical anion superoxide (O
2.-) or peroxide
anion (O
22-) leads to weakening of the O-O bond. The anions generated by the reduction of
oxygen can then react with a myriad of different targets
in vivo
.
For anaerobes, one option would be to only colonize or restraint their growth to safe
environmental niches (sediments where oxygen cannot penetrate, for instance). One other
complementary option would be to develop anti-oxidant defenses.
Although
Desulfovibrio
strains generally exhibit oxygen reduction rates comparable to those
of aerobic bacteria (up to 670 nmol O
2reduced per minute and per milligram of total
protein), the microorganisms do not seem to survive after prolonged exposure to moderate
oxygen concentrations, nor to repeated oxygen exposure [29].
I.7 ROS targeting of biological macromolecules
14
Superoxide can cause damage to cellular components either directly or indirectly by
originating further ROS. Reaction of O
2.-with iron-sulfur clusters can lead to iron release [30],
with its subsequent participation in Fenton-like chemistry generating hydroxyl radicals. The
reaction of hydrogen peroxide with reduced heme groups can also generate superoxide and
heme degradation, with release of more Fe ions [31]. Condensation of superoxide with the
.


![Figure II.6 - (A) Partial view of the [ 1 H, 15 N] HSQC spectrum of 550 M Zn-rubredoxin acquired in a Bruker AvanceIII 600 MHz spectrometer equipped with a cryoprobe, at 298 K in 10 mM Tris–HCl pH 7.6, in the absence of cytochrome c 3 (red l](https://thumb-eu.123doks.com/thumbv2/123dok_br/16494273.733495/79.892.139.758.602.859/partial-spectrum-rubredoxin-acquired-avanceiii-spectrometer-cryoprobe-cytochrome.webp)