IMAGE AND CSR PURCHASING BEHAVIOR
Chujun Huang
Dissertation submitted as partial requirement for the conferral of Master in Business Administration
Supervisor:
Prof. Nelson António, ISCTE Business School, Department of Marketing, Operation and General Management
Co-supervisor:
Prof. Ana Simaens, ISCTE Business School, Department of Marketing, Operation and General Management
Spine
-TH
E
ST
U
D
Y
O
F
TH
E
RE
LA
TI
O
N
SH
IP
BE
TW
EE
N
BR
A
D
N
IM
A
G
E
A
N
D
CS
R
PU
RC
H
A
SI
N
G
BE
H
A
V
C hu ju n H ua ngAbstract
Corporate social responsibility (CSR) has become a hot topic in the recent years. More and more companies start to adopt the CSR strategy and implement the CSR behavior in order to satisfy their stakeholders in the world.
Consumer, as one of the critical member of stakeholders, can positively or negatively affect or be affected by the CSR performance of the company. On the other hand, in the marketing aspect, brand image plays an important role in differentiation and value creation. In addition, brand image can affect the purchasing behavior of consumer through a series of the complex psychological process. In this dissertation, we are going to study the CSR perception of Chinese consumers, and the relationship among CSR perception, brand image and CSR purchasing behavior.
We start the quantitative research by developing a questionnaire, which is handed out to the Chinese respondents through WeChat.
In the end, there are two interesting findings in the research: (1) brand image plays as a complete mediator in mediating the relationship between brand awareness and CSR purchasing behavior; (2) CSR perception plays as a complete mediator in mediating the relationship between brand image and CSR purchasing behavior.
Keywords: Corporate social responsibility; stakeholder theory; brand image; consumer behavior
Resumo
A Responsabilidade Social das Empresas (RSE) tem sido muito debatida nos últimos anos. Mais e mais empresas começaram a implementar a Responsabilidade Social para satisfazer os seus stakeholders.
Os consumidores, enquanto um dos stakehoders mais críticos, podem ser positivamente ou negativamente afetados pelo desempenho da RSE. Por um lado, no aspeto de marketing, a imagem da marca tem um papel importante na diferenciação e criação de valor. Para além disso, a imagem da marca pode afetar o comportamento de compra através de um processo psicológico complexo. Nesta dissertação, iremos estudar a perceção referente à RSE dos consumidores Chineses e a relação entre a perceção da RSE, a imagem de marca e o comportamento de compra.
Iniciamos a análise quantitativa pelo desenvolvimento de um questionário, que foi distribuído pelo WeChat.
Da pesquisa efetuada destacamos dois resultados: (1) a imagem de marca desempenha um papel de mediador ao mediar a relação entre a consciência de marca e comportamento de compra socialmente responsável; (2) a perceção de responsabilidade social desempenha um papel de mediador ao mediar a relação entre imagem de marca e comportamento de compra responsável.
Palavras-Chave: Responsabilidade Social das Empresas; teoria dos stakeholders; imagem de marca; comportamento do consumidor
Acknowledgments
During the period of writing my dissertation, I would like to thank Prof. Nelson António and Prof. Ana Simaens. I am grateful for their instruction and encouragement.
Furthermore, I sincerely appreciate my family and friends, who support and encourage me all the time.
Overall, I have been studying in Lisbon for two years. I appreciate this beautiful city and the warmhearted people I have met here.
Index
1. Introduction... 1
2. Literature Review...3
2.1 Stakeholder theory...3
2.1.1 The origin of stakeholder theory... 3
2.1.2 The issues of stakeholder theory in management...5
2.2 Corporate social responsibility...7
2.3 Brand image... 10
2.3.1 Customer-based brand equity...10
2.3.2 The link between CSR and brand image in a stakeholder framework 12 2.3.2.1 Consumers...12 2.3.2.2 Employees... 13 2.3.2.3 Supplier... 13 2.3.2.4 Government...14 2.3.2.5 Media...14 2.3.2.6 Community...14 2.4 Consumer behavior...15
2.6 Model graph and hypothesis...16
2.6.1 Model graph... 16
2.6.2 Hypothesis...16
2.7 Summary... 17
3. Methodology... 19
3.2 Questionnaire...19 3.3 Pilot test...19 3.4 Data collection...20 3.5 Tool... 20 4. Result...21 4.1 Demographic analysis... 21 4.2 Reliability analysis... 22 4.3 Validity analysis...22
4.3.1 General consumers’ purchasing behavior of CSR scale (GPB)...23
4.3.2 General consumers’ perception of CSR scale(GCP)...24
4.3.3 Consumers’ purchasing behavior of Starbucks scale (CPB)...25
4.3.4 Consumers’ CSR perception of Starbucks scale (CP)...26
4.3.5 Brand image scale... 27
4.3.6 Brand association scale... 28
4.3.7 Brand awareness scale...29
4.4 Correlation analysis...30
4.5 Regression analysis and hypothesis I... 31
4.6 Structural equation modeling analysis... 32
4.6.1 Mediation effect... 32
4.6.2 Hypothesis II... 33
4.6.3 Hypothesis III...37
4.6.4 Hypotheses summary and mediation effect models...39
4.7 Multiple response analysis... 40
5. Conclusion...43
5.1 Discussion and conclusion... 43
5.2 Limitation... 45
5.3 Further research...45
Reference...46
Annexes...53
7.1 Demographics...53
7.2 Liner regression model...53
7.3 Structural equation model... 55
7.4 Questionnaire in English... 61
7.5 Questionnaire in Chinese...65
Index of Tables
Table 1 What Stakeholder Theory Is Not...7Table 2 Reliability Statistics...22
Table 3 Index of Factorial Simplicity...23
Table 4 KMO and Bartlett’s test of GPB...23
Table 5 Principle Component Analysis of GPB...24
Table 6 KMO and Bartlett’s test of GCP...24
Table 7 Principle Component Analysis of GCP...25
Table 8 KMO and Bartlett’s test of CPB...25
Table 9 Principle Component Analysis of CPB...26
Table 11 Principle Component Analysis of Consumers’ CSR Perception of
Starbucks...27
Table 12 KMO and Bartlett’s test of Brand Image...27
Table 13 Principle Component Analysis of Brand Image...28
Table 14 KMO and Bartlett’s test of Brand Association...28
Table 15 Principle Component Analysis of Brand Association...29
Table 16 KMO and Bartlett’s test of Brand Awareness...29
Table 17 Principle Component Analysis of Brand Awareness...30
Table 18 Correlations Coefficients...31
Table 19 Results of linear regression Statistics (H1a, H1b, H1c, H1d)...32
Table 20 Model Fit Summary of Mediation Model (H2a)...34
Table 21 Confidence Interval of Mediation effect (H2a)...35
Table 22 Model Fit Summary of Mediation model (H2b)...36
Table 23 Confidence Interval of Mediation effect (H2b)...37
Table 24 Model Fit Summary of Mediation model (H3)...38
Table 25 Confidence Interval of Mediation effect (H3)...39
Table 26 Summary of Hypotheses Results...39
Table 27 Reasons that Respondents Choose Starbucks...41
Table 28 Variance Analysis of Gender and GPB and GCP...41
Table 29 Variance Analysis of Age and GPB and GCP...42
Table 30 Variance Analysis of Monthly Income and GPB and GCP...42
Index of Figures
Figure 1 Three Aspects of Stakeholder Theory...4
Figure 2 A History of the Stakeholder Concept...5
Figure 3 The Pyramid of Corporate Social Responsibility...9
Figure 4 Dimension of Brand Knowledge...12
Figure 5 Model Graph...16
Figure 6 The Model of Mediator...33
Figure 7 Structural Equation Model 1 (H2a)...34
Figure 8 Structural Equation Model 2 (H2b)...36
Figure 9 Structural Equation Model 3 (H3)...38
Figure 10 Brand image as a complete mediator of H2b...40
Figure 11 Consumer perception as a complete mediator of H3...40
List of Abbreviations
CSR Corporate social responsibility CPB CSR purchasing behavior
CP CSR perception
GBP General CSR purchasing behavior GCP General CSR perception
1. Introduction
The concept of corporate social responsibility (CSR) has developed in China for nearly three decades. By searching the database of China National Knowledge Infrastructure, we find out that corporate social responsibility has been discussed by Chinese scholars since the end of the 1980s. Gao (2009, p. 26) states “ only after China joining WTO in 2001, CSR was taken seriously in China due to the severe situation of the social irresponsible behavior of business in China and the criticism from oversea”. Namely, the development of corporate social responsibility is still in the beginning stage in China. Consequently, making companies shift the view from resisting or complying the CSR to concern and implement the CSR behavior in their strategy proactively would still take a long time. Though, a large number of companies claim the CSR initiatives, it is possible that these initiatives would become the advertising tool in the end. As a strong developing country, China focuses on the advancement of economy as well as the responsibility of society and environment. In June 2, 2015, General Administration of Quality Supervision, Inspection and Quarantine of the People's Republic of China and Standardization Administration of the People’s Republic of China officially issued three national standards (GB/T 36000-2015 “Guidance on social responsibility”, GB/T 36001-2015 “Guidance on social responsibility reporting” , GB/T 36002-2015 “Guidance on classifying social responsibility performance”). These criterion help to regulate the management and operation of enterprises in the aspect of social responsibility and stakeholders.
Furthermore, taking the social responsibility is the duty of every stakeholder and cannot only depend on the effort of government. For instance, consumer as a key member of stakeholder can encourage the performance of CSR. According to a report of The Boston Consulting Group shows, about 75% of Chinese consumers would maintain or improve their level of consumption, which driven by the strong purchasing intention and power of consumption (June 20, 2016). This suggests that Chinese consumers are potential to support the CSR behavior through purchasing behavior. In addition, brand image might become an important factor that influences
the purchasing intention of consumers. With the advance of living standard, consumers not only care about self-demand but also the social and environmental problems. For example, consumers would like to buy the product made by the well-established company and boycott the company involved in the scandals. Thus, companies make an effort to create a good corporate image in order to gain the support of consumers, which might contribute to the long-term development. In the academic field, a few of articles study the relationship between brand image and purchasing behavior in the perspective of CSR. In this dissertation, we try to study the following questions: What is the perception of consumers about CSR? What influences the CSR purchasing behavior? What is the link between brand image and CSR purchasing behavior?
2. Literature Review
2.1 Stakeholder theory
2.1.1 The origin of stakeholder theory
Stakeholder theory leads a mainstream to the area of both management and morality. In general, “stakeholder” stems from a literature of management at Stanford Research Institute in 1963 (Freeman, 1984). Additionally, there are various understandings of stakeholder theory. Rowley (1997, p. 889) purports two main streams of stakeholder : “(1) the definition of stakeholder and (2) categorizing stakeholders ”. Moreover, Parmar et al. (2010, p. 412) put forward three issues that the stakeholder theory is mainly concerned about: (1) value creation and trade, (2) the ethics of capitalism, and (3) managerial mindset. Namely, how managers consider creating valued transactions without betraying ethics in the turbulent environment. Freeman and Reed (1983) demonstrate two aspects of the stakeholders, the wide sense and the narrow sense respectively. The concept of the wide sense is "any identifiable group or individual who can affect the achievement of an organization's objectives (p. 91)”, while the narrow sense is referred to "any identifiable group or individual on which the organization is dependent for its continued survival (p. 91)”. It is emphasized that the stakeholders must be understood in the aspect of the wide sense rather than those who are primarily satisfied and might be easier to handle. Moreover, Donaldson and Preston (1995, p. 70) state “the stakeholder theory is general and comprehensive, but it is not empty." As a result, they propose three theories, descriptive/empirical, instrumental, and normative (see Figure 1). First of all, the descriptive/empirical theory illustrates the operations and behaviors of a corporation, like “what we stand for?” (Freeman, 1984). Secondly, the instrumental theory demonstrates that the stakeholder theory is an important tool to manage the stakeholder in the corporate strategy. Last but not the least, the normative core of stakeholder theory is the guideline of the moral and philosophical business management.
A landmark book ‘Strategic Management: A Stakeholder Approach’ (Freeman, 1984) depicts an instrumental framework of the stakeholder management. In this book, Freeman divides the stakeholders into two categories, internal groups and external groups respectively. He classifies the internal stakeholders as those who can affect the daily activities of a company. They are owners, customers, employees, suppliers, and stockholders. On the other hand, the external stakeholders refer to those who are uncertain and cannot be assimilated into the internal stakeholders easily. It is pinpointed that the internal and external stakeholders should be distinguished in a specific framework or theory. In addition, Freeman (1984) emphasizes the roles of stakeholders that play in the corporate strategy and business direction. He illustrates four critical kinds of literature and theories, strategic planning, systems theory, corporate social responsibility, and organization theory respectively (see Figure 2). Moreover, Freeman and McVea (2001) give a brief summary of these four elements. The corporate planning is to analyze the business competency and external environmental changes. In the corporate planning literature, stakeholders are regarded as those who might constrain the activities of the firm. The systems theory
emphasizes the importance of establishing an extensive network to connect external links with organizations. In this system, problems will be solved by all stakeholders in order to reach an optimum point of the strategy. The organization theory has the same roots as the systems theory, which aims to explain the existence and nature of an organization in the system perspective. Though the systems theory and organization theory both have constraints on applications, they play a significant role in incorporating every stakeholder into the strategic thinking. The literature of corporate social responsibility enlarges the field of the stakeholder management. However, it still deems the stakeholders as a limitation of management as well as corporate planning does.
Figure 2 A History of the Stakeholder Concept
Source: Freeman (1984, p. 46).
2.1.2 The issues of stakeholder theory in management
Freeman et al. (2004) assert that stakeholder theory provides a direction for managers to create value. They proclaim “stakeholder theory pushes managers to embrace the pragmatic and pluralistic approach and recommends we avoid the philosophical and
single theory approach (p. 365)”. Nevertheless, the stakeholder theory also has some limitations and constraints. Phillips et al. (2003) demonstrate the justifications and misconceptions of stakeholder theory in the article ‘What stakeholder theory is not.' They illustrate the distortions and misinterpretations of the stakeholder theory in detail. There are eight misconceptions about stakeholder theory classified by Phillips et al. (2003). These misconceptions are divided into two groups (Table 1). The first group argues about the issues of managerial opportunism, insufficiently specific objective function, commercial distribution, and equal treatment for stakeholders. These problems display the clash between shareholders and stakeholders. First, the managerial opportunism claims that the managers’ performance is assessed by whether they meet the shareholders’ demand or not. In the scholars’ opinion, opportunism is an issue for any managerial theory and not for the stakeholder theory only. The stakeholder theory provides an opportunity for managers to create benefits for multiple groups. In contrast, shareholder theory is the one who should be punished for shielding the self-dealing. Second, the problems of distribution and insufficient specific function overstate the role of benefit maximization. In this case, we have to acknowledge that for one thing, the stakeholder theory cannot elaborate the daily managerial decision-making (Phillips et al., 2003). For another thing, the stakeholder management requires the appropriate communication to create value and to distribute the value in a fair process. As for the problem of the equal treatment and distribution, it is impossible for a firm to treat different interested groups in the same way since various stakeholders are put in different consideration. The second group misunderstands the role of stakeholder theory playing in the policy, economy, and ethics. The corresponding answers given by the authors are initially, stakeholder theory is an area of organizational strategy and ethics. There is no requirement for changing the current law to adapt the stakeholder theory. Also, stakeholder theory is a system of capitalist economy rather than political economy. Third, stakeholder theory cannot address all moral problems. Finally, stakeholder theory serves for all kinds of the corporation, such as the privately owned businesses, governmentally owned organizations, partnerships, and multinational companies. Overall, stakeholder theory
is a critical and instrumental tool used to balance the intense relationship between economy and morality. Overstating the role of morality in management will make managers trap into the bias of the separation theory.
2.2 Corporate social responsibility
Corporate social responsibility has been involved in intense debates during these years. McWilliams and Siegel (2001, p. 12) state "there is a no consensus on a definition of CSR”. As a consequence, there are various synonyms of CSR, such as corporate philanthropy, corporate social performance, corporate social behavior, corporate social responsive and social voluntarism. Mohr et al. (2001, p. 47) define the CSR as “a company’s commitment to minimizing or eliminating any harmful effects and maximizing its long-run beneficial impact on society”. In addition, CSR is also defined as “a concept whereby companies integrate social and environmental concerns in their business operations and their interaction with their stakeholders on a voluntary basis” (ISO, 2004, p. 28f). In other words, the CSR suggests that companies cannot just aim at pursuing the maximal profits only; Instand, they should take the society and environment into account apart from benefits. Garriga and Mele (2004) illustrate that the field of corporate social responsibility has various theories, which is controversial, complicated and unclear. Hence, the CSR theory is divided into four groups, instrumental, political, integrative and ethical respectively. The instrumental theories disclose that a firm is a mean to create wealth through social activities.
Moreover, instrumental theories highlight the role of altruism, such as the maximization of shareholder value (Friedman, 1970), competitive advantages and cause-related marketing. The political literature includes the corporate constitutionalism, integrative social contract theory and corporate citizenship. It is figured out that corporations should use their business power to take the social duties and to address some particular social issues. The integrative theories claim that corporations should establish the issue management for the significant social problems and political issues; fulfill the interests of the stakeholders, and measure the daily corporate social performance. The ethical literature demonstrates the relationship between business and society about how to create moral value, including the sustainable development and universal rights. More importantly, the stakeholder normative theory is based on the moral theories, such as Kantian and Utilitarianism. Moreover, Jamali (2008) lists two traditional CSR conceptualizations. One is Carroll’s (1979, 1991) pyramid model of CSR, and the other is Wood’s (1991) corporate social performance model. Carroll (1991) divides CSR into four hierarchies, from low to high, economic, legal, ethical, and discretionary respectively (see Figure 3). In his model, the economy is the basis of other stages. Then laws and governments are demanded to secure stakeholders’ profits. Next, corporations are responsible for acting ethically to protect their stakeholders’ interest, followed by implementing the proactive strategies to both society and firm. However, the relationship between economy and ethics cannot be simply illustrated by a hierarchical system. This model separates the economy and ethics completely though it tries to illustrate CSR based on the aspect of organizational stakeholders. On the other hand, Wood (1991) proposes corporate social performance model in the perspectives of principles, processes, and outcomes respectively. The principles include the institutional, organizational and individual, which demonstrate the legitimacy, public responsibility, and managerial discretion respectively. The processes involve the contents of environmental assessment, stakeholder management and issue management. Then, the outcomes are assessed by the aspects of social impacts, social programs, and social policies
respectively. Overall, Wood’s model advances the study of CSR in spite of the lack of accurate assessments of the corporate performance and implementation strategies.
On the other hand, Friedman (1970), an opponent of CSR, argues that the only way for companies to implement the social responsibility is to maximize the profits. Freeman and Velamuri (2006) assert corporate social responsibility has two flaws. First, it promotes the “separation thesis", which separates the business from morality entirely. Second, it only focuses on corporations. For instance, many CSR behaviors just concentrate on some special groups, such as an executive assistant, a foundation, or public relations/affairs (Freeman and Liedtka, 1991). In order to modify the separation concept of CSR, many scholars and practitioners try to illustrate CSR in the stakeholder perspective (Jamali, 2008; Maignan and Ferrell, 2004; Morsing and Schultz, 2006; McWilliams et. al, 2005; Roberts, 1992; Sen et al., 2006) and integrate the economy and ethics in the daily practice. For instance, Porter and Kramer (2002, 2007) emphasize that corporations can gain competitive advantages by integrating CSR into the core strategy. They suggest to build up an efficient and systematic CSR
strategy to the daily activities. Furthermore, Porter and Kramer (2011) demonstrate the way that organizations transfer corporate social responsibility to create social value (CSV). CSV is to build value for both society and business in an integrated strategy. To sum up, Porter and Kramer’s (1999, 2002, 2011) studies enrich the literature of CSR, and they suggest that corporate social responsibility can improve the competitive competence of a company. Also, integrating CSR behaviors into the value chain might be efficient to create value for both business and society.
2.3 Brand image
2.3.1 Customer-based brand equity
Keller (1993) put forward a model of customer-based brand equity. In this model, he ascribes brand brand awareness and brand image as the two most important elements in the brand knowledge (see Figure 4). Keller (1993) divides brand awareness into two aspects, brand recall and brand recognition respectively. Thus, brand awareness is an ability that how people to recall and identify the brand (Yoo and Donthu, 2001; Hoeffler and Keller, 2002). Brand recall refers a process of memory that a brand appears in the people’s mind, while brand recognition is a cognitive process resulting from awareness. In the view of Keller (1993), the brand awareness can affect the purchasing decisions of consumer and influence the brand associations. In addition, raising the brand awareness is required the support of advertising and other sorts of information (Hoyer and Brown, 1990). Brand image is an overall impression of a firm that reflected in the public’s mind (Nguyen and Leblanc, 2001). The vivid corporate image can derive from the name of a brand, logos, trademarks, products/services and patterns. In addition, it can be affected by the various attributes, such as quality, price, experiences, feelings and reputation. There are some advantages of the strong brand image. For example, brand image is capable of creating value and differentiating the product (or service) from other competitors (Keller, 1993; Severi and Ling, 2013). According to the research of Hutton (1997), brand image plays an important role in creating value and differentiation. His findings suggest that (1) customers would like
to pay a price premium for their favorite brand rather than a generic or an unfamiliar brand; (2) the well-known brands tended to have higher “margins”, better “referrals” and greater potential for “brand extension”. Moreover, Keller (1993) proposes that brand image is consisted of brand associations, which develops the nodes between information and brand. The information, such as the particular attribute or feature, usage situation and product spokesperson and logo (John et al., 2006), are collected and accumulated by consumers’ mind. Then, consumers organize the information network in association with the brand. Moreover, Keller (1993) depicts four types of associations, such as types, favorability, strength and uniqueness. The types refer to the attributes of product-related or non-product-related. The favorability relates to the satisfaction of consumers. The strength of brand association is about how the information can be processed and stored in the mind of consumer. The uniqueness of brand association means the differentiation among corporations. These four characteristics can interact with each other and constitute the brand image. Additionally, the brand association also plays an important role in brand extension and brand differentiation (Keller, 1993; Severi and Ling, 2013). Overall, based on the customer-based model of Keller (1993), the relationship among brand awareness, brand image and brand association are positively interactive. These three elements also closely link to the psychology of consumer and the behavior of consumption.
2.3.2 The link between CSR and brand image in a stakeholder framework
Popoli (2001, p. 426) claims "brand image is influenced by positive or negative opinions of stakeholders on the degree of social responsibility demonstrated by the company." He also states that brand image can be positively transferred by values, strategies, and competence in the premise of satisfying stakeholders’ expectation.
2.3.2.1 Consumers
Creyer (1997, p. 428) asserts that "consumers do from expectation about ethical behaviors of the firm." The findings of Lii and Lee’s (2011) research indicate that consumers have strong engagement with the CSR behavior of public services, and they tend to purchase the CSR products. McWilliams and Siegel (2001, p. 119) claim “consumer-oriented CSR may also involve intangible attributes, such as a reputation
for quality or reliability." In other words, consumers would like to purchase products with good reputation, which always associated with the high quality. On the other hand, consumers receive all kinds of information from advertising, promotion, and word of mouth. This helps consumers to grow up the image and sense of the “CSR” company.
2.3.2.2 Employees
Michaelis (2003) states companies that concern about the environment can motivate their employees, which makes the company more efficient and enriches shareholders. Knox and Freemen (2006) contend that to overcome the challenge in competitive labor markets, service-based companies should be situated themselves in a unique area so that they can attract and retain talented staffs. Moreover, a good brand image is always associated with good reputation and credibility. “Potential applicants are likely to have a different perception of the company and hold a different image based on their perception of what the organization as an employer will stand for” (Lemmink et al. 2003, p. 4). Also, the good employee image can represent the image of the company as well. Moreover, the consumers are potential recruits as well (Knox and Freemen, 2006; Lemmink et al., 2003).
2.3.2.3 Supplier
Freeman (2001, p. 43) states “supplier are vital to the success of the firm, for raw materials will determine the final product’s quality and price.” and the supplier will return the firm if it is treated as a vital member. Namely, suppliers play a major role in ensuring the daily resource supplement to the supply chain; therefore, companies should guarantee the benefits of suppliers so that they can trade in a fair process. Additionally, suppliers tend to cooperate with the reliable companies which have social responsibility and good image, so that they can improve their brand image (Jones, 2005) as well. Also, suppliers are required to accept the assessment of their products’ quality, such as resources and materials. For example, suppliers have poor
logistic management or inferior materials will cause the negative image in the mind of partners. Thus, they will lose many opportunities of cooperation and even lead to the business crisis.
2.3.2.4 Government
Government plays a critical role in regulating the market structure. The mission of government is to supervise whether the behavior of firms acting honestly, transparently or not and to be sensitive to the public opinion (Creyer, 1997). In addition, government can provide various platforms for public to develop their own business and cooperate with sponsors to support the public enterprises. For instance, the government allocates funds and offers places to encourage the self-employed. Hence, companies with the good reputation may be invited by the government to promote and carry out the extensive social activities. Meanwhile, it is a chance for companies to brand themselves. In return, firms are responsible to obey the law in order to support and maintain the stability of society.
2.3.2.5 Media
Media are able to bring strong positive or negative impacts on the brand image in the information age. Specifically, the increasing information channels influence the life of people (Lemmink et al., 2003). For instance, people can receive various information through the internet, mobile devices (such as smartphone and iPad) and newspapers. Moreover, the image of individuals and corporations can be significant affected by the media. For instance, the positive reports can enhance the brand image, while negative reports will strike a firm seriously. In addition, negative public emotions are often easily irritated by the biased reports. Therefore, companies usually suffer from the huge pressures to deal with the relationship between mass media and public consensus.
Freeman (2001) states that the company and community depend on each other interactively. For instance, community provides infrastructures and environment to support the development of companies. In return, companies proactively carry out the positive social activities, such as employment opportunities and donation. Therefore, companies should have a good relationship with the local communities.
2.4 Consumer behavior
Consumer behavior reveals the psychological characteristics and behavioral regulations of consumers in the perspective of choosing, buying, using and disposing of a product (or service) (Solomon et al., 1996). Sirgy (1982) illustrates that the consumer behavior in the aspect of self-concept. He states “the consumer will be motivated to purchase a positively valued product to maintain a positive self-image or to enhance herself by approaching an ideal image (p. 289)”. In other words, the image of the positive valued product can improve the image of its consumers. Furthermore, some studies and experiments intend to disclose the relationship between CSR and consumer behaviors. For instance, Bhattacharya and Sen (2004) state that companies should consider the CSR initiatives in order to adapt the complicated purchasing attitudes and behaviors of consumers. However, “consumers’ lack of awareness about CSR initiatives is a major limiting factor in their ability to respond to these initiatives (p. 23)”. Hence, it is necessary for consumers to improve their knowledge about CSR. On the other hand, though consumers have the positive attitude to buy the CSR products, this is still hard to be practiced because price and quality are still the important factors that influence the consumption (Oberseder et al., 2011). Hence, the managers are suggested to pay attention to high price/high-quality niches as “consumers interested in CSR also look for high-quality products (p. 457)”. In addition, the purchasing behavior of consumers will be affected by the brand image. As Farquhar (1989) states that the image means personality. This means that products (or services) are expected to be easier remembered and distinguished from the competitors. He claims “consistency of the brand’s image is part of managing the
relationship develops between the personality of a brand and the personality of the consumer with each purchase (p. 29)”. Yoon et al., (2006) states that consumers are willing to support the social responsible company and its positive image. That is, consumers expect the companies to attend the social activities and to reward them through the purchase behavior (Becler-olsen and Hill, 2006).
2.6 Model graph and hypothesis 2.6.1 Model graph
We establish the graph based on the literature review.
2.6.2 Hypothesis
According to above graph, we put forward the below hypothesis. H1a: Brand association has significant positive impact on brand image.
H1b: Brand awareness has significant positive impact on brand image.
H2a: Consumers’ purchasing behavior is significantly positively affected by brand association in the mediation of brand image.
H2b: Consumers’ purchasing behavior is significantly positively affected by brand awareness in the mediation of brand image.
H3: Consumers’ purchasing behavior is significantly positively affected by brand image in the mediation of consumers’ CSR perception.
2.7 Summary
In brief, corporate social responsibility does not have a consensus yet. It has various illustrations and suffers from the judgment of hypocrisy and advertising. Garriga and Mela (2004) summarize four groups of CSR theories, the instrumental, political, integrative and ethical. These theories are still inconsistent and have their respective emphasis. In this dissertation, we define the corporate social responsibility with the development of CSR concepts as “companies integrate social and environmental concerns in their business operations and their interaction with their stakeholders on a voluntary basis." In addition, There are two well-known models of CSR, the model of Carroll (1991) and the Wood’s (1991). Carroll’s pyramid model classifies four ranks of CSR, but it separates the economy and ethics completely. Wood’s corporate social performance model lacks of the detailed performance assessment and implementation. In additon, stakeholders are those who can affect and be affected by the business decision and strategy. Freeman’s (1984) landmark book ‘Strategic management: A stakeholder approach’ offers instructions for managers about how to manage the stakeholders in the strategy. Donaldson and Preston (1995) divide the stakeholder theory into three groups, descriptive/empirical, instrumental and normative. They emphasize that the normative core instructs the moral and philosophical decision and activity. Compared to the shareholder theory, stakeholder theory is concerned about all related groups’ interests. This suggests that companies are supposed to create
long-term value for stakeholders rather than to pursue the short-term value maximization. To conclude, stakeholder theory provides an important instruction for managers to deal with the ethical or social issues based on the stakeholders’ dimension. Hence, this can help companies balance the complicated relationship among stakeholders and avoid CSR behaviors under the shadow of hypocrisy and abstract.
On the other hand, brand image is an overall impression of a firm in the public’s mind, which is always related to visual symbols and values, such as names, packages, trademarks, and logos. A good brand image can improve a company’s competitive ability and create strong differentiation. And establishing a good brand image is also a long-term process. Hence, companies should have consistent, efficient management to prolong the life of brand and accumulate the
reputation. Also, brand image interact with brand association and brand awareness in the customer-based model (Keller, 1993). These three factors associate with the complicated psychological behavior of consumer.
3. Methodology
3.1 Research object
We choose Starbucks as the research object to study the relationship between the purchasing behavior and brand image from the perspective of consumers. First and foremost, Starbucks is one of the most well-known coffee brand in China. In the past decades, Starbucks has had a huge extension in the big and medium cities of China. Therefore, we might be easier to collect the data because a large number of Chinese respondents are familiar with Starbucks. Second, Starbucks always claims itself as a social responsible company, which supports the fair trade and contributes to local community. Hence, according to study Starbucks, we want to make sense the consumers’ perceptions of CSR and how the perception could affect the relationship between purchasing behavior and brand image.
3.2 Questionnaire
The questionnaire (see Appendix 1) has three parts. Part one is the demographic information. Part two attempts to determine general purchasing behavior and CSR perception of consumers. Part three contains seven items, the consumers’ perception and purchasing behavior of Starbucks, the Starbucks’ brand image, brand association and brand awareness. We use Likert scale of seven items, from strongly disagree (1) to strongly agree (7). This questionnaire contains seven scales. The scales are referenced from Maignan’s (2001), Mohr and Webb’s (2005), Ramasamy (2010), Welford (2004), Nguyen and Leblanc (2001), Severi and Ling (2013), Lai et al. (2010), He and Li (2011), Tong and Hawley (2009), Yoo and Donthu (2001).
3.3 Pilot test
The questionnaires have been translated from English to Chinese by the author before sending to the informants. Then, the initial questionnaires are released to 40 Chinese students in advance, in order to test the misunderstanding and distortion of the
statements. After the amendments, the formal questionnaires can be hand out and start the survey.
3.4 Data collection
We hand out the questionnaires through Wechat (the most popular social media in China) and internet to the Chinese people. We collect 237 samples finally. We pick out 219 valid samples with the valid rate of 92.4 %.
3.5 Tool
4. Result
4.1 Demographic analysis
This survey collects 90 (41.1%) male respondents and 129 (58.9%) female respondents. The majority of respondents age between 18 to 25 years old, comprising 106 (48.4%). Respondents of the 26-35 years old group are 99 (45.2%), followed by 8 (3.7 %) respondents of the 36-45 years old group and 5 (2.3%) respondents of the below 18 years old group. Only one (0.5%) respondent in the above 45 years old group. The statistics show that Starbucks is popular among young age groups. On the other hand, the Wechat and internet users are quite active in the age between 18 and 35 years old. In this study, respondents between 18 and 35 years old are the major groups.
As for the monthly income groups, the number of the respondents in the below 3000RMB group is the same as those who in the 3000-5000RMB group, comprising 66 (30.1%) respectively. The proportion of the below 3000 RMB group (30.1%) is dramatic, because a large number of respondents are still the students. The medium monthly income group (5001-7001RMB) is the second large group with 57 (26%) people, followed by the high monthly income groups, including 23 (10.5%) people of the 7001-10000RMB group and 7 (3.2%) people of the above 10000RMB group respectively.
The education level of respondents mainly focus on the group of bachelor degree with 118 (53.9%) respondents. The number of people have the master degree are similar with the people in the three years college, comprising 42 (19.2%) and 43 (19.6%) respectively. There are 13 (5.9%) respondents are still the high school students. Three (1.4%) respondents have the doctorate degree.
Most of the respondents study or work in the southern China. There are 128 (58.4%) respondents live in the Guangdong province. Others (41.6%) live in other area of China (east China, north China, central China and west-north China).
4.2 Reliability analysis
Reliability test is to measure the consistency and stability of the survey’s scales. The value of Cronbach alpha is a well-known measurement to test the reliability of the scales. Cronbach (1970) states that the value of Cronbach alpha should be greater than 0.7. As it can be seen, table 3 shows the statistics of the reliability test. All of the nine scales’ Cronbach alpha value are greater than 0.7, this suggest the scales has high reliability.
4.3 Validity analysis
Validity analysis can test the accuracy of how an instrument measures an object. Kaiser-Mayer-Olkin (KMO) test and Bartlett’s test are for the test of the validity. Kaiser (1974) states that the value of KMO test should be higher than 0.6 (Table 4). In addition, the value of Bartlett’s test should be less than or equal to 0.01. As for the factor analysis, we apply the principle components analysis (PCA) and varimax rotation.
We can see the following results clearly, all the scales’ KMO value are higher than 0.8 and the Bartlett’s test of all the scales are significant (0.000 < 0.01). This suggests that the scales are appropriate for factor analysis.
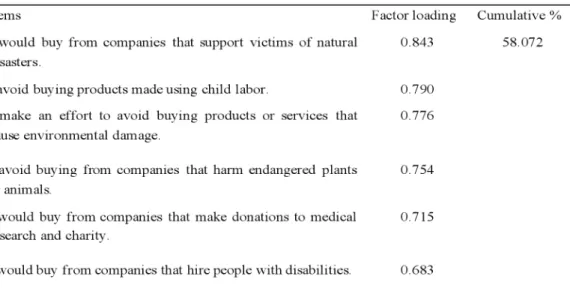
4.3.1 General consumers’ purchasing behavior of CSR scale (GPB)
We adopt the six items of Maignan’s (2001) scale to measure the general consumers’ purchasing behavior. The KMO value is 0.816 and the significant level of Bartlett’s test is 0.000 (<0.01), which is appropriate for factor analysis.
Table 5 shows that this scale extracts only one component, factors loading are all higher than 0.5, the cumulative percentage is 58.072%.
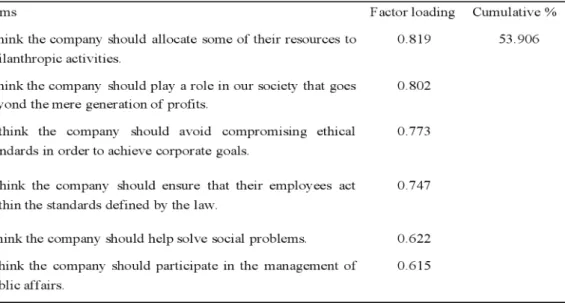
4.3.2 General consumers’ perception of CSR scale(GCP)
We adopt the six items of Mohr and Webb’s (2005) scale to measure the general consumers’ perception of CSR. The KMO value is 0.835 and the significant level of Bartlett’s test is 0.000 (<0.01), which is appropriate for factor analysis.
Table 7 shows that this scale extracts only one component, factors loading are all higher than 0.5, the cumulative percentage is 53.906%.
4.3.3 Consumers’ purchasing behavior of Starbucks scale (CPB)
We adopt the six items of Ramasamy (2010) scale to measure the consumers’ purchasing behavior of Starbucks. The KMO value is 0.877 and the significant level of Bartlett’s test is 0.000 (<0.01), which is appropriate for factor analysis.
Table 9 shows this scale only has one component, factors loading are all higher than 0.5, the cumulative percentage is 69.087%.
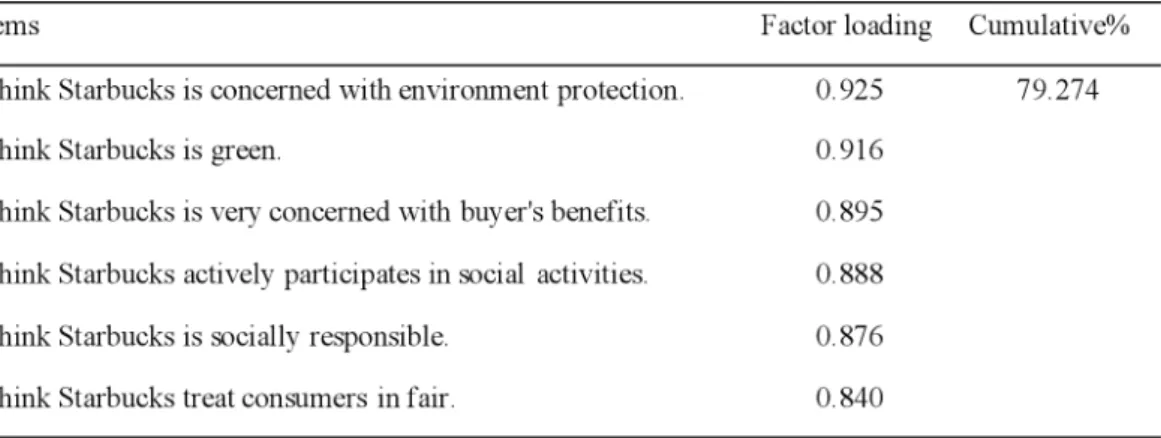
4.3.4 Consumers’ CSR perception of Starbucks scale (CP)
We adopt the six items of Welford (2004), He and Li (2011) and Lai et al. (2010) to measure the consumers’ perception of CSR. The KMO value is 0.921 and the significant level of Bartlett’s test is 0.000 (<0.01), which is pretty good for factor analysis.
Table 11 shows that this scale only has one component, factors loading are all higher than 0.5, the cumulative percentage is 79.274%.
4.3.5 Brand image scale
We adopt the five items of Nguyen and Leblanc (2001), Severi and Ling (2013), and Tong and Hawley (2009) to measure the brand image. The KMO value is 0.905 and the significant level of Bartlett’s test is 0.000 (<0.01), which is pretty good for factor analysis.
Table 13 shows that this scale only has one component, factors loading are all higher than 0.5, the cumulative percentage is 80.523%.
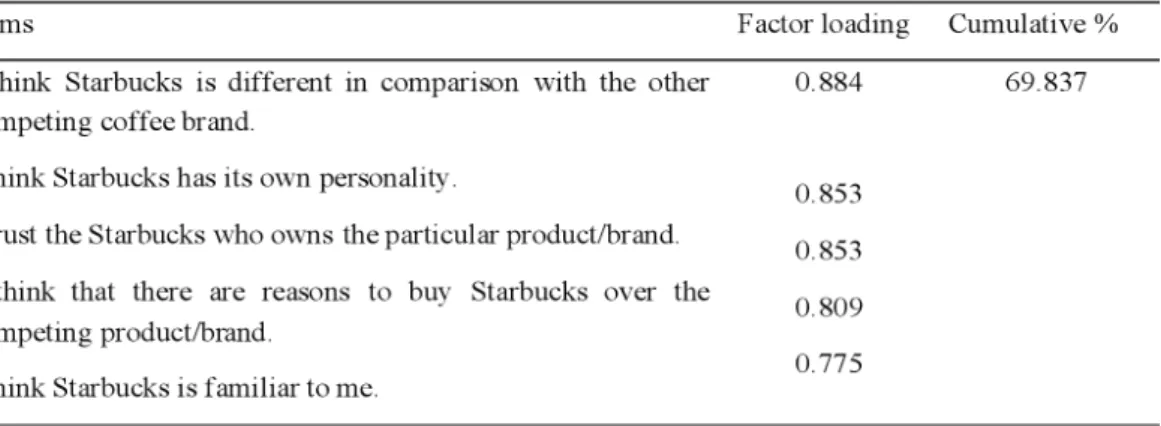
4.3.6 Brand association scale
We adopt the five items of Severi and Ling (2013) to measure the brand association. The KMO value is 0.834 and the significant level of Bartlett’s test is 0.000 (<0.01), which is appropriate for factor analysis.
Table 15 shows that this scale only has one component, factors loading are all higher than 0.5, the cumulative percentage is 69.837%
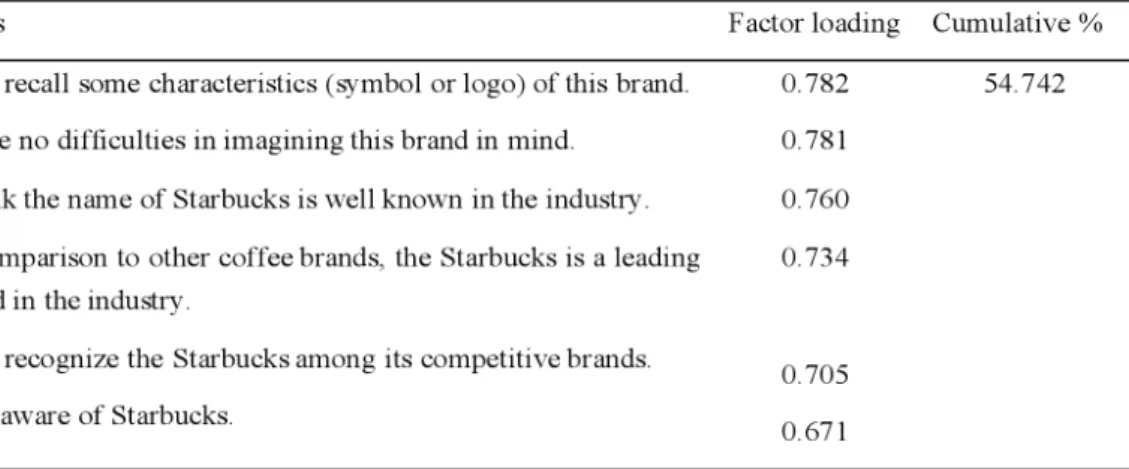
4.3.7 Brand awareness scale
We adopt the six items of Yoo and Donthu (2001) and Lai et al. (2010) to measure the brand awareness. The KMO value is 0.815 and the significant level of Bartlett’s test is 0.000 (<0.01), which is appropriate for factor analysis.
Table 17 shows that this scale extracts only one component, factors loading are all higher than 0.5, the cumulative percentage is 54.742%.
4.4 Correlation analysis
Correlation analysis studies the regulation and correlation among the random variables. We use Pearson coefficient, if the Pearson coefficient is greater than 0.1, the variables have correlation relationship. According to the below statistics (see table 18), all the Pearson coefficient are greater than 0.1. The significant level of correlation test are 0.000 (<0.01). The Person coefficient of brand image and brand association (0.825), CSR perception and brand image (0.793), CSR perception and association (0.755), CSR perception and CSR purchasing behavior (0.750) are greater than 0.7 This suggests that they have strong positive correlation respectively. However, the Person coefficient of brand awareness and CSR perception, CSR purchasing behavior are 0.387 and 0.372 respectively. That is, there is a week correlation relationship between brand awareness and CSR perception, brand awareness and CSR purchasing behavior respectively.
Table 18 Correlations Coefficients brand awareness brand association brand image consumer perception purchasing behavior brand awareness Pearson Correlation 1 Sig. (2-tailed) brand association Pearson Correlation .520** 1 Sig. (2-tailed) .000
brand image Pearson
Correlation .545** .825** 1 Sig. (2-tailed) .000 .000 consumer perception Pearson Correlation .387** .755** .793** 1 Sig. (2-tailed) .000 .000 .000 purchasing behavior Pearson Correlation .372** .666** .640** .750** 1 Sig. (2-tailed) .000 .000 .000 .000
**. Correlation is significant at the 0.01 level (2-tailed). N=219
4.5 Regression analysis and hypothesis I
We can see it clearly from table 19 that all the regressions reach the significant level (sig.=0.000<0.01). H1a and H1b are supported in the the liner regression tests.
Table 19 Results of linear regression Statistics (H1a, H1b, H1c, H1d) Coefficientsa Model Unstandardized Coefficients Standardized Coefficients t Sig. B Std. Error Beta 1 (Constant) .842 .216 3.893 .000 brand association .852 .040 .825 21.531 .000 1 (Constant) .331 .533 .621 .535 Brand awareness .830 .087 .545 9.586 .000
a. Dependent Variable: brand image
4.6 Structural equation modeling analysis 4.6.1 Mediation effect
Baron and Kenny (1986, p. 1176) demonstrate that a variable can be regarded as a mediator should satisfy the following conditions (see Figure 6), (1) the independent variable significantly affect the mediator (Path a); (2) the mediator significantly affect the dependent variable (Path b); (3) when path a and path b are controlled, a previously significant relationship between independent and dependent variables is no longer significant. Judd and Kenny (1981) state if the independent variable X no longer affects dependent variable Y after M has been controlled and path c is reduced to zero, which is called the complete mediation. If Path c is reduced but not reduced to zero in the control of mediator, this case is the partial mediation.
We apply AMOS 21 to test the mediation effect. First, each model should pass the normal testing and match the normal distribution. Kline (1998) states that the maximum skew absolute value of each measuring variable should be less than 3 while the maximum kurtosis absolute value of each measuring variable should be less than 10. Then, we have to measure whether the model is fit or not in the assessment of the indexes (GFI, RMSEA, PNFI, PGFI, NFI and CFI). Finally, we use bias-corrected percentile method in the observation of the confidence interval (independent variable → dependent variable). The mediation effect should fulfill three condition, (1) the confidence interval of total effect should not contains zero, otherwise the model is invalid; (2) the confidence interval of indirect effect should not contains zero, otherwise there is no mediation effect; (3) if the former two conditions fulfill, there are two situation of the direct effect. If the confidence interval of direct effect does not contains zero, there is partial mediation effect. If it contains zero, there is complete mediation effect.
4.6.2 Hypothesis II
H2a: Consumers’ purchasing behavior is significantly positively affected by brand association in the mediation of brand image.
Figure 7 shows the structural equation model of H2a. In this model, the maximum skew absolute value of each variable is 1.040<3, the maximum kurtosis absolute
value is 1.186<10. This model obeys normal distribution and is appropriate for structural equation modeling.
Figure 7 Structural Equation Model 1 (H2a)
Table 20 shows the model fit summary of structural equation model 1 (H2a), the value of chi-square/df (2.7), GFI (0.848), PNFI (0.767), PGFI (0.630), NFI (0.911) and CFI (0.942) all reach the critical value and reference value respectively. Though the value of RMSEA is a little bit higher than the the reference value (RMSEA=0.088>0.08), the overall fitting condition of the model is still good.
Table 20 Model Fit Summary of Mediation Model (H2a)
Chi-square/df GFI RMSEA PNFI PGFI NFI CFI Reference value <3 >0.9 <0.08 >0.5 >0.5 >0.9 >0.9 Critical value >0.8 >0.8 >0.8 2.7 0.848 0.088 0.767 0.630 0.911 0.942
Table 21 displays the result of mediation effect (H2a) based on the confidence interval of three effect tests. The confidence interval of total effect [0.608, 0.983] and direct effect [0.047, 1.030] are valid, which do not include zero. However, the confidence interval of indirect effect [-0.246, 0.983] contains zero. This suggests that there is no mediation effect in this model. That is, brand image does not act as a mediator in mediating the relationship between brand association and purchasing behavior. H2a is rejected.
Table 21 Confidence Interval of Mediation effect (H2a)
Brand association → purchasing behavior Lower bounds Upper bounds
Total effect 0.608 0.983
Indirect effect -0.246 0.703
Direct effect 0.047 1.030
H2b: Consumers’ purchasing behavior is significantly positively affected by brand awareness in the mediation of brand image.
Figure 8 shows the structural equation model of H2b. In this model, the maximum skew absolute value of each variable is 2.2 <3, the maximum kurtosis absolute value is 4.769 <10. This model obey normal distribution and is appropriate for structural equation modeling.
Figure 8 Structural Equation Model 2 (H2b)
Table 22 shows the model fit summary of the structural equation model 2 (H2b), the value of chi-square/df (2.4), GFI (0.868), PNFI (0.767), PGFI (0.658), NFI (0.900) and CFI (0.939) all reach the critical value and reference value respectively. The value of RMSEA is lower than the reference value as it is required (RMSEA=0.079<0.08). Thus, the overall fitting condition of the model is rather good.
Table 22 Model Fit Summary of Mediation model (H2b)
Chi-square/df GFI RMSEA PNFI PGFI NFI CFI Reference value <3 >0.9 <0.08 >0.5 >0.5 >0.9 >0.9 Critical value >0.8 >0.8 >0.8 2.4 0.868 0.079 0.767 0.658 0.900 0.939
interval of three effect tests. The confidence interval of total effect [0.452, 1.283] is valid, which does not include zero. The confidence interval of indirect effect is from 0.406 to 1.384 and this proves that there is mediation effect in this model. The confidence interval of direct effect [-0.440, 0.481] comprises zero. Thus, brand image act as a complete mediator in mediating the relationship between brand awareness and purchasing behavior. That is, brand awareness affects consumers’ purchasing behavior completely through brand image. H2b is supported.
Table 23 Confidence Interval of Mediation effect (H2b)
Brand awareness →purchasing behavior Lower bounds Upper bounds
Total effect 0.452 1.283
Indirect effect 0.406 1.384
Direct effect -0.440 0.481
4.6.3 Hypothesis III
H3: Consumers’ purchasing behavior is significantly positively affected by brand image in the mediation of consumers’ CSR perception.
Figure 9 shows the structural equation model of H3. In this model, the maximum skew absolute value of each variable is 1.027 <3, the maximum kurtosis absolute value is 1.051 <10. This model obey normal distribution and is appropriate for structural equation modeling.
Figure 9 Structural Equation Model 3 (H3)
Table 24 shows the model fit summary of the structural equation model 3 (H3), the value of chi-square/df (1.9), GFI (0.889), PNFI (0.801), PGFI (0.674), NFI (0.939) and CFI (0.969) all reach the critical value and reference value respectively. The value of RMSEA is lower than the reference value as it is required (RMSEA=0.066<0.08). Thus, the overall fitting condition of the model is rather good.
Table 24 Model Fit Summary of Mediation model (H3)
Chi-square/df GFI RMSEA PNFI PGFI NFI CFI Reference value <3 >0.9 <0.08 >0.5 >0.5 >0.9 >0.9 Critical value >0.8 >0.8 >0.8 1.9 0.889 0.066 0.801 0.674 0.939 0.969
of three effect tests. The confidence interval of total effect [0.567, 0.971] is valid, which does not include zero. The confidence interval of indirect effect is from 0.447 to 1.025 and this proves that there is mediation effect in this model. The confidence interval of direct effect [-0.322, 0.436] comprise zero. Thus, consumer perception act as a complete mediator in mediating the relationship between brand image and purchasing behavior. That is, brand image affects consumers’ purchasing behavior completely through consumer perception. H3 is supported.
Table 25 Confidence Interval of Mediation effect (H3)
Brand image → purchasing behavior Lower bounds Upper bounds
Total effect 0.567 0.971
Indirect effect 0.447 1.025
Direct effect -0.322 0.436
4.6.4 Hypotheses summary and mediation effect models
According to above analysis, table 26 shows the summary of the hypotheses. Table 26 Summary of Hypotheses Results
Hypotheses Rejected/Not Rejected
H1a: Brand association has significant positive impact on brand image. H1b: Brand awareness has significant positive impact on brand image. H2a: Consumers’ purchasing behavior is significantly positively affected by brand association in the mediation of brand image.
H2b: Consumers’ purchasing behavior is significantly positively affected by brand awareness in the mediation of brand image.
H3: Consumers’ purchasing behavior is significantly positively affected by brand image in the mediation of consumers’ CSR perception.
Not rejected Not rejected Rejected
Not rejected (complete mediation) Not rejected (complete
Based on the summary of the hypotheses, we establish the following mediated models. Figure 10 illustrates that brand image acts as a complete mediator in mediating the relationship between brand awareness and purchasing behavior.
Figure 11 shows that consumer perception acts as a complete mediator in mediating the relationship between brand image and purchasing behavior.
4.7 Multiple response analysis
Table 27 clearly shows the frequencies of nine options that respondents choose Starbucks respectively. We pick up three best choices. The “good dining environment” is the most important reason that people choose Starbucks, comprising 145 (25.3%) votes. The second popular choice is the “good quality”, which is elected by 106 (18.5%) respondents. Also, 96 (16.8%) respondents choose the “friendly service” (third popular choice). Other items’ responses are all under 70.
Table 27 Reasons that Respondents Choose Starbucks Responses Percent of Cases N Percent reasonable price good quality friendly service loyalty
good dining environment excellent location high class
pretty product appearance (cup design) others 33 5.8% 15.1% 106 18.5% 48.4% 96 16.8% 43.8% 34 5.9% 15.5% 145 25.3% 66.2% 51 8.9% 23.3% 30 5.2% 13.7% 66 11.5% 30.1% 11 1.9% 5.0% Total 572 100.0% 261.2% 4.8 Variance analysis
The variance analysis is to test whether the different demographic features (gender, age, monthly income and education level) would have significant difference with the general consumers’ CSR purchasing behavior (GPB) and CSR perception (GCP) or not.
Table 28 shows that the means of gender are similar, the F test suggests that gender does not have the significant difference with general consumers’ CSR purchasing behavior and CSR perception.
Table 28 Variance Analysis of Gender and GPB and GCP
Variables Mean F Sig. Male Female GPB 5.75 5.93 1.998 0.159 GCP 5.91 5.86 0.322 0.571
Table 29 shows that the means of the age groups are similar in addition to the group of over 45 years old. Because this group only has one respondents that we can ignore it. The F test suggests that age does not have the significant difference with general consumers’ CSR purchasing behavior and CSR perception.
Table 30 shows that the means of the monthly income groups are similar, the F test suggests that monthly income does not have the significant difference with general consumers’ CSR purchasing behavior and CSR perception.
Table 30 Variance Analysis of Monthly Income and GPB and GCP
Table 31 shows that the means of the education groups are similar, the F test suggests that education level does not have the significant difference with general consumers’ CSR purchasing behavior and CSR perception.
Table 31 Variance Analysis of Education Level and GPB and GCP
Variables Mean F Sig. <3000 3000-5000 5001-7000 7001-10000 >10000 GPB 5.94 5.96 5.64 5.80 6.17 1.298 0.272 GCP 6.01 5.97 5.65 5.85 5.86 1.847 0.121 Variables Mean F Sig. High school and below Three years college Bachelor degree Master degree Doctor degree GPB 5.58 5.95 5.83 5.94 6.11 0.550 0.699 GCP 5.73 6.03 5.87 5.79 5.89 0.630 0.641
5. Conclusion
5.1 Discussion and conclusion
To summarize, we starts the literature review by stakeholder theory in order to support the corporate social responsibility in the aspect of stakeholder. Although the definition of CSR still lack of a consensus, we try to understand and study the CSR in the perspective of consumers’ perception and purchasing behavior. In addition, we intent to study the relationship between brand image and CSR. And we also add two factors, brand association and brand awareness to study how these factors could impact brand image. We have not found any model or article that have exploratory or developing studies about the relationship between CSR purchasing behavior and brand image. Therefore, this dissertation might provide an idea for the future studies. In this dissertation, we establish a model and develop three hypotheses based on the literature review. From the test of hypothesis I, each of the sub-hypothesis (H1a, H1b) is not rejected. That is, brand image are significant positive impacted by brand association and brand awareness respectively. This suggests that brand image might have close positive interaction with brand association and brand awareness as many researchers have studied (Nguyen and Leblanc, 2001; Serveri and Ling, 2013; Tong and Hawley, 2009; Yoo and Donthu, 2001; Lai et. al., 2010). More importantly, considering these research factors are closely related to consumer psychology and management, we decide to mainly study the mediation effect in order to find the potential relationships among these elements. Hence, in the hypothesis 2, we have two sub-hypotheses. We assume brand image as a mediator and study how it influence the relationship between CSR purchasing behavior and brand association, CSR purchasing behavior and brand awareness respectively. Interestingly, we only find that brand image plays as a complete mediator in mediating the relationship between brand awareness and CSR purchasing behavior (H2b is not rejected). That is, brand awareness affected CSR purchasing behavior completely directly through brand image. As the literature indicates, brand awareness can help people recall and
recognize the brand in the process of all kinds of information (Keller, 1993;Yoo and Donthu, 2001; Hoeffler and Keller, 2002). Brand image also can be regarded as the outcome of the organized information. Therefore, it is possible for brand image to be a complete mediator to influence the relationship between brand awareness and CSR purchasing behavior. In addition, brand image does not play any mediation effect in the relationship between brand association and CSR purchasing behavior (H2a is rejected) in this study. Maybe we need to use another method to test the mediation effect or there is another possibility that brand image plays in the relationship between brand association and CSR purchasing behavior. For instance, brand image might be able to play as a moderate or control variable in affecting the relationship of this model.
In addition, in hypothesis 3, we assume consumers’ CSR perception as a mediator and study how it affects the relationship between brand image and CSR purchasing behavior. And we find that consumers’ CSR perception plays as a complete mediator in mediating the relationship between brand image and CSR purchasing behavior. Namely, brand image affect the purchasing behavior completely directly through consumers’ CSR perception. This implies that companies with CSR behavior and initiative might help to establish a good brand image, which further help consumers raise the positive perception of CSR and reward those companies through purchasing behavior (Becler-olsen and Hill, 2006). As for the reasons that people choose Starbucks, we find that the top three choices are the good dining environment, good quality and friendly service, which are ranged orderly. This suggests that these three factors are helpful to create and enhance the brand image. Furthermore, we study the general consumers’ CSR perception and purchasing behavior in the aspect of demographics (gender, age, monthly income and education). However, we do not find any significant difference among these variables in the research. The concept of corporate social responsibility might be just in the beginning stage, which requires further research and theory development in the Chinese academic field. Thus, CSR perception might still have not been popularized to the general consumers.
5.2 Limitation
First, we only choose Starbucks as the research object and this case might not be typical enough to reflect the general CSR perception and CSR purchasing behavior of consumers. Moreover, different industries might have different situations and responses. For example, people might be concerned more about the CSR behavior of those industries that can cause the heavy pollution. Second, because of the limited structure, we do not go deep in the research of other factors, such as brand reputation and brand loyalty, which might probably influence the relationship between CSR purchasing behavior and brand image. Third, people living in the different culture and environment might cause the inevitable bias in the perception of CSR concepts. The respondents of this study are Chinese people. And the concept of CSR in China just situates in the developing phase so that it might have the weak influence and abstract image in the mind of Chinese consumers.
5.3 Further research
This study finds the mediation effect among the brand image, CSR perception and CSR purchasing behavior in the perspective of consumer. We believe that there might be other important factors could play a key role as a mediator in mediating the relationship between brand image and CSR purchasing behavior as CSR perception did. In addition, this study might provide an idea for studying the relationship between other stakeholders and CSR in the future study.
Reference
Aaker, D.A., 1996. Measuring brand equity across products and markets. California
management review, 38(3): 102-120.
Aaker, J.L., 1997. Dimensions of brand personality. Journal of marketing research, : 347-356.
Baek, S.H., Ham, S. and Yang, I.S., 2006. A cross-cultural comparison of fast food restaurant selection criteria between Korean and Filipino college students.
International Journal of Hospitality Management, 25(4): 683-698.
Baldinger, A.L. and Rubinson, J., 1996. Brand loyalty: the link between attitude and behavior. Journal of advertising research, 36(6): 22-35.
Baron, R.M. and Kenny, D.A., 1986. The moderator–mediator variable distinction in social psychological research: Conceptual, strategic, and statistical considerations.
Journal of personality and social psychology, 51(6): 1173.
Becker-Olsen, K.L., Cudmore, B.A. and Hill, R.P., 2006. The impact of perceived corporate social responsibility on consumer behavior. Journal of business research, 59(1): 46-53.
Bhattacharya, C.B. and Sen, S., 2003. Consumer-company identification: A framework for understanding consumers’ relationships with companies. Journal of
marketing, 67(2): 76-88.
Bhattacharya, C.B. and Sen, S., 2004. Doing better at doing good: When, why, and how consumers respond to corporate social initiatives. California management
review, 47(1): 9-24.
Bronn, P.S. and Vrioni, A.B., 2001. Corporate social responsibility and cause-related marketing: an overview. International journal of Advertising, 20(2): 207-222.
Bruhn-Hansen, S., 2012. Corporate Social Responsibility–A case study of Starbucks’
CSR: communication through its corporate website. Unpublished master’s thesis,
Illinois State University. Retrieved from http://pure. au. dk/portal/files/45282206/ba_thesis. pdf.
Campbell, J.L., 2007. Why would corporations behave in socially responsible ways? An institutional theory of corporate social responsibility. Academy of management
Review, 32(3): 946-967.
Campbell, M.C., 2002. Building brand equity. Journal of Medical Marketing, 2(3): 208.
Castaldo, S., Perrini, F., Misani, N. and Tencati, A., 2009. The missing link between corporate social responsibility and consumer trust: The
Chaudhuri, A. and Holbrook, M.B., 2001. The chain of effects from brand trust and brand affect to brand performance: the role of brand loyalty. Journal of marketing, 65(2): 81-93.
Creyer, E.H., 1997. The influence of firm behavior on purchase intention: do consumers really care about business ethics?. Journal of consumer Marketing, 14(6): 421-432.
Cronbach, L.J. and Thornton, G.C., 1970. Test items to accompany Essentials of Psychological Testing. Harper & Row.
Delgado-Ballester, E. and Luis Munuera-Alemn, J., 2001. Brand trust in the context of consumer loyalty. European Journal of marketing, 35(11/12): 1238-1258.
Dobni, D. and Zinkhan, G.M., 1990. In search of brand image: A foundation analysis.
NA-Advances in Consumer Research Volume 17.
Donaldson, T. and Preston, L.E., 1995. The stakeholder theory of the corporation: Concepts, evidence, and implications. Academy of management Review, 20(1): 65-91.
Farquhar, P.H., 1989. Managing brand equity. Marketing research, 1(3).
Freeman, R.E. and Evan, W.M., 1990. Corporate governance: A stakeholder interpretation. Journal of behavioral economics, 19(4): 337-359.
Freeman, R.E. and Liedtka, J., 1991. Corporate social responsibility: A critical approach. Business Horizons, 34(4): 92-98.
Freeman, R.E. and McVea, J., 2001. A stakeholder approach to strategic management. Freeman, R.E. and Reed, D.L., 1983. Stockholders and stakeholders: A new perspective on corporate governance. California management review, 25(3): 88-106. Freeman, R.E., 1994. The politics of stakeholder theory: Some future directions.
Business ethics quarterly, 4(4): 409-421.
Freeman, R.E., 1999. Divergent stakeholder theory. Academy of management review, 24(2): 233-236.
Freeman, R.E., 2001. A stakeholder theory of the modern corporation. Perspectives in
Business Ethics Sie, 3: 144.
Freeman, R.E., 2010. Strategic management: A stakeholder approach. Cambridge University Press.
Freeman, R.E., Wicks, A.C. and Parmar, B., 2004. Stakeholder theory and “the corporate objective revisited”. Organization science, 15(3): 364-369.
Gao, Y., 2009. Corporate social performance in China: Evidence from large companies. Journal of Business Ethics, 89(1): 23-35.
Garriga, E. and Mel, D., 2004. Corporate social responsibility theories: Mapping the territory. Journal of business ethics, 53(1-2): 51-71.