358 Radiol Bras. 2018 Nov/Dez;51(6):358–365
Value of ultrasound in the anatomical evaluation of the brachial
plexus: correlation with magnetic resonance imaging
Valor da ultrassonografia na avaliação anatômica do plexo braquial por meio da correlação com estudo por ressonância magnética
Wanda Chiyoko Iwakami Caldana1,a, Sergio Keidi Kodaira1,b, Conrado Furtado de Albuquerque Cavalcanti1,
Marcelo Bordalo Rodrigues1,c, Osmar de Cassio Saito1, Carlos Alberto Buchpiguel1,d
1. Instituto de Radiologia do Hospital das Clínicas da Faculdade de Medicina da Universidade de São Paulo (InRad/HC-FMUSP), São Paulo, SP, Brazil.
Correspondence: Dra. Wanda Chiyoko Iwakami Caldana. Rua Cincinato Braga, 282, Bela Vista. São Paulo, SP, Brazil, 01333-910. Email: wicaldana@gmail.com.
a. https://orcid.org/0000-0003-4088-5280; b. https://orcid.org/0000-0002-2583-4031; c. https://orcid.org/0000-0003-4747-5081; d. https://orcid.org/0000-0003-0956-2790.
Received 18 May 2017. Accepted after revision 21 November 2017.
How to cite this article:
Caldana WCI, Kodaira SK, Cavalcanti CFA, Rodrigues MB, Saito OC, Buchpiguel CA. Value of ultrasound in the anatomical evaluation of the brachial plexus: correlation with magnetic resonance imaging. Radiol Bras. 2018 Nov/Dez;51(6):358–365.
Abstract
Resumo
Objective: To assess the accuracy of ultrasound in the visualization of the brachial plexus and to determine the value of the method in comparison with that of magnetic resonance imaging (MRI).
Materials and Methods: This was an anatomical study of the brachial plexuses of 20 asymptomatic adults (40 plexuses), compar-ing ultrasound and MRI in terms of their accuracy. In the ultrasound study, a high-frequency linear transducer was used, and a neu-rovascular coil was used in the MRI study. To estimate the frequency of visualization, the brachial plexus was divided into segments.
Results: The cervical nerve roots, the upper trunk, and the middle trunk were the segments that were best visualized on ultrasound. On MRI, the degree of visualization was excellent for most of the segments. In the comparison between ultrasound and MRI, the C6, C7, upper trunk, and middle trunk segments showed equivalent degrees of visualization, with a high level of agreement between the two methods.
Conclusion: In the brachial plexus, ultrasound can be used in the assessment of the cervical nerve roots, as well as of the upper and middle trunks, although it provides limited visualization of the remaining segments. Ultrasound and MRI showed a high level of agreement for the visualization of the C6, C7, and middle trunk segments.
Keywords: Brachial plexus/anatomy & histology; Ultrasonography; Magnetic resonance imaging.
Objetivo: Avaliar a eficácia do exame de ultrassonografia (US) na visualização do plexo braquial e avaliar o método comparativa -mente à ressonância magnética (RM).
Materiais e Métodos: Estudo da anatomia do plexo braquial pela US e RM (40 plexos braquiais) em 20 adultos assintomáticos. No estudo por US foi utilizado transdutor linear de alta frequência e na RM de alto campo magnético foi utilizada bobina neurovascular. O plexo braquial foi dividido em segmentos para estimar a frequência da visualização entre a US e a RM.
Resultados: As raízes cervicais e os troncos superior e médio foram as estruturas que apresentaram maior grau de visualiza -ção pela US. Na RM, a maioria dos segmentos do plexo apresentou excelente grau de visualiza-ção. Na análise da equivalência entre a US e a RM, as raízes de C5, C6, tronco superior e médio apresentaram graus de visualização equivalentes, com alta concordância.
Conclusão: O método de US consegue avaliar de forma eficaz o segmento proximal do plexo braquial que compreende as saídas das raízes cervicais de C5, C6 e C7, assim como os troncos superior e médio na região lateral do pescoço. O exame de US mostrou ter alta concordância com a RM nos ramos ventrais cervicais de C6, C7 e o tronco médio bilateral.
Unitermos: Plexo braquial/anatomia & histologia; Ultrassonografia; Ressonância magnética.
region (which comprises the interscalene triangle, costo-clavicular space, and retropectoralis minor space), they unite or split to form the trunks, divisions, and cords of the plexus(1). The peripheral nerves of the upper limbs originate from the division of the cords. The brachial plexus is located in the same region as the thoracic and axillary structures, which include the subclavian vessels, INTRODUCTION
The brachial plexus is a network of nerve structures responsible for motor and sensory innervation of the up-per limb. It is composed of the ventral branches of the C5–T1 nerve roots, which originate in the posterolateral region of the neck and pass through the intervertebral fo-ramina; as they pass through the lateral cervicothoracic
as well as the musculature and bony framework and of the cervical and thoracic regions, together with fat and the pulmonary apex, constituting a complex internal anat-omy, which makes it a challenge to perform appropriate imaging studies of this region(2).
The main conditions that affect the structures of the thoracic gorge, resulting in neuromotor and vascular disorders, are as follows: traumatic plexopathy (caused by dystocia in neonates and by motorcycle accidents in adults); compressive plexopathy along the neurovascular
pathway, caused by tumors; anatomical variations or fi
-brotic bands; and plexopathies caused by tumor infiltra -tion or radiotherapy. Imaging methods are of fundamental importance as complementary diagnostic tools, not only for identifying the location of an injury affecting the
bra-chial plexus but also for defining its characteristics(2). Despite its cost, magnetic resonance imaging (MRI) is considered one of the best imaging methods for assess-ing the brachial plexus. It has the advantages of beassess-ing a noninvasive method that does not involve the use of ionizing radiation, as well as being able to show anatomi-cal features in greater detail, because of its multiplanar acquisition and the high degree of contrast it creates be-tween different tissue types(3–5). However, MRI does have some limitations, such as the considerable time required for image acquisition and the occasional use of paramag-netic contrast (gadolinium), as well as restrictions pre-sented by patients, such as claustrophobia or metal im-plants, all of which impair the quality and impede the analysis of the images acquired(2,3).
Ultrasound of the brachial plexus was first employed
as an auxiliary method for procedures involving nerve block anesthesia. Recent studies have demonstrated that
ultrasound is sufficiently accurate in identifying the cer -vical roots that make up the brachial plexus, mainly by allowing visualization of the path the roots take as they merge to form the trunks in the interscalene space. In comparison with MRI, ultrasound has the advantage of being a more rapid method and is equally non-invasive. Unlike MRI, it is widely available, is affordable, and has no contraindications. Ultrasound can be used dynamically, enabling provocative maneuvers that are of fundamental importance in thoracic outlet syndrome, as opposed to MRI, which requires the patient to be in a static position, with limited space for changing the position of the arms. Therefore, ultrasound is an additional imaging method that may contribute to the characterization of changes that affect the brachial plexus, although there is as yet
insufficient evidence of its value(6–9).
The limited knowledge and underuse of brachial plexus ultrasound prompted our interest in developing this study. Our objective was to assess the effectiveness of ultrasound in plexus visualization, as well as its value in comparison with MRI.
MATERIALS AND METHODS
This was a comparative study of ultrasound and MRI, studying the anatomy of the right and left brachial plex-uses of 20 volunteers. For inclusion in the study, the cri-teria were being conscious, being collaborative, and being over 18 years of age. We excluded individuals in whom MRI examination was contraindicated, as well as those with a history of alterations or symptoms related to the brachial plexus. The study group was composed of 10 men and 10 women between 33 and 68 years of age (mean age, 47.2 years). The ultrasound study was conducted with a Acuson Antares Premium Edition ultrasound system (Siemens Medical Solutions, Erlangen, Germany) with a linear transducer (5–13 mHz), and the MRI study was conducted with a 1.5 T Signa Excite HDX scanner (GE Healthcare, Chicago, IL, USA) using a neurovascular coil.
The ultrasound examinations of the region extending from the extraforaminal nerve roots up to the interscalene space were executed with the patient lying down, with the neck in a neutral position and slightly bent toward the contralateral side. The visualization of that trajectory and the components of the brachial plexus was approached as described below.
Roots from C5 to C8 – In the anterior region of the neck, we positioned the transducer in the longitudinal direction, parallel to the body axis, with a slight inclina-tion of the upper border to the posterior region (coronal oblique). The visualization of the cervical roots began
from C5 to T1, with the identification of the first rib. The
passage of the subclavian artery over the rib was used as an anatomical reference. In this region, we were able to
visualize the C8 root, the first root that is situated above
the rib. From that reference point, we located all the roots that emerge from the intervertebral foramina (the C5, C6, and C7 roots), which were subsequently counted and
identified, from the bottom up (Figure 1).
As a complement to and aid for the identification of
roots, we used the morphology of the anterior and posterior tubercle of the transverse processes of the cervical verte-brae. For the characterization of the C6 root, we looked for the anterior and posterior tubercle of the transverse process, which are similar in height and morphology
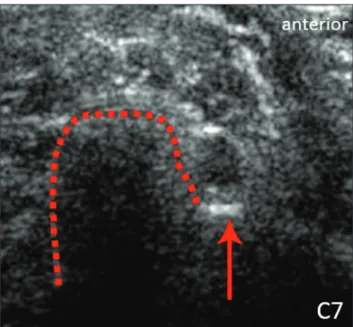
(Fig-ure 2). The C7 root is identified in the transverse process
region, where the posterior tubercle is the only prominent feature (Figure 3). After identifying the C6 root, we kept the transducer in the transverse plane and moved it up-ward until we reached the anterior and posterior tubercle of the C5 transverse process, which are closer than are those of the C6 transverse process (Figure 4).
Figure 3. Ultrasound in the transverse plane, showing the C7 root (arrow) and the posterior transverse process (red line).
Figure 4. Ultrasound in the transverse plane, showing the C5 root (arrow), anterior tubercles (yellow line) and posterior tubercles (red line).
Figure 1. Ultrasound in the longitudinal plane, showing the C5–C8 roots.
Figure 2. Ultrasound showing the C6 root (arrow), as well as the anterior and posterior tubercles of the transverse process (in yellow and red, respectively).
plane. After the muscles had been identified, we switched
the axis of the transducer to the transverse direction, bringing it perpendicular to the neck, which allowed us to
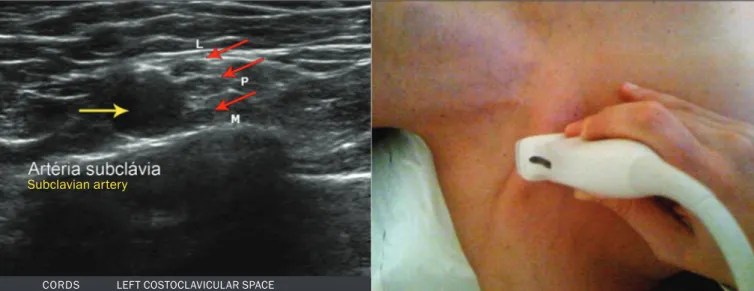
Transition between the interscalene and costocla-vicular spaces – With the transducer transverse to the shoulder axis, we visualized the divisions of the trunks in the supraclavicular region, our reference being the mid-dle-third clavicle. The divisions of the trunks are above the subclavian artery (Figure 5).
Costoclavicular infraclavicular space – With the transducer in the longitudinal direction, parallel to the
axis of the body, we identified the subclavian artery, im -mediately below and lateral to the middle/distal third clavicle. In relation to the subclavian artery, the lateral
cord is the most superficial and anterior, the posterior
cord being located in the upper portion and the medial cord being located in the posterior portion.
Retropectoralis minor space – With the transducer positioned longitudinally, parallel to the body’s axis, we
identified the axillary artery, at the level of the coracoid
process and at the distal third of the articular clavicle. Of the brachial plexus cords, the lateral cord is the most
su-perficial and anterior to the axillary artery. The posterior
cord is located superior to the axillary artery, and the medial cord is located posterior to the axillary artery (Figure 6).
MRI exams were performed in sagittal T1-weighted FSE sequences of the cervical spine and bilateral brachial plexus, from the intervertebral foramen to the edge of the scapula (slice thickness, 4 mm); in oblique coronal T2-weighted sequences of the right and left plexuses (slice thickness, 3 mm); and in a coronal STIR sequence of the right cervicothoracic region (slice thickness, 3 mm).
The MRI and ultrasound images were interpreted by two separate independent examiners, each of whom had more than 10 years of experience in their specialty.
Figure 6. Ultrasound of the retropectoralis minor space with the transducer in the transversal plane showing the medial (M), lateral (L), and posterior (P) cords (yellow arrows).
Axillary artery
Figure 5. Ultrasound showing the costoclavicular space, with the transducer in the longitudinal plane, together with the lateral (L), medial (M), and posterior (P) cords (red arrows) around the subclavian artery (yellow arrow).
Subclavian artery
To estimate the frequency of visualization and to allow a comparison with MRI, the brachial plexus was divided into the following segments: the foraminal zone (nerve roots); the interscalene space (from the junction of the nerve roots to the formation of trunks); the cos-toclavicular space, comprising the supraclavicular region (trunks and divisions) and infraclavicular region (anterior and posterior divisions, as well as the cords); and the ret-ropectoralis minor space (cords).
The visualization of the structures was categorized on the basis of a scoring system (Figures 7 and 8): 0 = no
segments identified; 1 = partially identified segments or undefined images; and 2 = well-visualized segments.
In the assessment of interobserver agreement—for ultrasound and MRI—we calculated the kappa statistic, which is useful for the categorization of the variability
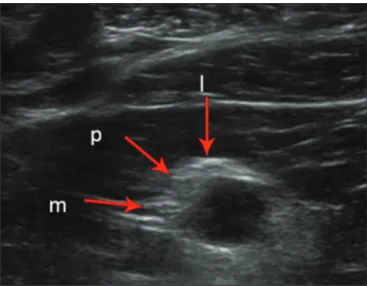
Figure 8. Ultrasound of the retropectoralis minor space, showing the medial (m), lateral (l), and posterior (p) cords (arrows), with a visualization score of 1.
Figure 7. A: Ultrasound in the longitudinal plane showing the C7 root/middle trunk (arrows) in the interscalene space—visualization score of 2. B: MRI in the sagittal plane showing the middle trunk (arrow).
A C7/middle trunk B middle trunk
in the interpretation of two separate datasets. However, the kappa statistic can be inapplicable in some situa-tions, such as in the presence of null categories. In those situations, we also considered the agreement assessment in isolation from the obtained data. In the comparative analysis, the kappa statistic was also used in order to de-termine the agreement between the more experienced ul-trasound and MRI observers (observer 1, in both cases) and the less experienced ultrasound and MRI observers (observer 2, in both cases)
RESULTS
The structures that were best visualized by ultrasound were the cervical roots and their exit passages through the intervertebral foramens to the interscalene space, together with the upper and middle trunks. Among those, the C6
and C7 roots were most easily visualized by both observ-ers, presenting a visualization score of 2 in more than 75% of the sample. In contrast, the C5 and C8 roots presented a visualization score of 2 in up to 65% of the sample. The poorest visualization was of the T1 roots, which were not visualized in 100% of the sample by either observer. Table 1 shows the proportional distribution of the visualization score of 2 reported by the two ultrasound observers.
In the ultrasound analysis of the trunks of the plexus, the middle trunk was the one that was the most well visu-alized, with a visualization score of 2 in 95% of the sam-ple. The upper trunk had a mean visualization score of 2 in 70% of the sample, whereas the lower trunk had a visu-alization score of 2 in up to 65%. The anterior and poste-rior divisions of the trunks were the plexus segments with the worst visualization score, revealing that ultrasound
Regarding the cord segment of the brachial plexus, the proportional distribution of the visualization scores was quite heterogeneous, with no predominance of a score of 0 or 2, in the costoclavicular (infraclavicular) space or in the retropectoralis minor space.
Table 2—Proportional distribution of a visualization score of 2 assigned to the brachial plexus segments by MRI observers 1 and 2.
Brachial plexus segment
Right and left C5 roots Right and left C6 roots Right and left C7 roots Right and left C8 roots Right and left T1 roots Right upper trunk Left upper trunk Right middle trunk Left middle trunk Right and left lower trunks
Observer 1 100 100 100 100 100 85 85 100 100 100 Observer 2 80 100 100 100 100 100 95 95 100 100
Table 3—Level of interobserver agreement for ultrasound and MRI, almost perfect (kappa > 0.81) or not applicable, with perfect agreement for the brachial plexus segments.
Interobserver variable (for ultrasound)
Right and left C7 roots Right and left T1 roots Right middle trunk Right lower trunk
Right upper anterior and posterior divisions; left lower anterior and posterior divisions Left upper anterior and posterior divisions; right lower anterior division
Interobserver variable (for MRI)
Right and left C6, C7, C8, and T1 roots Right middle trunk
Left middle trunk Right lower trunk Left lower trunk
Right lateral cord (costoclavicular space) Left lateral cord (costoclavicular space) Right posterior cord (costoclavicular space) Left medial cord (retropectoralis minor space) Right and left lateral cords (retropectoralis minor space) Right posterior cord (retropectoralis minor space) Left posterior cord (retropectoralis minor space)
Kappa statistic Not applicable Not applicable 1.000 0.920 Not applicable Not applicable Kappa statistic Not applicable Not applicable Not applicable Not applicable Not applicable Not applicable Not applicable Not applicable 1.000 Not applicable Not applicable 1.000
Level of agreement
— — Almost perfect Almost perfect — —
Level of agreement
— — — — — — — — Almost perfect — — Almost perfect Agreement 95% 95% 100% 95% 100% 95% Agreement 100% 95% 100% 90% 100% 95% 90% 75% 100% 95% 95% 100% Table 1—Proportional distribution of a visualization score of 2 assigned to the
brachial plexus segments by ultrasound observers 1 and 2.
Brachial plexus segment
Right C6 root Left C6 root Right C7 root Left C7 root Right upper trunk Left upper trunk Right middle trunk Left middle trunk
Observer 1 95 90 100 100 80 80 95 90 Observer 2 80 75 95 95 60 80 95 95
In the MRI visualization score analysis, all of the cer-vical roots, from C5 to T1, had a visualization score of 2 in more than 80% of the sample, from both observers, as did the upper, middle, and lower trunks, as well as the lateral, posterior, and medial cords, the most experienced observer (observer 1) registering a visualization score of 2 for all the nerve roots from C5 to T1. Table 2 shows the proportional distribution of an MRI visualization score of 2, by observer. However, for both observers, the MRI visualization score of 2 was distributed heterogeneously among the divisions of the brachial plexus. For the upper and middle trunk divisions, observer 1 registered a visual-ization score of 2 in up to 95% of the sample, registering that same score in 100% for the lower trunk division. In contrast, observer 2 registered a visualization score of 1 for most of the trunk divisions.
For the ultrasound findings, the interobserver agree -ment was almost perfect (kappa > 0.81) or non-applica-ble, with perfect agreement regarding the C7 root, T1 root, middle trunk, lower trunk, and the trunk divisions
(Table 3). For the MRI findings, the interobserver agree -ment was perfect or almost perfect (kappa > 0.81) for the cervical roots, trunks, and cords (Table 3).
DISCUSSION
On the basis of the results we obtained for the ultra-sound visualization scores of the brachial plexus segments, three different groups of nerve structures can be
identi-fied: well-visualized segments (visualization score of 2);
segments with intermediate visibility (visualization scores ranging from 0 to 2); and segments with unsatisfactory
visibility (visualization score of 0). In the first group, the
most well visualized segments were the C6 root, C7 root, and the middle trunk, all of which had a visualization score of 2 in the majority of the sample. The exception was the T1 root, which was not visualized in any of the
cases in our sample. These findings are consistent with those in the literature in terms of the difficulty in clearly
visualizing the exit passages of roots C8 and T1(7–9). The medial, lateral and posterior cords of the plexus were in the intermediate visibility group. In those segments, the variations in the visualization score may be attributed to the greater level of experience of one of the observers. The unsatisfactory visualization group comprised the an-terior and posan-terior divisions of the trunk, which vary in
their locations, making it difficult to identify the branches
individually, because of the complexity of the anatomical network(1–10). Therefore, we observed that acceptable
seg-ment visualization correlated with the superficial region
and caliber of the nerve structures. Likewise, roots C6 and C7 (and consequently the middle trunk) were
identi-fied with more clarity than were the anterior and posterior
divisions of the trunks. For the plexus cords, factors that increase technical limitations for adequate visualization are patient biotype, proximity to vascular structures, and location in the costoclavicular or deeper regions of the retropectoralis minor space.
On the basis of the results we obtained for the MRI visualization scores of the brachial plexus segments, two
different groups of nerve structures can be identified:
well-visualized segments; and intermediate or poorly
visualized segments. For the well-visualized segments, both observers registered a visualization score of 2 for the proximal segments of the brachial plexus, which in-cludes the exit passages of the nerve roots from their intervertebral foramina (C5–T1), as well as the trunks and cords. Intermediate or poorly visualized segments include the anterior and posterior divisions, for which there was low interobserver agreement in terms of the visualization scores. We noted that observer 2, who was less experienced, assigned visualization scores of 1 or 2 to the anterior and posterior divisions (each score being assigned to approximately 40% of the sample), whereas the more experienced observer (observer 1) assigned a visualization score of 0 to those divisions in approx-imately 20% of the sample. As was true for the
ultra-sound findings, anatomical variations or complexities of
these divisions are the main reasons for the unsatisfac-tory visualization scores.
To our knowledge, there have been no studies aimed
specifically at evaluating the degree of visualization of
the divisions, either on MRI or on ultrasound. Our study shows that visualization of these segments is unsatisfac-tory on ultrasound and MRI. Our results also underscore the fact that, although the sensitivity of ultrasound for the visualization of some segments of the plexus can be comparable to that of MRI, the latter provides better vi-sualization of most of the structures that compose the brachial plexus.
The main aspects that should be considered in the
analysis of any diagnostic method are its efficacy and
its limitations. Although MRI is currently the reference method for the study of the brachial plexus, it is costly and relatively time-consuming if all the segments of the brachial plexus are to be evaluated, not to mention the well-known contraindications to its use(10). As an
alterna-tive to MRI, ultrasound can be used in specific cases in
which the objective is to evaluate the proximal segment of the brachial plexus, in order to detect impairments along its path in the cervical region, especially those in which the patient is clinically limited and cannot undergo MRI, as well as those in which the results of the neurophysi-ological assessment are inconclusive(11), as they often are in neonates with plexus palsy. Ultrasound can also be useful to guide procedures involving nerve block anesthe-sia, because it allows the nerve roots and their anatomic
variations to be identified, thus preventing complications
such as vascular perforation(12–14).
There is a need for greater dissemination of knowl-edge related to ultrasound and more extensive training of radiologists in its use in the visualization of the brachial plexus. Such advances could make ultrasound a method that is used more routinely in the evaluation of the
bra-chial plexus, given the specific criteria that justify its use
as a complementary tool for clinicians and surgeons who treat patients with brachial plexus injuries.
Table 4—Equivalence of interobserver agreement for the brachial plexus seg-ments between ultrasound observer 1 and MRI observer 1.
Variable
Right C5 root Right C6 root Left C6 root Right C7 root Left C7 root Right upper trunk Left upper trunk Right middle trunk Left middle trunk Left lower trunk
CONCLUSION
The results of our analysis of the visualization of the brachial plexus on ultrasound allowed us to conclude that accuracy of ultrasound was high in the proximal seg-ments, which comprise the ventral branches of the C5, C6, and C7 nerve roots, as well as the upper and middle trunks in the lateral region of the neck.
Ultrasound demonstrated a high degree of concor-dance with MRI in the cervical ventral branches of the C6 and C7 nerve roots, as well as in the middle bilateral trunk. For the visualization of the other brachial plexus segments, there was no high level of agreement among the observers, although the visualization scores were al-ways lower for the ultrasound observer.
REFERENCES
1. Leffert RD. Brachial plexus injuries. New York, NY: Churchill Liv-ingstone; 1985.
2. Amrami KK, Port JD. Imaging the brachial plexus. Hand Clin. 2005; 21:25–37.
3. Bowen BC, Pattany PM, Saraf-Lavi E, et al. The brachial plexus: normal anatomy, pathology, and MR imaging. Neuroimaging Clin N Am. 2004;14:59–85, vii–viii.
4. Zhang Z, Song L, Meng Q, et al. Segmented echo planar MR im-aging of the brachial plexus with inversion recovery magnetization preparation at 3.0T. J Magn Reson Imaging. 2008;28:440–4. 5. Martinoli C, Gandolfo N, Perez MM, et al. Brachial plexus and
nerves about the shoulder. Semin Musculoskelet Radiol. 2010;14: 523–46.
6. Silvestri E, Martinoli C, Derchi LE, et al. Echotexture of peripheral
nerves: correlation between US and histologic findings and criteria
to differentiate tendons. Radiology. 1995;197:291–6.
7. Chen Y, Kumar N, Lim JW, et al. High-resolution sonography detects extraforaminal nerve pathology in patients initially diag-nosed with cervical disc disease: a case series. J Clin Ultrasound. 2013;41:46–54.
8. Sheppard DG, Iyer RB, Fenstermacher MJ. Brachial plexus: dem-onstration at US. Radiology. 1998;208:402–6.
9. Martinoli C, Bianchi S, Santacroce E, et al. Brachial plexus sonog-raphy: a technique for assessing the root level. AJR Am J Roent-genol. 2002;179:699–702.
10. Tagliafico A, Succio G, Serafini G, et al. Diagnostic performance
of ultrasound in patients with suspected brachial plexus lesions in
adults: a multicenter retrospective study with MRI, surgical find -ings and clinical follow-up as reference standard. Skeletal Radiol. 2013;42:371–6.
11. Haber HP, Sinis N, Haerle M, et al. Sonography of brachial plexus traction injuries. AJR Am J Roentgenol. 2006;186:1787–91.
12. Strub B, Sonderegger J, Von Campe A, et al. What benefits does
ultrasound-guided axillary block for brachial plexus anaesthesia of-fer over the conventional blind approach in hand surgery? J Hand Surg Eur Vol. 2011;36:778–86.
13. Conroy PH, Awad IT. Ultrasound-guided blocks for shoulder sur-gery. Curr Opin Anaesthesiol. 2011;24:638–43.