www.ambi-agua.net E-mail: ambi.agua@gmail.com
This is an Open Access article distributed under the terms of the Creative Commons Attribution License, which permits unrestricted use, distribution, and reproduction in any medium, provided the original work is properly cited.
Use of statistical multivariate analysis to identify sources emitting
particulate matter in Belo Horizonte, Brazil
ARTICLES doi:10.4136/ambi-agua.2202
Received: 23 Oct. 2017; Accepted: 11 Jun. 2018
Igor Felipe Silva Moura1*; Alberto Avellar Barreto2; Raisa Helena Sant’Ana Cesar2;
Ananda Borjaille Cruz2; Maria Ângela de Barros Correia Menezes1, 3
1Universidade Federal de Minas Gerais (UFMG), Belo Horizonte, MG, Brasil
Departamento de Engenharia Nuclear (DEN). E-mail: igorfelipedx@ufmg.br, menezes@cdtn.br
2Centro de Desenvolvimento da Tecnologia Nuclear (CDTN), Belo Horizonte, MG, Brasil
Departamento de Serviço de Meio Ambiente (SEMAM). E-mail: aab@cdtn.br, raisa.cesar@cdtn.br, nandy.borjaille@hotmail.com
3Centro de Desenvolvimento da Tecnologia Nuclear (CDTN), Belo Horizonte, MG, Brasil
Serviço de Técnicas Analíticas (SERTA). E-mail: menezes@cdtn.br *Corresponding author
ABSTRACT
Particulate matter is the mixture of solid and liquid particles. It may at times cause adverse effects to human health, in the climate, ecosystem and materials. The objective of this study was to identify the sources emitting particulate matter that contributes to environmental pollution at two sites in Belo Horizonte city. The metropolitan region of Belo Horizonte is characterized by numerous mining activities and other industries, high population and, consequently, a high number of vehicles. There are therefore several sources emitting pollutants into the atmosphere. Airborne particulate matter was collected in air filters during approximately one year using a high-volume sampler in strategic points. The concentration of particulate matter results showed that, in general, the values were 40% higher than the values recommended by legislation. During the summer rainy season, no sample exceeded the recommended limits at both sampling sites. The elemental composition was determined through neutron activation analysis and these values were considered variables in the multivariate statistical analysis for the identification of the main sources of particle emission and their contributions. The results confirmed a significant influence of the soil and motor vehicles in the degradation of the region’s air quality.
Keywords: airborne particulate matter, air quality, environmental monitoring, multivariate statistics analysis, neutron activation analysis.
Identificação de fontes emissoras de material particulado na cidade de
Belo Horizonte (Brasil) através da análise estatística multivariada
RESUMO
Rev. Ambient. Água vol. 13 n. 4, e2202 - Taubaté 2018
Horizonte é caracterizada por inúmeras atividades de mineração e outras indústrias, grande população e, consequentemente, um elevado número de veículos, ou seja, diversas fontes emissoras de poluentes na atmosfera. As partículas suspensas no ar foram coletadas no filtro de ar durante aproximadamente um ano usando um amostrador de grande volume em pontos estratégicos. A concentração de material particulado apontou que, em geral, os valores foram 40% superiores aos valores recomendados pela legislação. No verão, a estação chuvosa, nenhuma amostra excedeu os limites recomendados em ambos os locais de amostragem. A composição elementar foi determinada através da análise de ativação neutrônica e estes valores foram considerados variáveis na análise estatística multivariada para a identificação das principais fontes emissoras de partículas e suas contribuições. Os resultados confirmaram uma influência significativa do solo e veículos motorizados na degradação da qualidade do ar da região.
Palavras-chave: análise estatística multivariada, análise por ativação neutrônica, material particulado, monitoramento ambiental, qualidade do ar.
1. INTRODUCTION
Changes in the natural air constituents may negatively affect plant and animal species, as well as human health and well-being (CONAMA, 1990). The air quality standards established by the World Health Organization (WHO) and national councils such as the National Environment Council (CONAMA) and the State of Minas Gerais Environment Foundation (FEAM) are based on political, social and economic issues, as well as health risk factors and national capacity for air quality management (CONAMA, 1990; FEAM, 2017; WHO, 2006).
Industrial activities generate a large volume of waste that is emitted to the atmosphere, containing several compounds harmful to human health (Brasil et al., 2007). Automobiles are one of the greatest sources of pollution developed by man, and release gases and particles into the atmosphere that alter its natural composition (Albuquerque et al., 2012; Sharma and Khare, 2001). This activity has had a significant impact on air quality, since over the years the number of vehicles has been growing sharply (Nagendra and Khare, 2002; Tavares et al., 2014).
One of the major pollutants released into the atmosphere is particulate matter (PM), which is the mixture of solid and liquid particles that vary in shape and chemical composition, and cause adverse effects on human health, and to the climate, ecosystem and materials (Kappos et al., 2004).
Some elemental traits can cause biological effects, such as inflammation, allergies and DNA damage, generating free radicals in human body tissues (HEI, 2002). The PM composition in the atmosphere depends on emission factors that occur in each region, such as the occurrence of fires, mining activities, automotive vehicle flow or industrial activities (Calijuri and Cunha, 2013), as well as the processes of PM resuspension by natural or artificial agents. Further, PM can be emitted from several sources, fixed or mobile, presenting varied chemical composition (Adissi et al. 2013). Monitoring air quality is essential to the control of air pollution.
The use of monitoring networks associated with computational modeling resources is fundamental to monitoring the evolution of pollutant dispersions and thereby obtaining support for the elaboration of public environmental policies (CETESB, 2015; FEAM, 2017).
Techniques based on monitoring networks allow the investigation of local conditions of air quality. The equipment used is costly and requires operating conditions and adequate structure for sampling at specific points. The generated environmental data are used mainly for statistical analyses on which strategies to identify the main contributing sources of pollution at the monitored site are based (Tavares et al., 2014).
Rev. Ambient. Água vol. 13 n. 4, e2202 - Taubaté 2018 2015) is the Principal Component Analysis (PCA). Many studies, use PCA to assess the impact of pollutants in the atmosphere and in the environment (Almeida et al., 2017; Elbayoumi et al., 2014; Jacomino et al., 2009; Megido et al., 2017; Sánches-Rodas et al., 2017).
This work therefore assessed air pollution in Belo Horizonte, the capital of the state of Minas Gerais, Brazil, at two sites located on the campus of Federal University of Minas Gerais, in order to identify sources emitting PM10. The elemental composition of airborne particulate
matter was analyzed through neutron activation analysis in order that PCA could be used to identify the main sources of PM10 emission.
2. MATERIALS AND METHODS
Sampling of PM10 was performed in the northeast region of Belo Horizonte. The city has
a territorial area of 331,401 km², and an estimated population for the year 2017 of 2,523,794 inhabitants (IBGE, 2016). It is 900 meters above sea level and its temperature varies between 16ºC to 31ºC. The climate is a humid subtropical climate, registering rainfall and high temperatures in summer, while winter is characterized by low rainfall and low temperatures (Belo Horizonte, 2016).
The metropolitan region of Belo Horizonte is characterized by numerous mining activities and other industries, and is highly populated. Because the high population density, there is a high number of vehicles and consequent traffic jams and high emissions of pollutants into the atmosphere.
The area studied, the campus of the Federal University of Minas Gerais (UFMG) is the second largest in terms of the circulation of people in the city of Belo Horizonte, with an estimated 55,000 people circulating daily. This movement causes transportation problems as described in the UFMG Technical Report (UFMG, 2010).
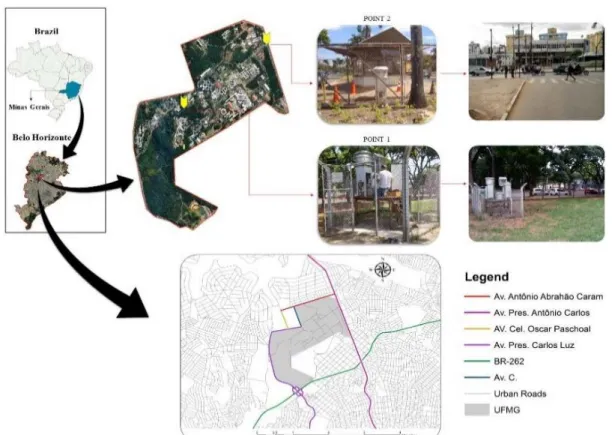
The first step of this work was the selection of PM sampling points. An assessment of the study area was performed in order to identify points exposed to various emission sources, both of natural origin (soil, vegetation, etc.), as well as anthropogenic sources (vehicle and industrial emissions). The proximity to access routes containing high vehicular flow was a factor, due to the urban characteristics of the study area. Based upon these considerations and the surroundings of the region and the main routes of the neighborhood, two points were selected as shown in Figure 1. Point 1 is in an area that includes an ecological preservation site and local transit routes (Coordinate Latitude 19°52'19.53" S and Longitude 43°58'15.14" W); Point 2 is on the margin of one of the main avenues of Belo Horizonte with intense vehicular flow (Coordinate Latitude 19°51'47.32" S and Longitude 43°57'30.27" W).
Several methods have been applied for PM monitoring. A technique widely used throughout the world is based on the High Volume Sampler (HVS), which uses a filter to retain particulate matter, sampling over a 24-hour period (USEPA, 1999). In this work, glass fiber filters were used to collect trace elements contained in suspended particulates in the air (Pöykiö et al., 2003). The HVS has an inertial impact separation head at a flow rate of 1.13 m3 min-1.
The flow uncertainty is less than 1% (ENERGÉTICA, 2012). For this study, only one high sampler was available. The equipment was therefore placed for few days at Point 1 and on other days at Point 2.
Rev. Ambient. Água vol. 13 n. 4, e2202 - Taubaté 2018
Figure 1. PM10 Sampling sites at the Federal University of Minas Gerais.
Before each sampling procedure, the equipment was calibrated to ensure the required flow rate. Samplings were performed using a filter for the retention of particulate during a 24-hour period. The filter model used for monitoring and determining the concentration of PM was the Whatman GF/A fiberglass type, with dimensions of 203 x 254 mm. Before the samplings, the filter was prepared by heating it in a muffle at 400°C for a period of 4 hours to eliminate moisture and organic compounds, and it was later stored in a desiccator to avoid contact with air humidity.
Before the sampling, each entire filter was weighed in a precision balance, with a maximum capacity of 210 g and a standard deviation of 0.1 mg.
After the sampling, the concentration (C) of PM, given in μg m-3, was determined by the
initial mass (mi), final mass (mf) and volume of the sampled air (Vs) as shown in Equation 1.
𝐶𝐶 =106.�𝑚𝑚𝑓𝑓−𝑚𝑚𝑖𝑖
𝑉𝑉𝑠𝑠 � (1)
The identification of elements present in the particulate matter was performed through Neutron Activation Analysis, which is a multielementar analytical technique to determine chemical elements in biological or geological material, effluent, oil, water and also in particulate matter (Menezes and Jacimovic, 2006). The sample is analyzed without being solubilized, a great advantage compared with other technical analytics that require that the sample is in a soluble form. In this study, the technique was applied via k0-standardization
method. This method does not use standards of the involved element but neutron monitors, gamma spectroscopy system absolutely calibrated, good knowledge of spectral parameters in the irradiation channel and k0 constants available in literature. In this technique, the sample is
bombarded by neutrons in a nuclear reactor and the radionuclides produced emit characteristic
radiation formed in the (n,γ) reaction. The chemical elements are then identified and assayed
Rev. Ambient. Água vol. 13 n. 4, e2202 - Taubaté 2018 The irradiation was carried out on the carousel of the TRIGA MARK I IPR-R1 reactor at CDTN (Nuclear Technology Development Centre) in Belo Horizonte, at 100 kW, under an
average thermal neutron flux of 6.30 x 1011 cm-2 s-1. The averages parameters f and α are
(21.7 ± 1.1) and (0.0026 ± 0.0011), respectively. The samples were irradiated simultaneously with neutron flux monitor Al-Au (0.1%) IRMM-530RA foil, cut into a 6 mm diameter 0.1 mm thick. The gamma spectroscopy was performed on an HPGe detector with 15% efficiency and for the spectra analysis - peak area evaluation - the HyperLab program was used. For the calculation of elemental concentrations, a software package called Kayzero for Windows® was
applied (Menezes and Jacimovic, 2006).
In this study, the sampled filter was cut into a fraction of 30 cm2 and packed in a
polyethylene tube, 2.3 cm high and 1.1 cm in diameter, and then irradiated. In order to discount the influence of the filter material, the blank was prepared in triplicate under the same conditions.
Subsequently, Multivariate statistics was used, which is commonly applied in environmental studies, through principal component analysis (PCA), which analyzes multiple measurements of variables, with the objective of investigating, measuring, explaining and predicting relationships among statistical variables (Hair et al., 2009).
In the same way as PCA, Factorial Analysis (FA) describes the original vectors in a smaller number of variables, where they are called common factors and related to the original vector through the linear model (Mingoti, 2005). Through some rules, the quantity of factors according to Kaiser's criterion (Elbayoumi et al., 2014; Mingoti, 2005) refers to eigenvalues greater or equal to 1, and many times it is necessary to carry out a rotation of these factors. One of the methods of rotation is the Varimax, which tries to find factors with great variability to better explain the PCA (Mingoti, 2005). Minitab Software was used for the execution and interpretation of statistical data.
3. RESULTS AND DISCUSSION
3.1. Particulate Matter Concentration
According to legislation (USEPA, 2014), air is considered to be of Good Quality when the concentration based on PM10, is lesser than 50 μg m-3; Moderate, when it is between 51 and
100 μg m-3; Unhealthy for Sensitive Groups, between 101 and 150 μg m-3; Unhealthy, between
151 and 200 μg m-3; Very Unhealthy, between 201 and 300 μg m-3; and above 301 μg m-3 is
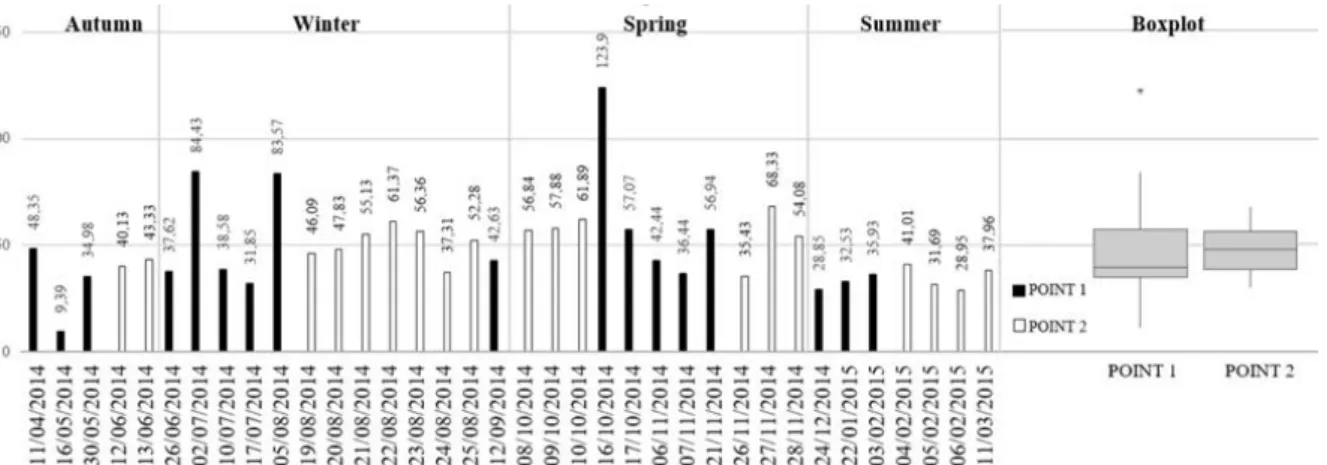
assessed as Hazardous. Figure 2 shows the concentration values for particulate matter collected from Point 1 and Point 2, the central tendency and variability of the data and their classification according to the values of US-EPA.
Rev. Ambient. Água vol. 13 n. 4, e2202 - Taubaté 2018
The samples from Point 1 presented a range of PM10concentration of 9.4 μg m-3 occurring
in the fall, and 123 μg m-3 in the spring. During the monitored period, the concentration of PM
10
in samples showed abrupt changes over time. Two samples in the winter exceeded 50 μg m-3,
classified according to US-EPA as “Moderate”. In the spring, three samples presented
concentrations higher than 50 μg m-3, two presented as “Moderate” and one as “Unhealthy for
Sensitive Groups”. In the summer rainy season, these limits were not exceeded, resulting in good air quality.
Point 2 samples presented a range of PM10concentration of 29 μg m-3 in the summer season
and 68 μg m-3 during spring time. The results showed a stable behavior throughout the sampling
campaign, with only a slight decline in concentration in the summer. In winter, four samples
exceeded 50 μg m-3. In the spring, two samples exceeded 50 μg m-3, and one of them had the
highest value recorded in the whole campaign for this site, 68 μg m-3. In the summer, no sample
exceeded the recommended limits.
Related to elemental concentration results, Table 1 displays the range of the values determined for the elemental concentration in the particulate matter collected in the air filters. Elements that presented values lower than their limits of detection, that is, Ag, Cd and Hg, were not included in the calculations.
The Brazilian legislation does not foresee maximum values allowed in particulate matter for elemental concentration (Querol et al., 2001, except for lead (CETESB, 2017). Comparing the obtained values in Table 1 with the values of samples of PM10 collected in China (Song et
al., 2017), for instance, the Chinese results are higher. One reason is due to poor environmental control. Comparing the same results with those from another Brazilian capital, São Paulo, there are similarities of pollution in terms of chemical elements and elemental concentrations (Albuquerque et al., 2012; Almeida et al., 2017). European elemental concentrations are below those found in this study. The report points out a tendency of reduction of pollution, due to the public policies in those countries (Leoni et al., 2018).
Table 1. Lower and upper values for elemental concentrations determined in the particulate matter collected in the air filters.
Elem. Point 1 (pg m-3) Point 2 (pg m-3) Elem. Point 1 (pg m-3) Point 2 (pg m-3) Ag < DL < DL Na 43676 - 1291138 91861 - 358425 As 23.3 - 79.5 23.2 - 39.3 Nd 13.7 - 323 59 - 88.8 Au 0.1 - 0.4 0.1 - 0.2 Rb 20 - 408 41.8 - 97.4 Ba 24613 - 722536 77343 - 209459 Sb 2.8 - 3212 10.5 - 53 Br 4.1 - 292 11.7 - 53.2 Sc 0.6 - 13.0 0.9 - 3.8 Ca 10067 - 305862 29437 - 83641 Se 53.5 - 92.6 29.8 - 726
Cd < DL < DL Sm 1.1 - 51 1.2 - 17.1
Ce 11.3 - 642 12.7 - 227 Sr 928 - 28890 2851 - 8132 Co 0.4 - 13.7 0.9 - 3.9 Ta 0.2 - 19.1 0.4 - 5.7 Cr 37.1 - 977 58.8 - 254 Tb 0.3 - 435 0.5 - 5.1 Cs 1.6 - 7.9 1.5 - 3.3 Th 1.7 - 86.1 4.1 - 30.2 Eu 0.8 - 80.3 1 - 11.5 U 1.7 - 33.5 7.5 - 12.5 Fe 1846 - 85157 3815 - 23304 W 3754 - 4150 1584 - 4214 Hf 12.7 - 229 12.1 - 92.6 Yb 5.2 - 94.7 3.4 - 33.6 Hg < DL < DL Zn 20039 - 569939 57009 - 167672
K 30019 - 469573 61232 - 307734 Zr 554 - 2068 1649 - 2483 La 6.7 - 338 6.7 - 118
Rev. Ambient. Água vol. 13 n. 4, e2202 - Taubaté 2018 3.2. Statistical analysis
PCA was used after normalization for statistical analysis. The variables used were the chemical elements of the samples of the PM10 and their elemental concentrations. As the
variables were higher than the number of samples, it was necessary to reduce the number of variables, according to Mingoti (Mingoti, 2005). This was based on the concentration frequency of the variables, that is, concentration values with smaller occurrences in the samples were excluded from the analysis.
The PCA and the Varimax rotation were used for better data interpretation, providing the factors that contribute to the sample matrix. The results of PCA were highlighted that showed greater relevance among the factors of each variable (Mingoti, 2005).
3.2.1. Site: Point1
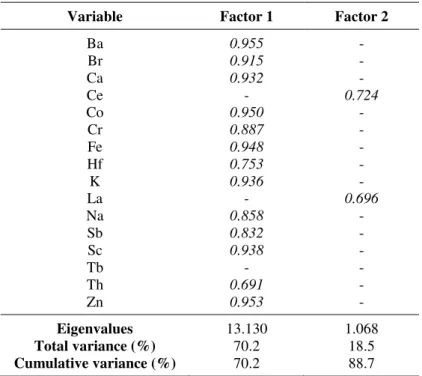
The software Minitab reduced the original variables of sampling site Point 1 according to Mingoti (Mingoti, 2005), obtaining two factors, shown in Table 2. The Kaiser criterion (Rebelo et al., 2015; Stobinski et al., 2014) was taken into account, using values of the eigenvalues higher than 1. For this analysis, sixteen variables were used (Ba, Br, Ca, Ce, Co, Cr, Fe, Hf, K, La, Na, Sb, Sc, Tb, Th and Zn) of the thirty-three obtained.
Table 2. Results of PCA after rotation VARIMAX at Point 1.
Variable Factor 1 Factor 2
Ba 0.955 -
Br 0.915 -
Ca 0.932 -
Ce - 0.724
Co 0.950 -
Cr 0.887 -
Fe 0.948 -
Hf 0.753 -
K 0.936 -
La - 0.696
Na 0.858 -
Sb 0.832 -
Sc 0.938 -
Tb - -
Th 0.691 -
Zn 0.953 -
Eigenvalues 13.130 1.068
Total variance (%) 70.2 18.5
Cumulative variance (%) 70.2 88.7
It was verified that the accumulated variance is 88.7% of the data. Factor 1 explained 70.2% of the total variation, where the elements Ba, Br, Ca, Co, Cr, Fe, Hf, Na, Sb, Sc, Th and Zn contributed to this first factor. From the characterization of the factor loadings, the main contributors can be identified. These elements indicate a strong influence of geogenic origin (Destefan and Holanda, 2011; Moreno et al., 2017; Noce et al., 1997), although it is difficult to differentiate its origin due to the processes of transport and resuspension of the soil. The elements Ba, Na and Zn strengthen even more this origin due to their elemental concentrations, averaging 165 ng m-3, 328 ng m-3 and 128 ng m-3, respectively. The elements in Factor 1 may
Rev. Ambient. Água vol. 13 n. 4, e2202 - Taubaté 2018
Speciate (USEPA, 2015), influence from fuel combustion (gasoline, oil and diesel) of automotive supplies and paving stones of the municipal road in front of the sampled site (Silva et al., 2009; Xue et al., 2006). The elements La and Ce have average concentrations of 0.06 ng m-3 and 0.13 ng m-3, respectively. There are no specific studies of isotopic ratios of rare earths
present in PM in Brazil. In addition to these influences, the burning of organic material and construction can also contribute to the presence of these elements. The relationship between La and Ce of the analyzed samples showed an increase of approximately 10% in comparison with the crustal source of Belo Horizonte (Noce et al., 1997).
3.2.2. Site: Point 2
The original variables of the samplings carried out in Point 2 were reduced, according to Mingoti (Mingoti, 2005), based upon the concentration frequency of the variables. The Kaiser criterion (Rebelo et al., 2015; Stobinski et al., 2014) was also followed. Three factors were obtained as shown in Table 3, with a cumulative variance of 84.9% of the variability in the data. For this analysis, 17 variables were used (Ba, Ca, Ce, Co, Cr, Fe, Hf, K, La, Na, Sb, Sc, Sm, Ta, Tb, Th, Zn) from the thirty-three obtained, due to the removal of variables that were not found elementary concentrations representative for the calculation of PCA.
Table 3. Results of the PCA after VARIMAX rotation at Point 2.
Variable Factor 1 Factor 2 Factor 3
Ba 0.960 - -
Ca 0.865 - -
Ce - 0.962 -
Co 0.871 - -
Cr 0.701 0.700 -
Fe 0.867 - -
Hf 0.719 - -
K - - -0.653
La - 0.953 -
Na 0.936 - -
Sb 0.628 - -
Sc 0.881 - -
Sm - - -
Ta - - 0.620
Tb - 0.967 -
Th - 0.965 -
Zn 0.962 - -
Eigenvalues 9.883 3.280 1.269
Total variance (%) 43.5 33.3 8.1
Cumulative variance (%) 43.5 76.8 84.9
Factor 1 explains 43.5% of the total variation, where 10 elements contributed to this factor (Ba, Ca, Co, Cr, Fe, Hf, Na, Sb, Sc and Zn). Through the factorial loads, the elements of this factor indicate a strong influence of geogenic origin (Noce et al., 1997).
Factor 2 explains 33.3% of the total variation, where Th, Tb, Ce and La contributed to this factor. Through factor loads, there is a strong influence on fuel combustion, similar to the second factor at Point 1 (Silva et al., 2009; Xue et al., 2006), which identified sources from automotive fuel burning, burning of organic material (leaves of trees), buildings, and coal combustion (wood burning) (Someshwar and Jain, 2003; USEPA, 2015).
Rev. Ambient. Água vol. 13 n. 4, e2202 - Taubaté 2018
4. CONCLUSION
The first sampling site (Point 1) is near buildings and streets with a constant traffic of vehicles. The second sampling site (Point 2) is near an avenue with intense and constant traffic of vehicles (cars, buses and trucks). Concerning the concentration of airborne particulate matter, PM10, Point 2 presented higher range of values than Point 1. The highest value, in spring time,
was considered “Unhealthy for Sensitive Groups” according to US-EPA. These results point out that this site near of the avenue presents more health risks. In general, the values were 40% higher than those recommended by legislation. In the summer rainy season, no sample exceeded the recommended limits.
The analysis of the elemental composition of PM10, resulted in the determination of
thirty-three elements. This information was fundamental for the verification of possible PM10 emitters
present in the sampling sites by means of the statistical technique of multivariate analysis, using the main component method.
Two factors were identified for the first sampled site and three factors for the second site. It was observed that in both locations the air quality is influenced by vehicular emissions, though more strongly at Point 2. At Point 1, the influence of the dust from the soil was confirmed. At this point, the lower contribution of the vehicular sources was expected due to its central position in relation to the avenues that surround the site. However, the results suggest that the pollutants are transported from the streets in direction of the study area.
This study suggests that air quality monitoring should be conducted periodically to identify and alert the population of the health risks related to air pollution. This monitoring should also provide data for a better statistic for the study of local air quality. Therefore, the methodologies used in this study to determine airborne particulate matter concentration, the chemical composition and a statistical tool for multivariate analysis, are useful in PM10 research.
5. ACKNOWLEDGEMENTS
This research project was supported by the following Brazilian institutions: the Nuclear Technology Development Center (CDTN), the Brazilian Nuclear Energy Commission (CNEN), Coordination of Improvement of Higher Level Personnel (CAPES), the Research Support Foundation of the State of Minas Gerais (FAPEMIG), and the Brazilian Council for Scientific and Technological Development (CNPq).
6. REFERENCES
ADISSI, P. J.; PINHEIRO, F. A.; CARDOSO, R. S. Gestão ambiental de unidades produtivas. Rio de Janeiro: Elsevier, 2013.
ALBUQUERQUE, T. T. De A.; ANDRADE, M. De F.; YNOUE, R. Y. Characterization of atmospheric aerosols in the city of São Paulo, Brazil: comparisons between polluted and unpolluted periods. Environmental Monitoring and Assessment, v. 184, n. 2, p. 969– 984, 2012. https://doi.org/10.1007/s10661-011-2013-y
ALMEIDA, T. S.; SANT’ANA, M. O.; CRUZ, J. M.; TORMEN, L.; BASCUÑAN, V. L. A. F.; AZEVEDO, P. A. et al. Characterisation and source identification of the total airborne particulate matter collected in an urban area of Aracaju, Northeast, Brazil. Environmental Pollution, v. 226, p. 444–451, 2017. https://doi.org/10.1016/j.envpol.2017.04.018
Rev. Ambient. Água vol. 13 n. 4, e2202 - Taubaté 2018
BRASIL, J. L.; VAGHETTI, J. C. P.; ROYER, B.; SANTOS JR., A. A. Dos; SIMON, N. M.; PAVAN, F. A. et al. Planejamento estatístico de experimentos como uma ferramenta para otimização das condições de biossorção de Cu(II)em batelada utilizando-se casca de nozes peçã como biossorvente. Química Nova, v. 30, p. 548–553, 2007.
CALIJURI, M. C.; CUNHA, D. G. F. Engenharia ambiental: conceitos, tecnologia e gestão. São Paulo: Elsevier, 2013.
COMPANHIA AMBIENTAL DO ESTADO DE SÃO PAULO - CETESB. Qualidade do ar no Estado de São Paulo. 2015. Available at: http://cetesb.sp.gov.br/ar/wp-content/uploads/sites/28/2013/12/RQAR-2015.pdf Access: 2015.
COMPANHIA AMBIENTAL DO ESTADO DE SÃO PAULO - CETESB. Padrões de Qualidade do Ar. 2017. Available at: http://cetesb.sp.gov.br/ar/padroes-de-qualidade-do-ar/ Access: 17 May 2017.
CONSELHO NACIONAL DO MEIO AMBIENTE. Resolução n° 003 de 28 de junho de 1990. Diário Oficial [da] União, 28 Ago. 1990, Seção I, p. 15.937-15.939.
DESTEFAN, A. Z.; HOLANDA, J. N. F. Utilização do planejamento experimental em rede simplex no estudo de resíduo de rocha ornamental como filler para obtenção de máxima compacidade. Cerâmica, v. 57, p. 491–498, 2011.
ELBAYOUMI, M.; RAMLI, N. A.; YUSOF, N. F. F. M.; YAHAYA, A. S. BIN; MADHOUN, W. AL; UL-SAUFIE, A. Z. Multivariate methods for indoor PM10 and PM2.5 modelling in naturally ventilated schools buildings. Atmospheric Environment, v. 94, p. 11–21, 2014.
ENERGÉTICA INDÚSTRIA E COMÉRCIO LTDA. Manual de operação: amostrador de grande volume (AGV) para partículas de até 10µm (MP10). Rio de Janeiro, 2012.Available
at: www.energetica.ind.br/wp/env1/wp-content/uploads/2016/01/env1_manual-mp10_rev_11.pdf Access: July 2017.
FUNDAÇÃO ESTADUAL DO MEIO AMBIENTE (MG) - FEAM. Monitoramento. 2017. Available at: www.feam.br/monitoramento Access: 2017.
GUILLÉN, J.; MUÑOZ, G.; BAEZA, A.; SALAS, A.; MOCANU, N. Attempt to reduce 239Pu
and 241Am uptake by wheat plantlets by application of inorganic fertilizers. Journal of
Radioanalytical and Nuclear Chemistry, v. 311, p. 991–997, 2017. https://doi.org/10.1007/s10967-016-4894-2
HAIR, J. F.; BLACK, W. C.; BABIN, B. J.; ANDERSON, R. E.; TATHAM, R. L. Análise Multivariada. 6. ed. Rio de Janeiro: Bookman, 2009.
HEALTH EFFECT INSTITUTE - HEI. Understanding the health effects of components of the particulate matter mix: progress and next steps. Insights from HEI’s research programs. Boston, 2002.
INSTITUTO BRASILEIRO DE GEOGRAFIA E ESTATÍSTICA - IBGE. IBGE Cidades. 2016. Available at: http://cidades.ibge.gov.br/painel/painel.php?lang=&codmun=310620 Access: 8 May 2017.
Rev. Ambient. Água vol. 13 n. 4, e2202 - Taubaté 2018 KAPPOS, A. D.; BRUCKMANN, P.; EIKMANNC, T.; ENGLERTD, N.; HEINRICHE, U.;
HÖPPE, P. et al. Health effects of particles in ambient air. International Journal of Hygiene and Environmental Health, v. 207, p. 399–407, 2004. https://doi.org/10.1078/1438-4639-00306
LEONI, C.; POKORNA, P.; HOVORKA, J.; MASIOL, M.; TOPINKA, J.; ZHAO, Y. et al. Source apportionment of aerosol particles at a European air pollution hot spot using particle number size distributions and chemical composition. Environmental Pollution, v. 234, p. 145–154, 2018. https://doi.org/10.1016/j.envpol.2017.10.097
MEGIDO, L.; NEGRAL, L.; CASTRILLÓN, L.; FERNÁNDEZ-NAVA, Y.; SUÁREZ-PEÑA, B.; MARAÑÓN, E. Impact of secondary inorganic aerosol and road traffic at a suburban air quality monitoring station. Journal of Environmental Management, v. 189, p. 36– 45, 2017. https://doi.org/10.1016/j.jenvman.2016.12.032
MENEZES, M. Â. D. B. C.; JACIMOVIC, R. Optimised k0-instrumental neutron activation method using the TRIGA MARK I IPR-R1 reactor at CDTN/CNEN, Belo Horizonte, Brazil. Nuclear Instruments and Methods Physics Research, v. 564, p. 707–715, 2006. https://doi.org/10.1016/j.nima.2006.04.013
MINGOTI, S. A. Análise de dados através de métodos de estatística multivariada: uma abordagem aplicada. Belo Horizonte: Editora UFMG, 2005.
MORENO, J.; FATELA, F.; LEORRI, E.; MORENO, F.; FREITAS, M. C.; VALENTE, T. et al. Bromine soil/sediment enrichment in tidal salt marshes as a potential indicator of climate changes driven by solar activity: New insights from W coast Portuguese estuaries. Science of the Total Environment, v. 580, p. 324–338, 2017. https://doi.org/10.1016/j.scitotenv.2016.11.130
NAGENDRA, S. M. S.; KHARE, M. Line source emission modelling. Atmospheric Environment, v. 36, p. 2083–2098, 2002. https://doi.org/10.1016/S1352-2310(02)00177-2 NOCE, C. M.; TEIXEIRA, W.; MACHADO, N. Geoquímica dos gnaisses ttgs e granitóides
neoarqueanos do complexo Belo Horizonte, quadrilátero ferrífero, Minas Gerais. Revista Brasileira de Geociências, v. 27, p. 25–32, 1997.
PÖYKIÖ, R.; PERÄMÄKI, P.; RÖNKKÖMÄKI, H. The homogeneity of heavy metal deposition on glass fibre filters collected using a high-volume sampler in the vicinity of an opencast chrome mine complex at Kemi, Northern Finland. Analytical and Bioanalytical Chemistry, v. 375, p. 476–481, 2003. https://doi.org/10.1007/s00216-002-1704-1 REBELO, M.; SILVA, E. F. Da; ROCHA, F. Characterization of Portuguese Thermo-mineral
waters to be applied in peloids maturation. Environmental Earth Sciences, v. 73, p. 2843–2862, 2015. https://doi.org/10.1007/s12665-014-3670-2
SÁNCHES-RODAS, D.; ALSIOUFI, L.; LA CAMPA, A. M. S. De; GONZÁLEZ-CASTANEDO, Y. Antimony speciation as geochemical tracer for anthropogenic emissions of atmospheric particulate matter. Journal of Hazardous Materials, v. 324, p. 213–220, 2017. https://doi.org/10.1016/j.jhazmat.2016.10.051
SHARMA, P.; KHARE, M. Modelling of vehicular exhausts - a review. Transportation Research, v. 6, p. 179–198, 2001. https://doi.org/10.1016/S1361-9209(00)00022-5 SILVA, R. A.; VIANA, M. M.; MOHALLEM, N. D. S. Caracterização textural, morfológica e
Rev. Ambient. Água vol. 13 n. 4, e2202 - Taubaté 2018
SOMESHWAR, A.; JAIN, A. K. Compilation of ’air toxic’ and total hydrocarbon emissions data for sources at kraft, sulfite and non-chemical pulp mills - An Update. ResearchGate, n. 858, 2003.
SONG, C.; WU, L.; XIE, Y.; HE, J.; CHEN, X.; WANG, T. et al. Air pollution in China: Status and spatiotemporal variations. Environmental Pollution, v. 227, p. 334–347, 2017. https://doi.org/10.1016/j.envpol.2017.04.075
STOBINSKI, M.; SZARLOWICZ, K.; RECZYNSKI, W.; KUBICA, B. The evaluation of 137Cs radioactivities in soils taken from the Babia Góra National Park. Journal of Radioanalytical and Nuclear Chemistry, v. 299, p. 631–635, 2014. https://doi.org/10.1007/s10967-013-2809-z
TAVARES, F. V. F.; ARDISSON, P. C. H.; RODRIGUES, P. C. H.; BRITO, W.; MACEDO, W. A. A.; JACOMINO, V. M. F. Characterization of iron in airborne particulate matter. Hyperfine Interactions, v. 224, p. 109–119, 2014. http://dx.doi.org/10.1007/978-94-007-6482-8_13
UNIVERSIDADE FEDERAL DE MINAS GERAIS - UFMG. Diretrizes gerais para questões de trânsito, transporte e estacionamento no Campus da Pampulha - Documento para discussão com a comunidade. 2010. Available at: https://www.ufmg.br/online/arquivos/anexos/Diretrizes_Gerais_para_as_questoes_de_transi
to_transporte_e_estacionamentos_no_Campus_da_Pampulha.pdf. Access: 1 Oct. 2017.
UNITED STATES. Environmental Protect Agency – USEPA. Speciate. Air Emissions Modeling. 2015. Available at: https://www.epa.gov/air-emissions-modeling/speciate-version-45-through-32. Access: 1 Oct. 2017.
UNITED STATES. Environmental Protect Agency – USEPA. Sampling of ambient air for total suspended particulate matter (SPM) and PM10 using high volume (HV) sampler
(EPA/625/R-96/010a). 1999. Available at: https://www3.epa.gov/ttnamti1/files/ambient/inorganic/mthd-2-1.pdf. Access: 1 Oct. 2017.
UNITED STATES. Environmental Protect Agency – USEPA. AQI - Air Quality Index - A Guide to Air Quality and Your Health (No. EPA-456/F-14-002). 2014. Available at: https://www3.epa.gov/airnow/aqi_brochure_02_14.pdf. Access: 1 Oct. 2017.
WORLD HEALTH ORGANIZATION - WHO Air quality guidelines for particulate matter, ozone, nitrogen dioxide and sulfur dioxide - Global Update 2005 - Summary of Risk
assessment. 2006. Available at:
http://apps.who.int/iris/bitstream/10665/69477/1/WHO_SDE_PHE_OEH_06.02_eng.pdf Access: 1 Oct. 2017.