Fisioter. Mov., Curitiba, v.30, Suppl 1, 2017 Licenciado sob uma Licença Creative Commons DOI: http://dx.doi.org/10.1590/1980-5918.030.S01.AO06
Factors that impact functional performance
of elderly with low back pain
Fatores que impactam o desempenho
funcional de idosos com dor lombar
Flora Pereira Guerra, Rosângela Corrêa Dias, Leani Souza Máximo Pereira, Luciana de Oliveira Assis, Marcella Guimarães Assis*
Universidade Federal de Minas Gerais (UFMG), Belo Horizonte, MG, Brazil
[R]
Abstract
Introduction: Low back pain is a common condition among older adults and an important cause of disabil-ity. Objective: To evaluate the relationship between functional performance of older adults with low back pain and the following variables: sociodemographic and clinical factors, self-perceived health and back pain beliefs. Methods: A cross-sectional study that used data from the Back Complaints in the Elders interna-tional consortium. Information about sociodemographic factors (sex, age, marital status, formal education), clinical factors (intensity and frequency of pain, comorbidities), self-perceived health, back pain beliefs and functional performance (measured by the disability component of the Late Life Function and Disability Instrument - LLFDI) were collected through self-report. 191 older adults above 60 years with a new epi-sode of back complaints who did not have any cognitive disorder, visual or hearing impairment, or motor disabilities participated in the study. A bivariate analysis was conducted between each independent vari-able and each outcome. Associations with p < 0.20 were selected for the multiple linear regression analysis, which was carried out for each LLFDI domain. Results: The multiple regression coefficients of determina -tion were significant despite the modest magnitude. The variables related to func-tional performance were
64
back beliefs, self-perceived health, formal education, pain frequency and marital status. Conclusion: These results may contribute to the expansion of health professionals’ work in the therapeutic approach of low back pain, broadening its focus beyond clinical aspects in order to value beliefs of older adults and their self-perceived health.
Keywords: Elderly. Low Back Pain. Disability. Beliefs. Self-Perception.
Resumo
Introdução: A dor lombar é condição comum em idosos e importante causa de incapacidade nessa população.
Objetivo: Avaliar a relação das variáveis sóciodemográficas, clínicas, autopercepção de saúde e crenças com o
desempenho funcional de idosos com dor lombar. Métodos: Estudo transversal que utilizou dados do projeto multicêntrico Back Complaints in the Elders. A amostra foi de 191 idosos que relataram novo episódio de dor
lombar em menos de 6 semanas e não apresentavam alterações cognitivas, deficiências visuais, auditivas e motoras graves. Através do auto relato, foram coletadas informações sobre características sóciodemográficas (sexo, idade, estado civil, escolaridade), clínicas (intensidade e frequência da dor, comorbidades), autopercep
-ção de saúde, crenças em rela-ção às consequências da dor lombar e desempenho funcional (componente de incapacidade do Late Life Function and Disability Instrument - LLFDI). Foi realizada a análise bivariada de
cada variável independente com cada desfecho (6 diferentes escores fornecidos pelo componente de
incapaci-dade do LLFDI) e aquelas que apresentaram significância p < 0,20 entraram nos modelos de regressão múltipla para cada domínio do LLFDI. Resultados: Os coeficientes de determinação dos modelos multivariados foram significativos, apesar da modesta magnitude. As variáveis que se relacionaram com o desempenho funcional foram crenças, autopercepção de saúde, escolaridade, frequência da dor e estado civil. Conclusão: Esses
re-sultados poderão contribuir para ampliação da atuação dos profissionais de saúde para além dos aspectos clínicos, valorizando as crenças dos idosos e sua autopercepção de saúde na abordagem terapêutica com foco
na dor lombar.
Palavras-chave: Idosos. Dor Lombar. Incapacidade. Crença. Autopercepção.
Introduction
Musculoskeletal conditions in the elderly are a major cause of disabilities, especially low back pain which is considered a worldwide problem (1, 2).
Low back pain is defined as a pain between the lower edge of the 12th rib and the lower gluteal line, which is intense enough to limit usual activities or change daily routine (3, 4). It is considered a multifactorial condition relating to personal, biomechanical, psychosocial and environmental factors (5), and presents different stages of disability and chronicity (4, 6). It is prevalent in females and in the age group that ranges from 40 to 80 years old (6).
Low back pain is a common condition with an incidence rate of 25% in Brazilian older adults (7). Particular attention is drawn to the fact that functional performance is influenced by factors that go beyond the clinical characteristics of the individual.
Studies have shown that older adults with low back pain presented greater difficulty performing daily activities (8, 9). There is evidence that factors such as pain intensity and frequency (10, 11) and sex (10) are associated with the functional performance of this population.
No studies were found correlating beliefs and self-perception about health with the functional performance of elderly with low back pain. However, two studies with individuals of various ages have shown that negative beliefs regarding low back pain are associated with a higher level of disability (12, 13). A study performed with older adults without specific health conditions verified that the greater the degree of dependence, the greater the chance of the elderly perceiving their health as poor (14).
65 is fundamental to understand the real impact of
this condition on their lives. Thus, the objective of this study was to evaluate the relationship of sociodemographic variables (sex, age, marital status, level of education), clinical variables (intensity and frequency of pain, comorbidities) and the variables of self-perception of health and beliefs with the functional performance of elderly with low back pain.
Methods
The present study uses a cross-sectional approach, and is part of the multicenter project Back Complaints in the Elders - BACE, developed by Australia, the Netherlands and Brazil, and has a published protocol (15). The BACE was approved by the Research Ethics Committee of UFMG under the opinion number: 0100.1.203.000-11. Participants signed the Free and Informed Consent Term.
Sample
The convenience sample consisted of data of 191 older adults in the age group between 60 and 94 years old, evaluated from the baseline of the BACE study between September 2011 and November 2012. Inclusion criteria for BACE were: age over 55 years old and presence of a new episode of low back pain (less than 6 weeks). The study excluded elderly individuals with cognitive alterations, or visual, hearing or motor disabilities. Recruitment was done by referral of health professionals who work in primary care, outpatient and hospital services.
Instruments and Procedures
The BACE project protocol included numerous assessment tools (15). The Mini Mental State Examination (MMSE) was first performed to identify cognitive alterations, considering the cutoff points proposed by Bertolucci (16). In the present study we used data from the sociodemographic, comorbidities and self-perception of health questionnaires, as well as the following evaluation protocols:
- Visual Analogue Scale (VAS): Often used to measure pain intensity by means of a numerical estimate ranging from 0 to 10 (17).
- Western Ontario and McMaster Universities Osteoarthritis Index (WOMAC): Quality of life questionnaire developed for individuals with knee and hip osteoarthritis. It evaluates three domains scored on a five-point Likert scale, namely: pain (5 items), rigidity (2 items) and physical function (17 items). This study used the first part of the questionnaire (pain domain). The average score for each domain ranges from 0 to 100. The higher the score, the greater the effects (18). This test was validated for the Brazilian population (18), and was able to report the pain profile in individuals with and without low back pain, regardless of diagnosis (19).
- Back Beliefs Questionnaire (BBQ): Assesses beliefs regarding the potential negative consequences of low back pain. It consists of 14 items, of which 9 are valid for the final score and 5 are used as distractors. Each item is scored on a five-point Likert scale. The lower the score, the more negative the beliefs (20). The BBQ was translated and adapted for the Brazilian elderly population (21).
- Late Life Function and Disability Instrument (LLFDI): Evaluates the functional performance of the elderly. It is divided into two components: function and disability. The disability component was used in this study, which refers to performance in socially defined activities and evaluates the frequency of achievement and limitation in 16 daily activities, which includes basic, instrumental and advanced activities of daily living. The frequency dimension is divided into two role domains: social role (9 items) and personal role (7 items); and the limitation dimension in: instrumental role (12 items) and management role (4 items). The later division resulted in a group of activities involving more physical skills (instrumental role) and another involving more cognitive skills (management role). The instrument is applied with graphical assistance for answers.
66
The closer to 100, the higher the frequency of activities and the lower the limitation (22). This instrument was adapted for the Brazilian population and presented high levels of intra and inter-examiner reliability (23).
Statistical analysis
First, the statistical analysis had the goal of characterizing the sample. Then, the bivariate analysis of each independent variable was performed with each outcome. As the distribution of data was not considered normal, the Kruskal-Wallis test was performed for nominal variables with more than two categories, the Mann-Whitney test for the nominal variables with two categories, and the Spearman correlation for the quantitative variables. Results with p-value lower than 0.20 identified variables that were later included in the multivariate regression models. A significance level of 5% was considered in all inferential analyses.
Results
The sample consisted of 191 older adults from the community aged 60 years old and over. Demographic, clinical, self-perceived health, beliefs, and functional performance characteristics are presented in Tables 1 and 2.
The bivariate analyzes that presented p < 0.20 indicated the independent variables entered into the multiple linear regression models for each LLFDI domain. These models used the enter method for variables selection. The results of bivariate analysis can be seen in Table 3.
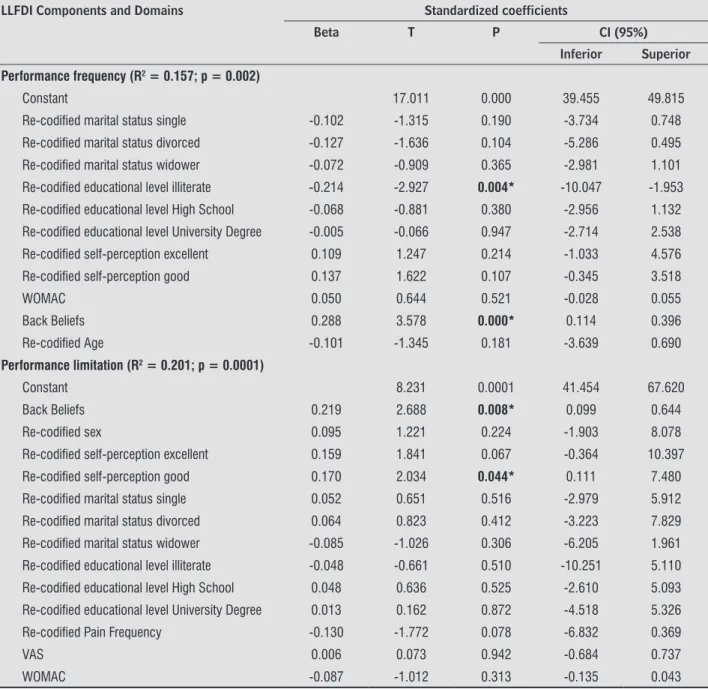
The regression models for each domain of the LLFDI test are shown in Table 4. The coefficients of determination of the multivariate models were significant, despite the limited magnitude. The models that presented the highest explanatory value (R2 = 0.20) were the instrumental role and limitation in performing the activities, in which the variables beliefs and self-perception of health remained significant. And also pain frequency, but only in the instrumental role. The results referring to the management role area did not reach statistical significance, thus they are not represented in the table.
Table 1 - Demographic, clinical and self-perceived health characteristics of participants (n = 191)
N (%) Sex
F 167 (87.4)
M 24 (12.6)
Age
60 to 74 155 (81.2)
75 and over 36 (18.8)
Marital Status
Single 37 (19.4)
Married / living with a partner 83 (43.4)
Divorced 20 (10.5)
Widower 51 (26.7)
Level of Education
Illiterate 8 (4.2)
Elementary School 109 (57.1) High School/Technical Course 47 (24.6) University Degree/Post-graduation 27 (14.1) Pain frequency
Not every day 52 (27.2)
Every Day 139 (72.8)
Self-perception of health
Excellent/Very Good 27 (14.1)
Good 106 (55.5)
Bad 58 (30.4)
Comorbidities
None 6 (3.2)
1 up to 3 69 (36.1)
4 or more 116 (60.7)
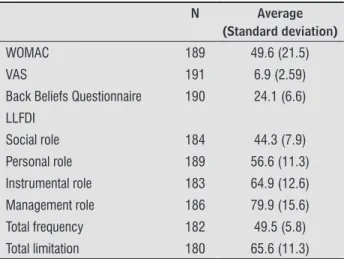
Table 2 - Characterization of the sample of clinical variables, beliefs and functional performance
N Average
(Standard deviation)
WOMAC 189 49.6 (21.5)
VAS 191 6.9 (2.59)
Back Beliefs Questionnaire 190 24.1 (6.6)
LLFDI
Social role 184 44.3 (7.9)
Personal role 189 56.6 (11.3) Instrumental role 183 64.9 (12.6)
Management role 186 79.9 (15.6)
Total frequency 182 49.5 (5.8)
Total limitation 180 65.6 (11.3)
67 Table 3 - Bivariate analysis of factors associated with LLFDI dimensions and areas
LLFDI Components and Domains
Performance frequency
Performance limitation
Social role Personal role Instrumental role
Management role Sex
F 48.5 (33.7-76.3) 63.4 (36.3-100) 43.6 (28.3-74.0) 53.8 (34.4-100) 62.3 (31.8-100) 78.3 (26.0-100) M 49.1 (38.1-58.0) 65.7 (51.8-89.3) 45.6 (33.3-60.3) 51.7 (38.9-73.8) 63.9 (52.2-88.9) 82. 9 (51.7-100)
Value p2 0.965 0.202* 0.407 0.078* 0.148* 0.634
Age
60 up to 74 48.8
(33.7 -70.6) 63.4 (36.3-100) 43.6 (28.3-70.3) 53.8 (34.5 -100) 62.3 (31.8-100) 82. 9 (26.0-100)
75 or more 47.6 (39.4-76.3) 62.0 (49.2-100) 41.1 (31.8-74.0) 51.7 (31.8-74.0) 62.3 (49.4-100) 74.5 (41.0-100)
Value p2 0.119* 0.650 0.110* 0.498 0.866 0.513
Marital Status
Single 47.9 (40.7-60.0) 65.6 (47.8-100) 44.3 (30.1-56.6) 56.3 (37.5-100) 64.4 (42.2-100) 82. 9 (41.0-100) Married/Living
with a partner 49.5 (38.1-70.6) 63.4 (49. 9-100) 44.9 (30.1-70.3) 53.8 (38.9-84.0) 62.3 (46.5-100) 78.3 (46.8-100)
Divorced 49.5 (42.0-61.1) 69.2 (36.3-100) 44.9 (30.1-64.7) 57. 8 (46.2-100) 66.6 (31.8-100) 86.2 (41.0-100)
Widower 47.56
(33.68-76.31)
60.62 (36.31-89.31)
42.39 (28.30-74.02)
53.84 (34.49-100)
60.40 (33.74-100)
78.32 (26.05-100)
Value p1 0.170* 0.025* 0.098* 0.483 0.026* 0.152*
Educational Level
Illiterate 45.1 (33.7-50.1) 59.0 (49.2-75.6) 37.3 (28.3-51.8) 47.0 (34.5-56.3) 58.6 (44.5 -74.1) 69.2 (63.9 -100) Elementary
School 48.8 (38.1-76.3) 62.6 (36.3-100) 42.4 (28.3-74.0) 53.8 (38.9-100) 61.3 (33.7-100) 78.3 (26.0-100) High School/
Technical Course 48.2 (42.0-61.1) 64.1 (52.5-100) 43.6 (31.8-64.7) 53.8 (37.5-84.0) 64.4 (46.5-100) 82. 9 (51.7-100) University
Degree/Post-Graduation
50.8 (41.4-70.6) 69.2 (36.3-100) 45.6 (30.1-70.3) 56.3 (43.2 -100) 65.5 (31.8-100) 86.2 (41.0-100)
Value p1 0.036* 0.088* 0.130* 0.061* 0.217 0.040*
Pain frequency
Not every day 48.5 (33.7-70.6) 66.4 (51.2-100) 42.4 (28.3-70.3) 55.1 (34.5-100) 67.8 (46.5-100) 80.6 (41.0-100) Every day 48.8 (38.1-76.3) 62.6 (36.3-100) 43.6 (28.3-74.0) 53.8 (37.5-100) 61.3 (31.8-100) 80.6 (26.0-100)
Value p2 0.834 0.051* 0.933 0.582 0.009* 0.729
Self-perception of health
Excellent/Very
Good 48.8 (41.4-70.6)
65.63 (49. 9-100)
42.4
(31.8 -70.38) 53.8 (43.2-100) 65.0 (50.4 -100) 82. 9 (46.8-100)
Good 49.8 (33.7-76.3) 64.8 (47.8-100) 44.9 (28.3-74.0) 56.3 (34.5-100) 64.4 (42.2-100) 82. 9 (26.0-100)
Bad 46.9 (39.4-65.1) 60.6 (36.3-100) 42.4 (28.3-62.4) 51.7 (37.5-84.0) 59.5 (31.8-100) 74.5 (34.2-100)
Value p1 0.024* 0.000* 0.088* 0.108* 0.000* 0.033*
Comorbidities
None 53.0 (42.6-76.3) 62.35 (56.2-80.0)
49.65
(33.3-74.0) 61.0 (41.7-100) 63.5 (53.1-79.0) 74.5 (67.5-100) 1 up to 3 48.8 (40.7-61.1) 64.8 (51.8-100) 44.9 (30.1-64.7) 53.8 (37.5-100) 64.4 (51.3-100) 82.9 (41.0-100) 4 or more 48.2 (33.7-65.1) 62.6 (36.3-100) 43.6 (28.3-64.7) 53.8 (34.5-100) 61.3 (31.8-100) 78.3 (26.0-100)
Value p1 0.436 0.217 0.237 0.363 0.130* 0.345
WOMAC (rho) -0.2 -0.2 -0.1 -0.0 -0.3 -0.2
Value p3 0.119* 0.001* 0.071* 0.861 0.000* 0.010*
68
Table 3 - Bivariate analysis of factors associated with LLFDI dimensions and areas
LLFDI Components and Domains
Performance frequency
Performance limitation
Social role Personal role Instrumental role
Management role
VAS (rho) -0.1 -0.1 -0.1 0.1 -0.1 -0.1
Value p3 0.406 0.068* 0.108* 0.140* 0.051* 0.214
Back Beliefs
Questionnaire (rho) 0.2 0.3 0.2 0.2 0.3 0.2
Value p3 0.001* 0.000* 0.017* 0.001* 0.000* 0.008*
Note: 1Kruskal-Wallis Test. 2Mann-Whitney Test. 3Spearman Correlation. *value p < 0.20 average (min – max)
Table 4 - Multiple linear regression models of factors associated with LLFDI dimensions and areas
LLFDI Components and Domains Standardized coefficients
Beta T P CI (95%)
Inferior Superior Performance frequency (R2 = 0.157; p = 0.002)
Constant 17.011 0.000 39.455 49.815
Re-codified marital status single -0.102 -1.315 0.190 -3.734 0.748
Re-codified marital status divorced -0.127 -1.636 0.104 -5.286 0.495
Re-codified marital status widower -0.072 -0.909 0.365 -2.981 1.101
Re-codified educational level illiterate -0.214 -2.927 0.004* -10.047 -1.953
Re-codified educational level High School -0.068 -0.881 0.380 -2.956 1.132
Re-codified educational level University Degree -0.005 -0.066 0.947 -2.714 2.538
Re-codified self-perception excellent 0.109 1.247 0.214 -1.033 4.576
Re-codified self-perception good 0.137 1.622 0.107 -0.345 3.518
WOMAC 0.050 0.644 0.521 -0.028 0.055
Back Beliefs 0.288 3.578 0.000* 0.114 0.396
Re-codified Age -0.101 -1.345 0.181 -3.639 0.690
Performance limitation (R2 = 0.201; p = 0.0001)
Constant 8.231 0.0001 41.454 67.620
Back Beliefs 0.219 2.688 0.008* 0.099 0.644
Re-codified sex 0.095 1.221 0.224 -1.903 8.078
Re-codified self-perception excellent 0.159 1.841 0.067 -0.364 10.397
Re-codified self-perception good 0.170 2.034 0.044* 0.111 7.480
Re-codified marital status single 0.052 0.651 0.516 -2.979 5.912
Re-codified marital status divorced 0.064 0.823 0.412 -3.223 7.829
Re-codified marital status widower -0.085 -1.026 0.306 -6.205 1.961
Re-codified educational level illiterate -0.048 -0.661 0.510 -10.251 5.110
Re-codified educational level High School 0.048 0.636 0.525 -2.610 5.093
Re-codified educational level University Degree 0.013 0.162 0.872 -4.518 5.326
Re-codified Pain Frequency -0.130 -1.772 0.078 -6.832 0.369
VAS 0.006 0.073 0.942 -0.684 0.737
WOMAC -0.087 -1.012 0.313 -0.135 0.043
(Conclusion)
69
Table 4 - Multiple linear regression models of factors associated with LLFDI dimensions and areas
LLFDI Components and Domains Standardized coefficients
Beta T P CI (95%)
Inferior Superior Social role (R2 = 0.142; p = 0.009)
Constant 11.047 0.000 33.791 48.496
Re-codified age -0.111 -1.466 0.145 -5.236 0.774
Re-codified marital status single -0.151 -1.899 0.059 -6.196 0.120
Re-codified marital status divorced -0.183 -2.336 0.021* -8.748 -0.734
Re-codified marital status widower -0.121 -1.491 0.138 -5.006 0.698
Re-codified educational level illiterate -0.172 -2.344 0.020* -12.274 -1.053
Re-codified educational level High School -0.012 -0.154 0.878 -3.061 2.618
Re-codified educational level University Degree -0.021 -0.262 0.794 -4.051 3.103
Re-codified self-perception excellent 0.101 1.138 0.257 -1.649 6.140
Re-codified self-perception good 0.138 1.633 0.104 -0.457 4.839
Back Beliefs 0.221 2.719 0.007* 0.074 0.464
VAS 0.039 0.470 0.639 -0.394 0.639
WOMAC -0.050 -0.569 0.570 -0.082 0.045
Personal role (R2 = 0.114; p = 0.005)
Constant 8.375 0.000 35.895 58.023
Re-codified sex -0.075 -1.029 0.305 -7.477 2.352
Re-codified educational level illiterate -0.154 -2.158 0.032* -16.576 -0.741
Re-codified educational level High School -0.094 -1.249 0.213 -6.353 1.428
Re-codified educational level University Degree 0.025 0.331 0.741 -4.145 5.817
Re-codified self-perception excellent 0.068 0.805 0.422 -3.193 7.595
Re-codified self-perception good 0.078 0.957 0.340 -1.877 5.412
VAS 0.086 1.160 0.247 -0.262 1.010
Back Beliefs 0.228 3.009 0.003* 0.135 0.650
Instrumental role (R2 = 0.203; p = 0.0001)
Constant 5.881 0.000 34.496 69.358
Re-codified sex 0.118 1.540 0.125 -1.220 9.884
Re-codified marital status single 0.081 1.038 0.301 -2.308 7.428
Re-codified marital status divorced 0.080 1.050 0.295 -2.856 9.346
Re-codified marital status widower -0.077 -0.960 0.339 -6.637 2.295
Re-codified self-perception excellent 0.158 1.850 0.066 -0.377 11.629
Re-codified self-perception good 0.189 2.338 0.021* 0.737 8.732
Re-codified Pain Frequency -0.146 -2.050 0.042* -8.129 -0.153
VAS 0.010 0.126 0.900 -0.735 0.835
WOMAC -0.091 -1.062 0.290 -0.153 0.046
Back Beliefs 0.216 2.756 0.006* 0.117 0.705
Re-codified Comorbidities -0.004 -0.053 0.958 -3.419 3.242
Note: *p < 0.05
70
Discussion
The results showed an association between beliefs regarding the consequences of low back pain, self-perception of health, level of education, frequency of pain and marital status with the functional performance of elderly with low back pain.
Beliefs were related to the frequency and limitation dimensions and their respective role domains, with the exception of the management role. This result suggests that older adults with low back pain who have more negative beliefs regarding the consequences of this condition have worse functional performance, performing their activities with less frequency and greater limitation.
In another study, individuals of different ages with chronic low back pain had more organic beliefs related to low back pain than those who did not report pain. Organic belief is related to concepts of disease, damage and loss. The authors argue that this belief means that individuals do not perform exercises that would be beneficial because this recommendation is contrary to what they believe (24), which impacts on the functional performance of these individuals, and may explain the result presented above.
The older adults in this study who had more positive beliefs regarding low back pain presented fewer limitations, indicating that they have a better ability to cope with the adversities brought by the condition. This result can be reinforced by a study that evaluated the relation of beliefs of older adults about old-age and disability recovery. Those with positive beliefs were found to be 44% more likely to recover (25).
Another result found was the correlation of positive self-perception of health with a smaller limitation for accomplishing activities. Like LLFDI, self-perception of health has a multidimensional structure, and it is associated with factors of the individual's context such as socioeconomic situation, social support network, health conditions and the use of health services (22, 26), which explains the correlation found. Both enable individuals to consider several factors when assessing their health condition and limitations. Another possible explanation is the relation between health self-perception and coping capacity. In a study of older adults without a specific health condition, the assessment of the severity and relevance of a health problem was more associated with the possibility of facing it than with the problem itself (27). In this
study, the elderly who classified their health as good or excellent presented fewer limitations, that is, they dealt better with the difficulties of lower back pain than those who considered they had poor health.
The results indicated that low levels of education are associated with a lower frequency of activities, regardless of whether they are related to the social or personal roles of the elderly. A review in 2001 summarizing scientific evidence of the relationship between educational level and low back pain corroborates this finding. The authors put forward some hypotheses to explain the result: individuals with low levels of education may live in environments with more difficulties, may be less able to adapt to adversities and have less access to information and guidance regarding their health condition (28).
Despite the fact that a 2009 study indicated educational level as the best predictor of beliefs regarding the consequences of low back pain, as individuals with higher education had more positive beliefs and better adapted to the consequences of low back pain (29), individuals in this study with lower levels of education did not report more limitations during the activities. It can be assumed that elderly with less education are less aware of their health condition and thus, do not report limitations (30).
The results showed that marital status is associated to the performance frequency of the activities that integrate the social role. In this study, widowers presented worse performance, a result corroborated by the study by Schoenborn (31), in which 69.9% of elderly widowers presented limitations in physical and social functioning. It should be emphasized that activities that integrate the social role involve a network of relationships of the individual, which may be diminished due to the loss of the spouse.
Pain frequency was related to the performance limitation in instrumental role activities, which require physical abilities (22). This finding was also demonstrated in a study conducted with community older adults in which the frequency of low back pain was associated with a perceived difficulty in performing activities that required physical effort, such as heavy housework (10).
71 In this study, the variables age and sex were not
related to functional performance, contrary to what was presented in other research with the elderly (10, 32). Similar results were found in the study by Candotti et al. conducted with adults and elderly persons who had back pain (33).
There was also no significant relationship between performance in activities and intensity of pain and number of comorbidities. One possible explanation can be attributed to LLFDI's characteristic of asking about disabilities without a direct link to health. The instrument is based on a conceptual model that understands disability as the result of an interaction between the individual and the environment, which involves a broad set of social and cultural components. A study comparing the effects of using attributed and non-attributed health questions on the LLFDI limitation dimension score demonstrated that when there was no attribution to health individuals reported more disabilities, indicating the importance of other factors in addition to health in carrying out daily activities (34).
As a limitation to this study, it is worth highlighting the recruitment of health service participants, who may have selected elderly individuals with specific functional characteristics, as well as the predominance of the female sex in the sample, which reduced generalization of the results. In addition, the BACE project included a much broader spectrum of assessments than those used in the present investigation. Subsequent studies may make use of other collected information such as physical assessment data.
In conclusion, the functional performance of older adults with low back pain presented a relationship of modest magnitude with beliefs, self-perception of health, level of education, marital status and frequency of pain. The knowledge of these results can contribute to improving the evaluations and the interventions of health professionals, expanding its focus of action beyond the clinical aspects aimed at valuing the beliefs and self-perception of health of older adults.
Acknowledgements
To the BACE team, and to the professionals of the following institutions: Ambulatory Bias Fortes/
HC-UFMG (Ambulatório Bias Fortes/HC-UFMG), Jenny de Andrade Faria Institute/HC-UFMG (Instituto Jenny de Andrade Faria/HC-UFMG), Risoleta Tolentino Neves Hospital (Hospital Risoleta Tolentino Neves) and Social Welfare Hospital/ IPSEMG (Hospital da Previdência/IPSEMG).
Financial Support: National Council for Scientific and Technological Development (CNPq – Conselho
Nacional de Desenvolvimento Cientifico e Tecnológico).
Process N. 471264/2010-5; Minas Gerais Research Support Foundation (FAPEMIG – Fundação de Amparo
à Pesquisa de Minas Gerais). Process
APQ-01565-13; Coordination of Support to Higher Education Personnel (CAPES – Coordenadoria de Apoio ao Pessoal de Ensino Superior).
References
1. Woolf AD, Pfleger B. Burden of major musculoskeletal conditions. Bull World Health Organ. 2003;81(9):646-56.
2. Hoy D, Bain C, Williams G, March L, Brooks P, Blyth F, et al. A systematic review of the global prevalence of low back pain. Arthritis Rheum. 2012;64(6):2028-37.
3. Dionne CE, Dunn KM, Croft PR, Nachemson AL, Buchbinder R, Walker BF, et al. A consensus approach toward the standardization of back pain definitions for use in prevalence studies. Spine. 2008;33(1):95-103.
4. van Tulder M, Becker A, Bekkering T, Breen A, del Real MT, Hutchinson A, et al. Chapter 3. European guidelines for the management of acute nonspecific low back pain in primary care. Eur Spine J. 2006;15(Suppl 2):169-91.
5. Gilkey DP, Keefe TJ, Peel JL, Kassab OM, Kennedy CA. Risk factors associated with back pain: a cross-sectional study of 963 college students. J Manipulative Physiol Ther. 2010;33(2):88-95.
6. Balagué F, Mannion AF, Pellisé F, Cedraschi C. Clinical update: low back pain. Lancet. 2007;369(9563):726-8.
72
8. Hicks GE, Gaines JM, Shardell M, Simonsick EM. Associations of back and leg pain with health status and functional capacity of older adults: findings from the retirement community back pain study. Arthritis Rheum (Arthritis Care & Research). 2008;59(9):1306-13.
9. Ledoux E, Dubois JD, Descarreaux M. Physical and psychosocial predictors of functional trunk capacity in older adults with and without low back pain. J Manipulative Physiol Ther. 2012;35(5):338-45.
10. Weiner DK, Haggerty CL, Kritchevsky SB, Harris T, Simonsick EM, Nevitt M, et al. How does low back pain impact physical function in independent, well-functioning older adults? Evidence from the health ABC cohort and implication for the future. Pain Med. 2003;4(4):311-20.
11. Weiner DK, Rudy TE, Kim YS, Golla S. Do medical factors predict disability in older adults with persistent low back pain? Pain. 2004;112(1-2):214-20.
12. Elfering A, Mannion AF, Jacobshagen N, Tamcan O, Müller U. Beliefs about back pain predict the recovery rate over 52 consecutive weeks. Scand J Work Environ Health. 2009;35(6):437-45.
13. Smith AJ, O’Sullivan PB, Beales D, Straker L. Back pain beliefs are related to the impact of low back pain in 17-year-olds. Phys Ther. 2012;92(10):1258-67.
14. Alves LC, Rodrigues RN. Determinantes da autopercepção de saúde entre idosos do Município de São Paulo, Brasil. Rev Panam Salud Publica. 2005;17(5-6):333-41.
15. Scheele J, Luijsterburg PAJ, Ferreira ML, Maher CG, Pereira L, Peul WC, et al. Back Complaints in the Elders (BACE); design of cohort studies in primary care: an international consortium. BMC Musculoskeletal Disorders. 2011;12(193):1-9.
16. Bertolucci PHF, Brucki SMD, Campacci SR, Juliano Y. O mini-exame do estado mental em uma população geral: impacto da escolaridade. Arq Neuropsiquiatr. 1994;52(1):1-7.
17. Andrade FA, Pereira, LV, Sousa FAEF. Mensuração da dor no idoso: uma revisão. Rev Latino-Am Enfermagem. 2006;14(2):271-6.
18. Fernandes MI. Tradução e validação do questionário de qualidade de vida específico para osteoartrose WOMAC (Western Ontario McMaster Universities) para a língua portuguesa [master´s thesis]. São Paulo: Universidade Federal de São Paulo; 2003.
19. Wolfe F. Determinants of WOMAC function, pain and stiffness score: evidence for the role of low back pain, symptom counts, fatigue and depression in osteoarthritis, rheumatoid arthritis and fibromyalgia. Rheumatology. 1999;38(4):355-61.
20. Symonds TL, Burton AK, Tillotson KM, Main CJ. Do attitudes and beliefs influence work loss due to low back trouble? Occup Med. 1996;46(1):25-32.
21. Teixeira LF. Atitudes e crenças sobre dor lombar em idosos da comunidade: dados do estudo BACE [dissertation]. Belo Horizonte: Universidade Federal de Minas Gerais; 2015.
22. Jette AM, Haley SM, Coster WJ, Kooyoomjian JT, Levenson S, Heeren T, et al. Late life function and disability instrument: I. Development and evaluation of the disability component. J Gerontol A Biol Sci Med Sci. 2002;57(4):M209-16.
23. Cardoso AP, Mancini MC, Guerra FP, Pereira LSM, Assis MG. Confiabilidade do Late-Life Function and Disability Instrument (LLFDI) versão português do Brasil em amostra de idosos com alta escolaridade. Cad Ter Ocup. 2015;23(2):237-50.
24. Sloan TJ, Gupta R, Zhang W, Walsh DA. Beliefs about the causes and consequences of pain in patients with chronic inflammatory or noninflammatory low back pain and in pain-free individuals. Spine. 2008;33(9):966-72.
25. Levy BR, Slade MD, Murphy TE, Gill TM. Association between positive age stereotypes and recovery from disability in older persons. JAMA. 2012;308(19):1972-3.
26. Lima-Costa MF, Firmo JOA, Uchôa E. A estrutura da auto-avaliação da saúde entre idosos: projeto Bambuí. Rev Saúde Pública. 2004;38(6):827-34.
73 28. Dionne CE, Von Korff M, Koepsell TD, Deyo RA,
Barlow WE, Checkoway H. Formal education and back pain: a review. J Epidemiol Community Health. 2001;55(7):455-68.
29. Bowey-Morris J, Davis S, Purcell-Jones G, Watson PJ. Beliefs about back pain Results of a population survey of working age adults. Clin J Pain. 2011;27(3):214-24.
30. Hacihasanoglu R, Yildirim A, Karakurt P. Loneliness in elderly individuals, level of dependence in activities of daily living (ADL) and influential factors. Arch Gerontol Geriatr. 2012;54(1):61-6.
31. Schoenborn CA. Marital status and health: United States, 1999-2002. Adv Data. 2004;(351):1-32.
32. Ribeiro PCC, Neri AL, Cupertino APFB, Yassuda MS. Variabilidade no envelhecimento ativo segundo gênero, idade e saúde. Psicol Estud. 2009;14(3):501-9.
33. Candotti CT, Noll M, Marchetti BV, Rosa BN, Medeiros MGS, Vieira A, et al. Prevalence of back pain, functional disability and spinal postural changes. Fisioter Mov. 2015;28(4):711-22.
34. Dubuc N, Haley SM, Kooyoomjian JT, Jette AM. Assessing disability in older adults: the effects of asking questions with and without health attribution. J Rehabil Med. 2004;36(5):226-31.
Received in 03/31/2016 Recebido em 31/03/2016