Revista Brasileira de
Engenharia Agrícola e Ambiental
Campina Grande, PB, UAEA/UFCG – http://www.agriambi.com.br
v.22, n.10, p.667-672, 2018
A proposed index to assess quality of waters from desalination plants
DOI: http://dx.doi.org/10.1590/1807-1929/agriambi.v22n10p667-672Francisco P. de S. Antas
1, Jair J. R. de Freitas
2, André M. de Oliveira
3,
Nildo da S. Dias
4, Alexandre de O. Lima
5& Osvaldo N. de Sousa Neto
6A B S T R A C T
Reverse osmosis is the technology commonly used to produce fresh water from brackish groundwater. Due to the reject brine generated in desalination plants by reverse osmosis, vulnerability assessment to define critical areas to monitor waters from desalination has been an important tool for delineating the monitoring networks required for surveillance of potential salinization sites. The objective of this study was to assess the quality of waters sampled in desalination plants by a quality index, which provides a relative assessment of water vulnerability to potential salinization. The present study proposes an index to assess the quality of waters from desalination plants initially using the chemical parameters electrical conductivity, sodium adsorption ratio, Mg2+/Ca2+ ratio, and the ions sodium, chloride and
bicarbonate. The index to assess quality of waters from desalination plants showed good performance and can include additional parameters referring to the soil and crop exploited. High values of the relative index of quality of waters from desalination plants are considered as possible indicators of risk of soil salinization and groundwater contamination. The highest level of land use impact on the quality of waters from desalination plants was found in reject brine samples followed by well water samples.
Proposta de índice para avaliação da qualidade
das águas de estações de dessalinização
R E S U M O
A osmose reversa é uma tecnologia amplamente conhecida para purificar as águas dos poços salinos. Devido à geração do rejeito salino nas estações de dessalinização por osmose reversa, a avaliação da vulnerabilidade para definir as áreas críticas de monitoramento das águas do processo de dessalinização tem sido uma ferramenta importante para delinear as redes de monitoramento necessárias para a vigilância de possíveis locais de salinização. Objetivou-se neste estudo avaliar a qualidade das águas amostradas em estações de dessalinização na Mesorregião do Oeste Potiguar Brasileiro por meios de um índice de qualidade capaz de fornecer uma avaliação relativa da vulnerabilidade das águas ao potencial de salinização. O presente estudo propõe um índice de avaliação da qualidade das águas das estações de dessalinização utilizando inicialmente os parâmetros químicos condutividade elétrica, relação de adsorção de sódio, relação Mg2+/Ca2+ e os íons sódio, cloreto e bicarbonato. O
índice de avaliação da qualidade das águas das estações de dessalinização apresentou bom desempenho, podendo ser acrescido de parâmetros referentes ao solo e à cultura explorada. Os altos valores de índice relativo de qualidade das águas das estações de dessalinização são apontados como indicadores de possíveis riscos de salinização de solos e de contaminação de aquíferos subterrâneos. O maior grau de impacto do uso da terra em consequência da qualidade das águas de estações de dessalinização foi registrado em amostras de rejeito salino seguidas das águas de poços.
Key words: soil salinization brackish well water
groundwater contamination
Palavras-chave: salinização do solo água de poço salino
contaminação do lençol freático
1 Instituto Federal de Educação Ciência e Tecnologia do Rio Grande do Norte. Currais Novos, RN. E-mail: [email protected] - ORCID: 0000-0002-1758-1660 2 Universidade Federal Rural do Semi-Árido. Mossoró, RN. E-mail: [email protected] (Corresponding author) - ORCID: 0000-0001-8158-2724 3 Universidade Federal Rural do Semi-Árido/Campus Caraúbas/Departamento de Ciência e Tecnologia. Caraúbas, RN. E-mail: [email protected] -
ORCID: 0000-0003-4083-1821
4 Universidade Federal Rural do Semi-Árido/Departamento de Ciências Agronômicas e Florestais. Mossoró, RN. E-mail: [email protected] - ORCID:
0000-0002-1276-5444
5 Universidade do Estado do Rio Grande do Norte/Departamento de Gestão Ambiental. Mossoró, RN. E-mail: [email protected] - ORCID:
0000-0003-3756-5921
6 Universidade Federal Rural do Semi-Árido/Campus Angicos/Departamento de Engenharias. Angicos, RN. E-mail: [email protected] - ORCID:
0000-0002-6256-4333
Introduction
In the semi-arid region, due to the irregular rainfall regime, agricultural production is limited because the low rainfall levels do not meet crop water needs; thus, the adoption of irrigation becomes necessary (Andrade et al., 2012; Silva et al., 2014). As a guarantee of food and nutritional security for rural families, groundwater is used for consumption and in agricultural production. However, most of these sources of water have restrictions on use due to salinity.
However, applying the technology of desalination by reverse osmosis allows the utilization of saline and brackish waters, which can then be used for human consumption (Dias et al., 2010), despite the production of reject brine as a limiting factor (Bush et al., 2016; Khanzadaa et al., 2017).
Thus, the vulnerability assessment to define critical areas for monitoring waters from the desalination process is an important tool to delineate the monitoring networks for the surveillance of possible sites of salinity in localities which have treatment stations to purify the waters.
Tyagi et al. (2013) claim that quality indices aim to provide a single value for the quality of a water source, because it reduces the number of parameters in a simple expression, resulting in easy interpretation of water quality monitoring data. Despite this advantage, no index has been universally accepted and they need to be adapted to the local specific conditions (Rodrigues et al., 2007).
Taking these aspects into consideration, this study aimed to evaluate the quality of waters sampled in desalination plants in the Oeste Potiguar mesoregion, RN, Brazil, using a quality index capable of providing a relative assessment of the vulnerability of the waters to potential salinization.
Material and Methods
Sample collection was conducted from October 2013 to November 2014 in seven communities of the Oeste Potiguar Mesoregion, Rio Grande do Norte state, Brazil (Figure 1), with units of water sampling and treatment by desalination.
The climate in this region can be classified as Bsw’h’. Regarding rain distribution, there are two well-defined seasons and a period of expected rains which extends from January to May, with mean annual rainfall of 612.4 mm, mean temperature of 26.1 °C, minimum of 21.2 °C and maximum 32.0 °C, and a potential evapotranspiration of 1,552.40 mm year-1 (SEMARH,
2009).
All water samples were collected in four sampling periods in the desalination plants of seven communities: Boa Fé - Mossoró; Alagoinha - Mossoró; Lagoa Rasa - Apodi; Juazeiro - Apodi; Alagoinhas - Pau dos Ferros; Jacu - Francisco Dantas, and Ema - José da Penha (Figure 1).
The samples were collected in four periods, at 3-month intervals, in each community, in order to represent and cover all seasons of the year, observing the behavior of the alterations in the waters: P1 – October/November (2013), dry period with virtually no rains; P2 – February/March (2014), beginning of rainy period; P3 – June/July (2014), end of rainy period, and P4 – October/November (2014), completing the 12-month cycle, again in the dry period.
Water from three sources were collected in each community: brackish well water – without any treatment; purified waters and reject brine. The collections were carried out after the desalinator had been in operation for 5 min. The samples were stored in 500-mL opaque plastic bottles, hermetically sealed, which were placed in thermal box with ice and taken
for laboratory analysis at the Federal Rural University of the Semi-Arid – UFERSA.
The following parameters were evaluated: electrical conductivity (EC, dS m-1), hydrogen potential (pH),
concentrations of sodium (Na+), calcium (Ca2+), magnesium
(Mg2+), potassium (K+), chloride (Cl-), carbonate (CO 3
2-)
and bicarbonate (HCO3-) in mmol c L
-1, according to the
methodology proposed by Richards (1954). Additionally, sodium adsorption ratio (SAR) was also calculated to classify the samples with respect to the risk of sodification and problems of infiltration in the soil caused by water sodicity.
To analyze the data, 11 indicators of irrigation water quality were studied, which were used to determine the water quality indices. The results of these analyses were entered into a spreadsheet, whereas statistical analyses were carried out using the program Action Stat®. To evaluate well water, desalinised water and reject brine, the samples were classified using the Excel® application, considering the guidelines of FAO. The
quality of the water for irrigation aiming its agricultural use and adequate irrigation management was evaluated according to the methodology proposed by Ayers & Westcott (1999).
The relative index to assess water quality for irrigation (IRQI) was designed based on the IRQ (Fernandes & Loureiro, 2006), considering the parameters electrical conductivity, SAR, concentrations of sodium, chloride and bicarbonate and the Mg2+/Ca2+ ratio, because these parameters are related to the
problems of salinity, toxicity and infiltration.
The maximum value allowed (MVA) was adopted as 0.7 dS m-1 for EC, 3.0 (mmol L-1)0.5 for SAR, 3.0 mmol
c L -1 for
Cl-, 1.5 mmol c L
-1 for HCO 3
- and 1 for Mg2+/Ca2+ ratio, since
these are the values below which there is no restriction to use the water for irrigation, according to Ayers & Westcott (1999).
Results and Discussion
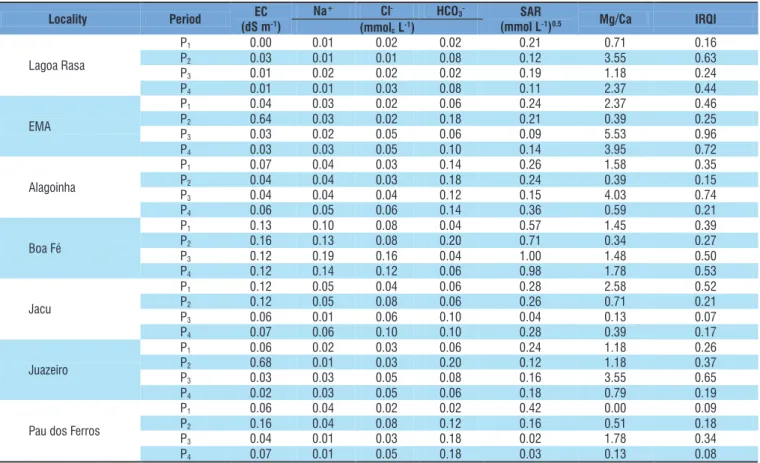
Tables 1, 2 and 3 illustrate the data of water quality according to the indices of the parameters. The more distant from the ideal value, which is zero, the worse the quality of the water. For desalinised water, the lowest index of the parameters occurred for EC in Lagoa Rasa and Pau dos Ferros (0, in P1), while the highest index was found for Mg2+/Ca2+ ratio (5.53)
in the EMA community in P3.
This parameter was preponderant for this sample to exhibit the highest IRQI for desalinised water (0.96). Lagoa Rasa and Pau dos Ferros had the largest number of parameters with minimum index, whereas Boa Fé had more parameters with the highest value for Vi, in sodium, chloride and SAR in P3 (0.19, 0.16 and 1.00, respectively) and for bicarbonate in P2 (0.20) (Table 1).
Except for the index already cited relative to EMA, all samples of desalinised water obtained indices lower than 1. In 57.14% of the samples, the Vi index of the Mg2+/Ca2+ ratio
was higher than 1, requiring attention in this regard since the higher this index, the lower the proportion of Ca in relation to Mg. According to Ayers & Westcott (1999), the lower this proportion, the higher the probability of occurrence of infiltration problems due to the intensification of the dispersing effects of Na, compared with the flocculating effect of Ca. In addition, crop yield seems to be lower in soils with high contents of Mg, or when irrigation is conducted using waters with high levels of this element, even when infiltration is adequate. Maia & Rodrigues (2012), proposing a water quality index, reported that yield loss is due to Ca deficiency induced by the excess of exchangeable Mg in the soil.
P1 – First sampling period; P2 – Second sampling period; P3 – Third sampling period; P4 – Fourth sampling period
Locality Period EC
(dS m-1)
Na+ Cl- HCO
3- SAR
(mmol L-1)0.5 Mg/Ca IRQI
(mmolcL-1)
Lagoa Rasa
P1 0.00 0.01 0.02 0.02 0.21 0.71 0.16
P2 0.03 0.01 0.01 0.08 0.12 3.55 0.63
P3 0.01 0.02 0.02 0.02 0.19 1.18 0.24
P4 0.01 0.01 0.03 0.08 0.11 2.37 0.44
EMA
P1 0.04 0.03 0.02 0.06 0.24 2.37 0.46
P2 0.64 0.03 0.02 0.18 0.21 0.39 0.25
P3 0.03 0.02 0.05 0.06 0.09 5.53 0.96
P4 0.03 0.03 0.05 0.10 0.14 3.95 0.72
Alagoinha
P1 0.07 0.04 0.03 0.14 0.26 1.58 0.35
P2 0.04 0.04 0.03 0.18 0.24 0.39 0.15
P3 0.04 0.04 0.04 0.12 0.15 4.03 0.74
P4 0.06 0.05 0.06 0.14 0.36 0.59 0.21
Boa Fé
P1 0.13 0.10 0.08 0.04 0.57 1.45 0.39
P2 0.16 0.13 0.08 0.20 0.71 0.34 0.27
P3 0.12 0.19 0.16 0.04 1.00 1.48 0.50
P4 0.12 0.14 0.12 0.06 0.98 1.78 0.53
Jacu
P1 0.12 0.05 0.04 0.06 0.28 2.58 0.52
P2 0.12 0.05 0.08 0.06 0.26 0.71 0.21
P3 0.06 0.01 0.06 0.10 0.04 0.13 0.07
P4 0.07 0.06 0.10 0.10 0.28 0.39 0.17
Juazeiro
P1 0.06 0.02 0.03 0.06 0.24 1.18 0.26
P2 0.68 0.01 0.03 0.20 0.12 1.18 0.37
P3 0.03 0.03 0.05 0.08 0.16 3.55 0.65
P4 0.02 0.03 0.05 0.06 0.18 0.79 0.19
Pau dos Ferros
P1 0.06 0.04 0.02 0.02 0.42 0.00 0.09
P2 0.16 0.04 0.08 0.12 0.16 0.51 0.18
P3 0.04 0.01 0.03 0.18 0.02 1.78 0.34
P4 0.07 0.01 0.05 0.18 0.03 0.13 0.08
Table 2. Indices of the deviations in the indicators for brackish well water
Locality Period EC
(dS m-1)
Na+ Cl- HCO
3- SAR
(mmol L-1)0.5 Mg/Ca IRQI
(mmolcL-1)
Lagoa Rasa
P1 0.39 0.45 0.13 0.86 1.01 0.49 0.56
P2 0.44 0.48 0.16 1.57 0.99 0.74 0.73
P3 0.23 0.33 0.15 1.55 0.78 0.61 0.61
P4 0.38 0.88 0.17 1.55 2.16 0.41 0.92
EMA
P1 0.86 0.74 0.58 1.49 1.27 0.77 0.95
P2 1.04 0.99 0.51 2.66 1.58 0.88 1.27
P3 0.77 2.46 0.47 1.82 3.98 1.64 1.86
P4 0.79 2.33 0.49 1.90 3.71 1.47 1.78
Alagoinha
P1 0.43 0.17 0.24 1.02 0.33 0.36 0.43
P2 0.50 0.18 0.28 1.33 0.28 0.44 0.50
P3 0.43 0.37 0.24 1.02 0.68 0.36 0.52
P4 0.41 0.37 0.23 1.02 0.68 0.34 0.51
Boa Fé
P1 2.47 1.68 2.47 0.45 1.39 0.35 1.47
P2 2.55 1.75 2.45 1.02 1.39 0.32 1.58
P3 2.47 2.16 2.73 0.69 1.63 0.70 1.73
P4 2.28 3.59 2.53 0.88 2.35 0.79 2.07
Jacu
P1 1.01 0.55 0.89 0.76 0.75 0.14 0.68
P2 1.04 0.55 0.90 0.78 0.73 0.12 0.69
P3 0.07 0.05 0.09 0.08 0.15 1.28 0.29
P4 0.92 1.34 0.84 0.76 1.47 0.51 0.97
Juazeiro
P1 0.80 0.33 0.74 0.31 0.42 0.59 0.53
P2 0.92 0.41 0.79 0.47 0.52 0.26 0.56
P3 0.12 0.13 0.11 0.10 0.36 0.99 0.30
P4 0.78 0.75 1.15 0.57 0.81 0.72 0.79
Pau dos Ferros
P1 0.84 0.49 0.41 0.65 0.64 0.61 0.60
P2 0.92 0.49 0.54 1.63 0.33 0.63 0.76
P3 0.23 0.66 0.15 0.06 1.44 1.78 0.72
P4 0.39 1.03 0.18 0.94 2.02 2.12 1.11
P1 – First sampling period; P2 – Second sampling period; P3 – Third sampling period; P4 – Fourth sampling period
Table 3. Indices of the deviations of the indicators for reject brine
Locality Period EC
dS m-1
Na+ Cl- HCO
3- SAR
(mmol L-1)0.5 Mg/Ca IRQI
mmolcL-1
Lagoa Rasa
P1 0.59 0.67 0.19 1.45 1.41 0.52 0.81
P2 0.72 0.85 0.28 3.07 1.63 0.77 1.22
P3 0.46 0.58 0.24 1.43 1.22 0.52 0.74
P4 0.52 1.26 0.23 2.21 2.57 0.80 1.26
EMA
P1 1.19 1.03 0.78 1.86 1.55 1.14 1.26
P2 1.39 1.25 0.70 3.88 1.74 1.05 1.67
P3 0.96 3.15 0.57 2.47 4.57 0.28 2.00
P4 1.00 3.02 0.63 2.82 4.46 0.34 2.05
Alagoinha
P1 0.61 0.29 0.34 1.33 0.45 0.11 0.52
P2 0.80 0.24 0.39 2.13 0.33 0.23 0.69
P3 0.60 0.85 0.36 1.23 1.15 1.53 0.95
P4 0.60 0.67 0.37 2.00 0.87 0.90 0.90
Boa Fé
P1 3.35 1.91 3.52 0.49 1.53 0.98 1.96
P2 3.71 2.54 3.83 1.23 1.67 0.42 2.23
P3 2.91 2.61 3.33 0.29 1.68 0.86 1.95
P4 3.01 4.74 3.14 1.43 2.85 0.63 2.63
Jacu
P1 2.48 1.91 2.32 1.43 1.84 0.15 1.69
P2 2.51 1.95 2.14 1.72 1.86 0.15 1.72
P3 0.09 0.13 0.13 0.08 0.37 1.05 0.31
P4 1.69 2.02 2.33 1.12 1.64 1.10 1.65
Juazeiro
P1 1.18 0.45 1.03 0.41 0.49 0.36 0.66
P2 1.27 0.59 1.06 0.61 0.64 0.36 0.76
P3 0.78 0.99 0.74 0.29 1.25 0.69 0.79
P4 1.08 1.04 1.42 0.51 0.96 0.72 0.95
Pau dos Ferros
P1 0.89 0.55 0.44 0.51 0.73 0.81 0.66
P2 5.50 3.35 4.29 5.82 1.98 0.64 3.60
P3 0.28 1.04 0.26 0.10 1.86 2.28 0.97
P4 0.69 1.72 0.31 1.33 2.64 2.37 1.51
P1 – First sampling period; P2 – Second sampling period; P3 – Third sampling period; P4 – Fourth sampling period
For brackish well water, the indices of the deviations in the indicators remained between 0.05 for Na in P3 in Jacu and 3.98 for SAR in P3 in EMA. The Jacu sample in the
This community and period also had the lowest value of IRQI among the samples of brackish well water (0.29). Oliveira et al. (2017) classified the water of this well as with no risk of salinity and toxicity by sodium and chlorides, but with accentuated risk of infiltration problems due to its EC, compared with the SAR.
Boa Fé had the highest indices of the deviations for EC (2.55 dS m-1 in P
2), sodium (3.59 mmolc L -1 in P
4) and
bicarbonates (2.73 mmolc L-1 in P
4), besides the highest IRQI for
brackish well water (2.07 in P4). This community has the highest EC values for well water, varying from 5.72 to 6.40 dS m-1, which
prevents its use, expect under technical management conditions such as: mixture of waters and utilization in hydroponic systems.
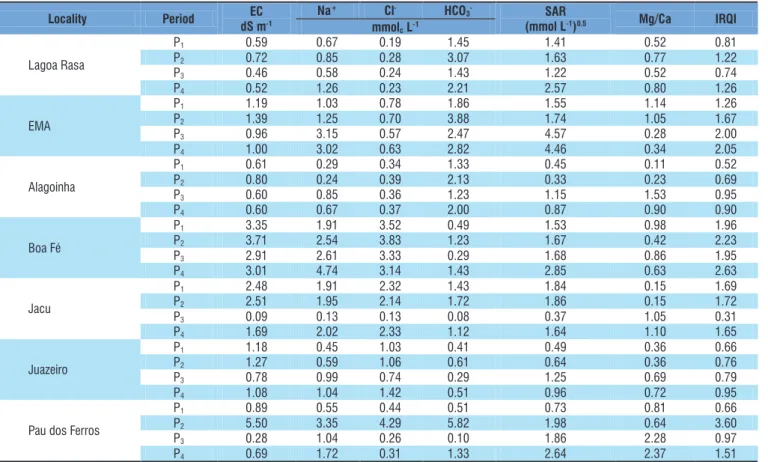
For reject brine, the lowest indices were found in Jacu in P3 (EC, sodium, chloride and bicarbonate) and in Alagoinha (SAR in P2 and Mg2+/Ca2+ in P
1), whereas Pau dos Ferros in P2
had the highest indices for EC, chloride and bicarbonate (P2) and Mg2+/Ca2+ (P
4), and EMA had the highest value for SAR
(P3). In general, these waters are inadequate for use in irrigation due to their high salinity levels (Table 3).
In similar study, Anders (2013) claimed that, among the analyzed samples of reject, 60% showed extreme risk of soil salinization by irrigation, whereas the remaining 40% were classified as with high risk of soil contamination by the excess of soluble salts. Thus, they were not adequate for irrigation under normal conditions and could only be used under special conditions of soils with good drainage, provided that special practices to control salinity are applied, such as leaching fraction, and salt-tolerant crops are used.
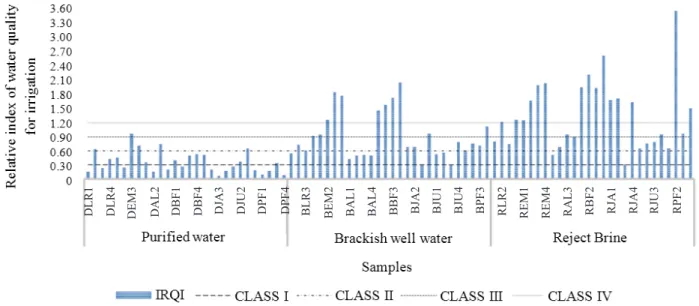
The behavior of IRQI for the analyzed samples is represented in Figure 2. The samples were divided into five classes, namely: Class I, Class II, Class III and Class IV. Class I, comprising waters with IRQI lower than 0.3, has 17.86% of all samples. This class has waters of lower environmental impact and that do not have significant loss of quality. Approximately 50% of desalinised water samples and 4% of brackish well water samples are found in this class. These waters have good quality and low environmental impact, for instance, the desalinised
water of Alagoinha in P2 and brackish well water of the Jacu community in P3.
Class II contains waters with 0.3 < IRQI < 0.6 comprising 21.43% of all samples; 32.14% of desalinised water samples, 28.57% of brackish well water samples and 7.14% of reject brine samples. Samples in this class have lower quality than those in Class I and require more attention to management and use conditions since they already pose moderate environmental risk. The only samples of reject brine classified in this group were collected in the Jacu community in P3 and Alagoinha in the first sampling period.
Among the 84 samples analyzed, 23.81% are in Class III, with IRQI from 0.6 to 0.9. 14.29% of desalinised water samples, 28.57% of brackish well water samples and 28.57% of reject brine samples fit in this classification. This class has significant loss of quality in relation to the ideal standard, which requires very specific conditions for its application in irrigation, such as crops resistant to toxicity and to salinity and soils with efficient drainage. The Class IV comprises values from 0.9 to 1.2 with extremes for IRQI, containing 9.52% of all samples; 3.57% of purified water, 14.29% of brackish well water and 10.71% of reject brine. Waters in this class are highly risky to be used in irrigation because they can cause damages to the soil and reduce crop yield.
The Class V comprises waters with IRQI higher than 1.2. This class contains 26.19% of all samples; 25% of brackish water samples and 53.57% of reject brine samples. Waters in this group have lower quality since this is the group with values furthest from the ideal IRQI, which is zero. These waters can be used under extremely specific conditions, such as hydroponic cultivation, because of their high salinity level, which increases the osmotic potential and hinders water absorption by crops, besides depositing large amount of salts in the soil.
Water quality indices have been reported by various authors as a beneficial tool to assess the level of land use impact on the quality of waters from different sources (Pesce & Wunderlin, 2000; Swamee & Tyagi, 2000; Liou et al., 2004; Tyagi et al., 2013).
D, B, R – Water sources; LR - Lagoa rasa; EM – Ema; AL – Alagoinha; BF - Boa fé; JA – Jacu; JU – Juazeiro; PF - Pau dos Ferros
Figure 2. Behavior of the relative index of water quality for irrigation (IRQI) for water purified by reverse osmosis, brackish well water and desalination reject brine
Conclusions
1. The index to assess quality of waters from desalination plants showed good performance and can include additional parameters referring to soil and the crop exploited.
2. High values of the relative index of quality of waters from desalination plants are pointed as indicators of possible risks of soil salinization and groundwater contamination.
3. The highest level of land use impact on the quality of waters from desalination plants was found in reject brine samples, followed by samples of well water.
Literature Cited
Anders, C. R. Caracterização química da água de dessalinizadores e dos solos sob a influência do rejeito salino em Mossoró - RN. Mossoró: Universidade Federal Rural do Semi-Árido, 2013. 56p. Dissertação Mestrado
Andrade, T. S.; Montenegro, S. M. G. L.; Montenegro, A. A. de A.; Rodrigues, D. F. B. Variabilidade espaço-temporal da condutividade elétrica da água subterrânea na região semiárida de Pernambuco. Revista Brasileira de Engenharia Agrícola e Ambiental, v.16, p.496-504, 2012. https://doi.org/10.1590/S1415-43662012000500005
Ayers, R. S.; Westcot, D. W. A qualidade da água na agricultura. 2.ed. Campina Grande: UFPB, 1999. 145p. Irrigação e Drenagem, 29. Bush, J. A.; Vanneste, J.; Cath, T. Y. Membrane distillation for
concentration of hypersaline brines from the great salt lake: Effects of scaling and fouling on performance, efficiency, and salt rejection. Separation and Purification Technology, v.170, p.78-91, 2016. https://doi.org/10.1016/j.seppur.2016.06.028
Dias, N. da S.; Lira, R. B. de; Brito, R. F. de; Sousa Neto, O. N. de; Ferreira Neto, M.; Oliveira, A. M. de. Produção de melão rendilhado em sistema hidropônico com rejeito da dessalinização de água em solução nutritiva. Revista Brasileira de Engenharia Agrícola e Ambiental, v.14, p.755-761, 2010. https://doi. org/10.1590/S1415-43662010000700011
Fernandes, R. A.; Loureiro, C. de O. Índice relativo de qualidade (IRQ): Um método para caracterização e hierarquização do potencial qualitativo das águas subterrâneas. Águas Subterrâneas, v.especial, p.1-14, 2006.
Khanzada, N. K.; Khan, S. J.; Davies, P. A. Performance evaluation of reverse osmosis (RO) pre-treatment technologies for in-land brackish water treatment. Desalination, v.406, p.44-50, 2017. https://doi.org/10.1016/j.desal.2016.06.030
Liou, S. M.; Lo, S. L.; Wang, S. H. A generalized water quality index for Taiwan. Enviromental, Monitoring and Assessment, v.96, p.35-50, 2004. https://doi.org/10.1023/B:EMAS.0000031715.83752.a1 Maia, C. E.; Rodrigues, K. K. R. da. P. Proposal for an index to classify irrigation water quality: A case study in northeastern Brazil. Revista Brasileira de Ciência do Solo, v.36, p.823-830, 2012. https://doi.org/10.1590/S0100-06832012000300013
Oliveira, A. M.; Dias, N. da S.; Freitas, J. J. R. de; Martins, D. F. F.; Rabelo, L. N. Avaliação físico-química das águas do processo de dessalinização de poços salobros e salinos em comunidades rurais do oeste potiguar. Águas Subterrâneas, v.31, p.58-73, 2017. Pesce, S. F.; Wunderlin, D. A. Use of water quality indices to verify
the impact of Córdoba City (Argentina) on Suquía River. Water Research, v.34, p.2915-2926, 2000. https://doi.org/10.1016/S0043-1354(00)00036-1
Richards, L. A. Diagnosis and improvement of saline and alkali soils. Washington: United States Department of Agriculture, 1954. 160p. Agriculture Handbook, 60
Rodrigues, J. O.; Andrade, E. M. de; Crisóstomo, L. A.; Teixeira, A. dos S. Modelos da concentração iônica em águas subterrâneas no distrito de irrigação Baixo Acaraú. Revista Ciência Agronômica, v.38, p.360-365, 2007.
SEMARH - Secretaria de Estado de Meio Ambiente e dos Recursos Hídricos. Plano estadual de recursos hídricos. 2009. Relatório Síntese. Disponível em: <http://www.semarh.rn.gov.br/>. Acesso em: Jan. 2017.
Silva, W. P. da; Almeida, C. D. G. C. de; Rolim, M. M.; Silva, E. F. de F.; Pedrosa, E. M. R.; Silva, V. G. F. Monitoramento da salinidade de águas subterrâneas em várzea cultivada com cana-de-açúcar fertirrigada com vinhaça. Revista Brasileira de Engenharia Agrícola e Ambiental, v.18, p.394-401, 2014. https:// doi.org/10.1590/S1415-43662014000400006
Swamee, P. K.; Tyagi, A. Describing water quality with aggregate index. Journal of Enviromental Engineering, v.126, p.451-455, 2000. https://doi.org/10.1061/(ASCE)0733-9372(2000)126:5(451) Tyagi, S.; Sharma, B.; Singh, P.; Dobhal, R. Water quality assessment