Simulation of bean crop growth, evapotranspiration and yield in
Paraná State by the CROPGRO-Drybean model
Rivanildo Dallacort, Paulo Sergio Lourenço de Freitas*, Rogério Teixeira Faria, Antonio Carlos Andrade Goncalves, Roberto Rezende and Rachel Muylaert Locks Guimarães
Departamento de Agronomia, Centro de Ciências Agrárias, Universidade Estadual de Maringá, Av. Colombo, 5790, 87020-900, Maringá, Paraná, Brazil. *Author for correspondence. E-mail: [email protected]
ABSTRACT. The performance of the CROPGRO-Drybean model for the prediction of soil water balance, as well as growth components and bean crop yield, was assessed using data from two field experiments conducted at the State University of Maringá Iirrigation Technical Center, Paraná, Brazil, (latitude 23º27'S, longitude 51º57' and altitude 542 m) during the 2005 and 2006 growing seasons. This assessment aimed to analyze growth components, evapotranspiration and bean crop yield for the edaphoclimatic conditions of the area as simulated by the CROPGRO-Drybean model. This is a model for legumes, and it is grouped in a Decision Support System for Agrotechnology Transference (DSSAT). The model simulates growth, development and yield components of beans as a function of daily climatologic elements for each soil’s specific conditions. It is possible to affirm that water deficit during flowering caused the model to penalize yield severely. It showed discrepant values in leaf area index simulation, and also accentuated discrepancies between measured and simulated values of soil moisture on the day following rainfall. Correlations between measured and simulated values of soil moisture exceeded 70% in both experiments. Yield was underestimated by the model in both experiments.
Keywords: water stress, soil moisture, agrometeorological models.
RESUMO. Simulação do crescimento do feijoeiro, evapotranspiração e rendimento no Estado do Paraná pelo modelo CROPGRO-Drybean. O presente trabalho foi realizado no Centro Técnico de Irrigação da Universidade Estadual de Maringá, localizada em Maringá, Estado do Paraná (lat. 23º 25' S, long. de 51º 57' O, alt. de 542 m). Foram realizados dois experimentos no campo, com a cultura do feijão, conduzidos nos anos agrícolas de 2005 e 2006. Objetivou-se neste trabalho em avaliar os componentes de crescimento, a evapotranspiração e a produção da cultura do feijão para as condições edafoclimáticas da região, simuladas pelo modelo CROPGRO-Drybean. O modelo de foi desenvolvido para a cultura do feijão, está inserido no Sistema de Suporte à Decisão para Transferência de Agrotecnologia (DSSAT). O modelo simula os componentes do crescimento, desenvolvimento e produtividade do feijoeiro em função de elementos climatológicos diários, para as condições específicas de cada solo. Pode-se afirmar que o déficit hídrico, na fase de florescimento, faz com que o modelo penalize severamente a produtividade, apresentou valores discrepantes na simulação do índice de área foliar, mostrou que há discrepância acentuada nos valores medidos e simulados de umidade do solo, no dia posterior à ocorrência de uma precipitação, apresentando correlações entre os valores medidos e simulados de umidade do solo foram superiores a 70% nos dois experimentos. A produtividade foi subestimada pelo modelo nos dois experimentos. Palavras-chave: estresse hídrico, umidade do solo, modelos agrometeorológicos.
Introduction
Growth simulation models are valuable tools for estimating crop yield, considering various combinations of crop input, environmental factors and management practices. To estimate crop yield, agrometeorological-based models simulate crop development, available soil moisture and the effects of water stress on crop yield. Some models are classified
Evangelista et al. (2006) evaluated the
performance of the CLIGEN model in generating
the climatic elements to utilize as input parameters for hydrological and agronomical models, comparing the generated values of climatic elements with the observed values. They concluded that the model showed good performance in generating climatic elements.
Wang et al. (2003) studied the performance of the CROPGRO-Soybean model for simulating site-specific crop growth, soil water content, and grain. The results indicated that CROPGRO-simulated soil water contents in the 15-90 cm soil profile agreed well with measured values. Simulated leaf area index and grain yield also agreed well with measured values during years of average precipitation but were underestimated during extremely dry years.
Sau et al. (2004) evaluated various potential
evapotranspiration equations and different ways of partitioning evaporation between soil evaporation and crop transpiration in DSSAT models and
particularly in CROPGRO faba bean (Vicia faba L.).
They concluded that the Priestley–Taylor ET model used in CROPGRO-soybean to estimate ET tends to overestimate compared values with field values, especially in early crop growing stages, and Pennan-FAO24 is the that time, differences in E0 between crops were not well least adequate to simulate ET and biomass.
Freitas et al. (2005) evaluated the penalization imposed by the CERES-Maize model on corn yield variables. Based on simulations and on experimental conditions, it was concluded that the penalization imposed by the model severely influenced the corn crop yield for treatments with soil water deficit. The corn crop evapotranspiration calculated by the CERES-Maize model overestimated the real water needs of the crop.
In this context, DSSAT (Decision Support System for Agrotechnology Transfer) is a computer system that includes several crop growth models that are used by many researchers for the most varied climatic and soil conditions and are an excellent option for obtaining information that helps in agricultural planning and management. The DSSAT system uses a common soil-water balance module in models for several different crops: maize (Ceres-Maize), soybean (Cropgro-soybean), the common bean (Cropgro-drybean), wheat Wheat), sorghum Sorghum), rice Rice), barley Barley), sunflower (Ceres-Sunflower) and others (JONES; RITCHIE, 1990).
Meirelles et al. (2003) and Faria and Bowen (2003) pointed out inaccuracies of the DSSAT soil-water balance module and suggested changes to
improve model prediction. Freitas et al. (2005) observed that CERES-Maize severely penalized yield during periods of water shortage. They also highlighted the need for research to test the soil-water balance model used, requiring research in experimental fields, monitoring of edaphoclimatic conditions and adjustments to the model when necessary and possible. Crop models, once calibrated, allow researchers to simulate multiple years of experiments, utilizing historical weather data, in a matter of hours.
Bastos et al. (2002) adapted the CROPGRO model for simulating cowpea growth and development under the soil and climate conditions of Piauí State, Brazil. The model showed excellent performance in the estimation of LAI, indicated by
high R2 (0.97) and low MAE (0.16 to 0.28) values,
with maximum values of LAI, observed and simulated, varying from 3 to 4.3 in 1997 and 1998, respectively.
The aims of this research were to evaluate leaf area index, evapotranspiration, grain yield and the soil-water balance module in the CROPGRO-Drybean model against field data from experiments conducted with a bean crop under edaphoclimatic conditions in Maringá, Paraná State, Brazil.
Material and methods
Experimental procedures
The present study was carried out at the Irrigation Technical Center at the State University of Maringá, located in Maringá (latitude 23º 25' S, longitude 51º 57' W and altitude 542 m). The predominant climate in the region, according to the Köppen climate classification, is Cfa type, characterized by intense rainfall during the summer and a dry winter, with 1,673 mm average annual precipitation. The average annual temperature in the region is 23.2°C and the relative humidity of the air is 68%. The predominant soil in the experimental area is classified as Dystric Nitosols, with moderate A horizon and clay texture. The relief presented an average slope of 8%.
Two experiments were carried out with bean
crops (Phaseolus vulgaris L.), cultivar IAPAR 81,
during the 2005 and 2006 growing seasons, from May 4 to August 15, 2005, and April 12 to July 26,
2006, respectively. The experimental area (720 m2)
Soil moisture was determined by TDR, using 80 probes of 0.30 m length in the first experiment and 80 probes of 0.20 m length in the second experiment, all of which were installed vertically from the soil surface at the center of each experimental unit. Dielectrics of the environment
(Ka)were measured daily and were then converted
into soil moisture θ (m3 m-3) using the following
equation: θ = (0.842538 – 0.725175 ds) +
(-0.049601 + 0.060353 ds)Ka + (0.001044
– 0.001061 ds)Ka2, where ds is soil bulk density
.
Crop yield (kg ha-1) was determined by multiplying
plant yield, obtained from ten plant samplings collected randomly in each experimental unit, by plant population in each experimental unit. Seeds were manually detached from pods to determine seed mass, after drying in a ventilated oven at 70°C until the weight was constant.
Leaf dry mass data of the crop were determined by samplings in eight and seven distinct periods for the experiments, respectively. Leaf dry mass was collected on May 27, 2005; June 2, 9, 16, 26 and 30, 2005; and July 7 and 15, 2005 for the first experiment, and May 18 and 26, 2006; June 2, 9, 16 and 23, 2006; and July 7, 2006 for the second experiment. These samplings were carried out in all 80 experimental units, in which three plants were collected randomly to obtain leaf area and, later, the leaf area index.
To determine leaf area, the disk-leaf method was used according to the recommendations of Magalhães (1979), described and used by Freitas et al. (2003). A leaf puncher of 4.75 cm diameter and
17.69 cm2 area was used to relate the dry weight of
the leaf disk area with dry weight of all the leaves of each plant. The dry weight was used to determine leaf area; 12 leaf disks were collected from several parts of leaves that were placed in paper bags and kept in an oven at 65°C for drying until the weight was constant. The material taken from the oven was weighed on a balance with 0.01-g precision. The leaf area was estimated from relationships between dry weights of disks, total disk areas (sum of areas of all disks of the same plant), and total dry weights of collected leaves (used leaves, non-used leaves and disks). To determine the LAI, plant leaf area was divided by soil area available to the plant.
Model characteristics
The CROPGRO-Drybean model was developed to simulate growth, development and yield of a common bean crop. It considers the plant’s main physical and physiological processes, such as photosynthesis, respiration, biomass accumulation and partitioning, phenology, soil water extraction, evapotranspiration and common bean growth and
leaf area, for both stems and roots, as a function of daily climatological elements (rainfall, solar radiation, maximum and minimum temperatures), for the specific conditions of each soil. Water storage in the soil and its capacity to supply plant roots are predicted based on the processes of superficial runoff, water percolation and redistribution in the profile. The model is sensitive to the characteristics of each cultivar, sowing dates, crop spacing and irrigation management options (MEIRELLES et al., 2002).
Cultivar characteristics are expressed in the model by genetic coefficients, to express phonological traits related to growth and development of each genotype. The genetic coefficients for cultivar IAPAR 81 (Table 1) were obtained by interactively adjusting the values of the coefficients until flowering and maturity dates matched the experimental values and simulated dry matter coincided with measured grain yield.
Table 1. Calibrated genetic coefficients*
for cultivar IAPAR 81.
Cultivar CSDL PPSEN EM-FL FL-SH FL-SD SD-PM FL-LF
IAPAR 57 12.00 0.000 28.7 3.0 9.5 28.50 16.84
LFMAX SLAVRN SIZLF XFRT WTPSD SFDUR SDPDV PODUR
1,00 308 133.0 1.00 0.251 12.5 4.12 9.1
*CSDL - critical day length, above which the reproductive development process is not affected (h); PPSEN - response inclination regarding development for the photophase with time (1/hour); EM-FL – period between plant emergence and the appearance of the first flower (R1) (photothermal days); FL-SH – period between the appearance of the first flower and the first pod (R3) (photothermal days); FL-SD - period between the appearance of the first flower and the start of seed formation (R5) (photothermal days); SD-PM – period between the start of seed formation and physiological maturity (R7) (photothermal days); FL-LF – period between the appearance of the first flower (R1) and the end of leaf expansion; LFMAX - maximum leaf photosynthesis rate at an optimal temperature rate of 30ºC; SLAVARN - specific leaf area under standard growth conditions (cm2); SIZLF - maximum size of completely expanded leaf (cm2); XFRT - maximum fraction of the daily growth that is partitioned between the seed plots the pod; WTPSD - maximum weight per seed (g); SFDUR - duration of the grain swelling period in the pods, under standard growth conditions (photothermal days); SDPDV - mean seeds per pod, under standard growth conditions (photothermal days); PODUR - time necessary for the cultivar to reach ideal pod conditions (photothermal days).
In addition to the genetic coefficients of cultivar IAPAR 81, other inputs to the model were climatological and soil data. The set of daily climatological variables consisted of maximum air temperature, minimum air temperature, rainfall and sunshine hours, which were obtained from the INMET meteorological station, located close to the experimental field.
(m3 m-3) was obtained as a function of
pre-established tensions (m) in kPa. The upper
moisture limit (field capacity) was considered as the water content retained at -6 kPa (REICHARDT, 1990) and the lower limit (permanent wilting point) at -1500 kPa.
Simulations were performed for both growth cycles, coinciding with the periods when the experiments were carried out.
Table 2. Soil physical characteristics for 0-30 cm soil depth at the experimental area.
Layer (cm)
Soil retention
(m3 m-3)
Bulk density
(g cm-3
)
Particle size distribution
(%) Saturation Upper
Limit Lower
Limit
Sand Silt Clay
0-15 0.57 0.46 0.30 1.33 12 12 76
15-30 0.58 0.44 0.33 1.39 12 12 76
Evapotranspiration calculated by the model
The CROPGRO-Drybean simulation model uses the Ritchie method to calculate evapotranspiration, which is used to calculate water balance in the soil. The model is based on works by Ritchie (1972) and Jones and Ritchie (1990), and consists of estimating crop evapotranspiration in
mm day-1, calculating water evaporation in the soil
(Es) and transpiration (Ep) independently.
Simulations carried out
Simulations were carried out for both experimental periods, during the 2005 and 2006 growing seasons, from May 4 to August 15, 2005 and from April 12 to July 26, 2006, respectively, which made it possible to compare responses measured in the field during the experiments with data simulated by models.
Rainfall and irrigation
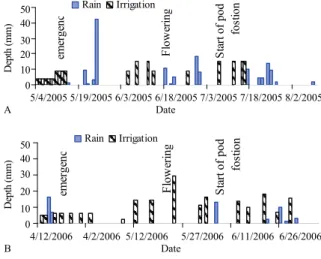
During the experimental periods, total rainfall plus irrigation for the 2005 and 2006 growing seasons were 332 and 303 mm (Figure 1), respectively. These values met crop water requirements during growing cycle found by some authors conducting experiments in Brazil (DANTAS NETO et al., 2005; NÓBREGA et al., 2001; SILVEIRA; STONE, 2001). Additionally, Doorenbos and Kassam (2000) concluded that maximum bean yield is achieved when 300 to 400 mm is available during the cycle, depending on the local edaphoclimatic conditions.
The coefficient of water application uniformity of the sprinkler system was 80% in the first experiment and 81% in the second experiment, values considered acceptable in a sprinkler irrigation system (BERNARDO et al., 2005). For the 2005
experiment, between emergence and flowering (May 10 to June 15), a total of 147.3 mm were concentrated, which corresponded to 44.4% of the total rainfall of the crop cycle. From flowering to the start of pod formation (June 16 to July 15), 83.5 mm of well-distributed rainfall occurred to fulfill crop water requirements.
De
pth
(m
m)
50 40
30 20 10 0
em
er
g
en
c
Fl
o
w
er
in
g
S
ta
rt
of pod fost
ion
5/4/2005 5/19/2005 6/3/2005 6/18/2005 7/3/2005 7/18/2005 8/2/2005 A Date
D
epth
(m
m)
50 40 30
20
10 0
em
er
g
en
c
Fl
o
w
er
in
g
S
ta
rt
of
pod
fos
ti
on
4/12/2006 4/2/2006 5/12/2006 5/27/2006 6/11/2006 6/26/2006 B Date
Figure 1. Rainfall and irrigation events during the experiments carried out in 2005 (A) and 2006 (B).
According to Nóbrega et al. (2001), water shortage at this phase would cause large reductions in yield. Finally, during grain filling, 77 mm of irrigation, together with well-distributed rainfall that occurred during the period, were sufficient to satisfy crop water requirements. For the experiment carried out in 2006, the crop received a total of 112.7 mm from emergence to flowering, corresponding to 37.2% of the total rainfall in the crop cycle. From flowering to the start of pod formation, the crop was supplied with 45.1 mm of irrigation, 34.6 mm less than the depth received for the 2005 experiment. Finally, from pod formation to maturity the crop received 105.4 mm.
Results and discussion
Simulated and measured soil moisture behavior
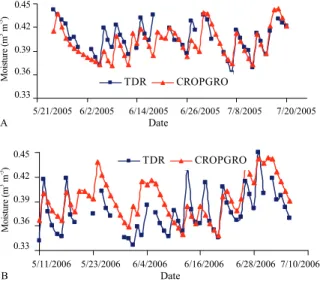
Moisture simulated by the CROPGRO-Drybean model showed great variations in amounts when compared to moisture measured through TDR (Figure 2). During the first experiment (from May 25 to July 20, 2005), soil moisture was above the permanent wilting point limit and values were higher than field capacity limits on only two days. In the experiment conducted in 2006, soil moisture was monitored using TDR from May 11 to July 11, 2006.
The correlation between values measured by TDR and simulated by the DSSAT model on the 47
Rain Irrigation
days observed showed R = 74% and 0.018 cm3 cm-3
standard deviation for the first experiment and R = 70.15% with 0.02 standard deviation on the 54 days on which moisture was monitored during the second experiment.
Mois
ture
(m
3 m -3)
0.45
0.42
0.39
0.36
0.33
5/21/2005 6/2/2005 6/14/2005 6/26/2005 7/8/2005 7/20/2005
A Date
Moi
stur
e (m
3 m -3)
0.45
0.42
0.39
0.36
0.33
5/11/2006 5/23/2006 6/4/2006 6/16/2006 6/28/2006 7/10/2006
B Date
Figure 2. Variation of simulated and measured soil moisture at 20-cm depth during the experiment carried out in 2005 (A) and at 30 cm depth during the experiment conducted in 2006 (B).
Values presented in Figure 2 show the model’s limitation in considering the available soil water. This was observed by Faria and Bowen (2003) when they evaluated the performance of the water balance module (WBM) of the DSSAT v 3.5 models. Soil moisture values measured and simulated by the model during the first experiment showed that 36.17% of simulated values were overestimated and 63.83% were underestimated, while results found by Wang et al. (2003) indicated that CROPGRO-simulated soil water contents in the 15–90 cm soil profile agreed well with measured values. In the second experiment, the same behavior was not observed; 74.07% of data were overestimated and 25.93% were underestimated. Sau et al. (2004) also found simulated evapotranspiration values to be higher than those observed in the field. Differences between the observed and simulated yield results were partly attributed to the semi-arid climatic conditions of the study area and to the CROPGRO-soybean ET model that overestimated simulated ET (DOGAN et al., 2007).
As suggested by Willmott (1981), the validation of simulated data are of great importance, and considering that numerical models are approximate rather than exact, data were tested due to errors by such proximity. Values of mean square error (MSE), which is associated with the tendency to underestimate or overestimate data in relation to the
average, and the square root of mean square error (RMSE), which is associated with data dispersion, are presented in Table 3. Such data show that simulated data were overestimated in 2005 and underestimated in 2006. RMSE values observed in 2005 were lower than those observed in 2006, confirming lower data dispersion.
Table 3. Determined mean square error (MSE) and square root of mean square error (RMSE).
MSE RMSE
Growing season of 2005 0.0063 0.0142
Growing season of 2006 - 0.0152 0.0256
Evapotranspiration simulated by the model
Bean evapotranspiration simulated by the CROPGRO model, which uses the Ritchie method, allows the variation in observation of soil water evaporation and plant transpiration. In the initial phase of crop growth, soil water evaporation presented values close to those of evapotranspiration (Figure 3). For the 2005 experiment, bean transpiration values exceeded evaporation for June 15, 2005, showing values of 1.56 and 1.43 mm, respectively (Figure 3A). The simulated leaf area
index (LAI) was 2.48 m2 m-2. Maximum evaporation
observed in the crop cycle was 4.8 mm day-1, which
happened during the initial phase of the crop cycle,
and maximum transpiration was 2.47 mm day-1, on
July 2, 2005, during a crop phase with higher LAI.
(
m
m
)
6.0
5.0
4.0
3.0
2.0
1.0
0.0
c
5/3/2005 5/23/2005 6/12/2005 7/2/2005 7/22/2005 8/11/2005 A Date
(
m
m)
6.0
4.0
2.0
0.0 c
4/11/2006 5/1/2006 5/21/2006 6/10/2006 6/3/2006 7/20/2006 B Date
Figure 3. Evapotranspiration (ET), evaporation (E), and transpiration (T) of bean crop determined by the model during the experiments carried out in 2005 (A) and 2006 (B).
During the entire crop cycle, evapotranspiration was 260 mm: 156 mm from evaporation and 104 mm from transpiration. Evapotranspiration had maximal, mean and minimal values of 4.87, 2.71 and
0.31 mm day-1, respectively. These values were
TDR CROPGRO
ET E T
ET E T
similar to those found by Junqueira et al. (2004), who observed consumption of 2.1, 3.82, 2.52 and
1.94 mm day-1 in vegetative development stages,
during flowering, during grain filling and at the beginning of maturation, respectively.
In the 2006 experiment, evaporation and evapotranspiration values exhibited the same behavior (Figure 3B). In this crop cycle, evapotranspiration was 283 mm, 168 mm from evaporation and 115 mm from transpiration. Evapotranspiration had maximal, mean and minimal values of 5.61, 2.70 and 0.34 mm day-1, respectively.
The evaporation and transpiration totals found in both experiments were close to those found by Rodrigues et al. (1998), who observed 62.2% evapotranspiration due to evaporation and 37.8% due to transpiration, using the Ritchie model. Values found in this study were 59.29 and 40.71% in the first experiment, and 60.10 and 39.90% in the second experiment for evaporation and transpiration, respectively.
Measured and simulated soil moisture values (Figure 2A and B) showed great variation, interfering directly with soil water balance and its use in the evapotranspiration process of the bean crop. In Figures 4A and B, the behavior of evapotranspiration values simulated by the DSSAT model and evapotranspiration values calculated from daily variations in soil moisture in the layer are observed.
E
v
apot
ra
nspi
ra
tion
(
m
m
d
-1) 8.0
7.0
6.0
5.0
4.0
3.0
2.0
1.0
0.0
45
40
35
30
25
20
15
10
5
0
R
ain
fa
ll
(
m
m)
5/25/2005 6/6/2005 6/18/2005 6/30/2005 7/12/2005 A Date
E
v
apo
trans
pira
ti
on
(
m
m
d
-1) 15.0
10.0
5.0
0.0
40 30 20 10 0 Rain
fal
l (m
m)
5/12/2006 5/24/2006 6/5/2006 6/17/2006 6/29/2006 7/11/2006
B Date
Figure 4. Evapotranspiration determined by the model and calculated from soil moisture values measured during the experiments carried out in 2005 (A) and 2006 (B).
It was not possible to measure soil moisture using TDR on rainy days. Therefore, it is not
possible to determine evapotranspiration values by using differences in moisture during the whole cycle. On days following precipitation, evapotranspiration values determined by moisture measurements were higher. The values were closer to those determined by the CROPGRO model from the second day after the one with precipitation, which meant that evapotranspiration calculated by moisture data was overestimated on the day following precipitation, causing the high deviations that were found (Figure 4).
For example, 10 mm of precipitation fell on July 16, 2006. On the 17th, evapotranspiration calculated by the variation of moisture measurements
determined by TDR was 9.48 mm day-1, and that
simulated by CROPGRO was 3.30 mm day-1. The
TDR method overestimated evapotranspiration approximately three times more than that simulated by the model. For the 18th day, two days following precipitation, evapotranspiration values were 2.32
and 3.27 mm day-1 for TDR and simulated by
CROPGRO, respectively, which meant that TDR underestimated its measure, and a tendency towards measurement approximation was observed on subsequent dates.
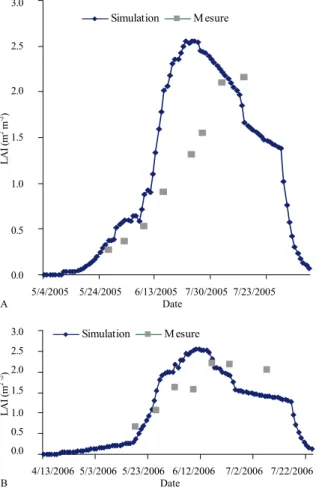
Leaf area index
Figure 5A and B show leaf area index behavior determined in the field and simulated by the CROPGRO-Drybean model for both experiments. Simulated data were higher than measured values
during the 2005 experiment. Simulated LAIMax
occurred on June 26, 2005, with a value of 2.56 m2
m-2. Measured LAI was 1.31 m2 m-2 on this date,
which was not the maximal value. Maximum leaf area index, according to the average of
80 experimental plots, was 2.14 m2 m-2, found on
July 15, 19 days after the simulated LAIMax. Similar
values were found by Villa Nova et al. (2003), who
observed that the LAIMax measured in the field was
2.63 m2 m-2 at 53 days after plant emergence, and by
Bastos et al. (2002). These values were lower than those found by Meirelles et al. (2002).
Table 4 shows LAI behavior, which was determined in 80 experimental plots. Large variations in measured values can be observed;
measured LAIMax exceeded simulated values in some
plots, though on average, simulated values were higher. High standard deviations of LAI values can be observed in the plots. Freitas et al. (2003) stated that the coefficient of water application uniformity influences LAI directly, and verified variation in the leaf area index as a function of the water application
coefficient (CUC). For CUC > 86%, LAIMax was
close to 4.32 m2 m-2, and LAI
min. was 3.10 m2 m-2.
For CUC < 66%, LAIMax was 2.84 m2 m-2, and
LAImin. was 2.07 m2 m-2.
Rainfall ET ET-DSSAT
L
A
I (
m
2 m -2)
3.0
2.5
2.0
1.5
1.0
0.5
0.0
5/4/2005 5/24/2005 6/13/2005 7/30/2005 7/23/2005 A Date
L
A
I
(m
2
-2) 3.0
2.5
2.0
1.5
1.0
0.5
0.0
4/13/2006 5/3/2006 5/23/2006 6/12/2006 7/2/2006 7/22/2006 B Date
Figure 5. Leaf area indexes (LAI) determined in field and simulated by the model during the experiments carried out in 2005 (A) and 2006 (B).
Table 4. Leaf area indexes observed during the 2005 experiment.
LAI date LAImean LAImax LAImin Standard Deviation
5/27/2005 0.27 0.39 0.09 0.07
6/26/2005 0.36 0.63 0.12 0.11
6/9/2005 0.52 1.08 0.18 0.17
6/16/2005 0.89 1.79 0.29 0.29
6/26/2005 1.30 2.93 0.36 0.48
6/30/2005 1.54 4.37 0.45 0.61
7/7/2005 2.08 4.24 0.70 0.82
7/15/2005 2.14 6.73 0.67 1.01
Measured LAI values presented in Tables 3 and 4
showed that LAImax values exhibited the same
behavior, with 2.14 m2 m-2 in 2005 and 2.21 m2 m-2
in 2006. Several authors have developed studies for the determination of LAI average coefficients in various crop developmental stages. For the vegetative phase of development, Junqueira et al.
(2004) observed LAI values of about 1.71 m2 m-2
during the flowering-grain filling period. Doorenbos and Kassam (2000) found values
between 1.05 and 1.20 m2 m-2. At the stage of
physiological maturation, Rodrigues et al. (1998)
observed values ranging from 2.3 to 3.1 m2 m-2 in a
study using the Ritchie model to determine bean crop transpiration and evaporation.
In the 2006 experiment, LAIMax simulated by the
model was 2.55 m2 m-2; this occurred on June 10 and
11, 2006. On June 16, 2006, an average LAIMax of 2.21
m2 m-2 was found in 80 experimental plots. For this
date, the simulated LAI value was 2.30 m2 m-2.
In a study carried out using the same model with cultivar IAPAR 57, Dallacort et al. (2005) observed lower simulated yield during simulation with sowing on July 30, 1988, and leaf growth was severely reduced, showing a maximum LAI of 0.49 m2 m-2 at 55 days after sowing. In the harvest
with the greatest simulated yield, LAI was low in the initial phase due to water stress, but it was regulated during the crop cycle, reaching a maximum value of 3.34 m2 m-2 at 68 days after sowing.
Yield
Measured yield standard deviation and coefficient of variation of bean yield from 80 experimental units in the 2005 experiment were higher than the values obtained in 2006 (Table 6). Although predicted values were within the range of mean ± standard deviation, the model underestimated crop yield by 19% in 2005 and by 29% in 2006 (Table 5). This can be attributed to the fact that the CROPGRO-Drybean model exaggerates the effect of water stress during the flowering phase, which leads to the underprediction of crop yield.
Table 5. Leaf area indexes observed during the 2006 experiment.
LAI date LAImean LAImax LAImin Standard Deviation
5/18/2006 0.67 1.37 0.25 0.24
5/26/2006 1.05 2.21 0.36 0.46
6/2/2006 1.62 3.54 0.40 0.69
6/9/2006 1.57 3.46 0.72 0.57
6/16/2006 2.21 4.63 0.66 0.81
6/23/2006 2.18 4.81 1.01 0.73
7/7/2006 2.04 3.83 1.11 0.53
Table 6. Simulated and measured mean, maximum, and minimum yields, standard deviations (SD) and coefficients of variation (CV) determined for both experiments.
Yield
Simulated Mean Maximun Minimun SD CV
Growing season
(kg ha-1) (%)
2005 2,465 2,830 4,879 1,200 898.98 32
2006 1,748 2,462 4,197 1,478 549.75 22
Conclusion
Based on the results obtained with this work, it is possible to conclude that: water deficit during the flowering phase caused the model to penalize yield severely; the model showed discrepancies in simulated leaf area index values; there was a greater discrepancy between measured and simulated values of soil moisture on the day following rainfall; correlations found between measured and simulated
Simulation M esure
values of soil moisture exceeded 70% in both experiments; yield was underestimated by the model in both growing seasons.
References
BASTOS, E. A.; FOLEGATTI, M. V.; FARIA, R. T.; ANDRADE JÚNIOR, A. S.; CARDOSO, M. J. Simulation of growth and development of irrigated cowpea in Piauí State by CROPGRO model. Pesquisa Agropecuária Brasileira, v. 37, n. 10, p. 1381-1387, 2002.
BERNARDO, S.; SOARES, A. A.; MANTOVANI, E. C. Manual de irrigação. 7. ed. Viçosa: UFV, 2005.
DALLACORT, R.; FREITAS, P. S. L.; RESENDE, R.; FARIA, R. T.; GONÇALVES, A. C. A. Utilização do modelo CROPGRO-drybean, na determinação das melhores épocas de semeadura da cultura do feijão, para a região de Maringá-PR. Acta Scientiarum.Agronomy, v. 27, n. 2, p. 353-359, 2005.
DANTAS NETO, F. S.; COSTA, J. M. N.; SOARES, A. A.;
SEDIYAMA, G. C.; COSTA, L. C. Sistema
computacionalaplicado ao cálculo da demanda hídrica georeferenciada para a cultura do feijão.Revista Brasileira de Engenharia Agrícola e Ambiental, v. 9, n. 2, p. 215-221, 2005.
DOGAN, E.; KIRNAK, H.; COPUR, O. Deficit irrigations during soybean reproductive stages and CROPGRO-soybean simulations under semi-arid climatic conditions. Field Crops Research, v. 103, n. 2, p. 154-159, 2007.
DOORENBOS, J.; KASSAM, A. H. Efeito da água no rendimento das culturas. 2. ed. Campina Grande: UFPB, 2000. (Estudos FAO. Irrigação e drenagem, 33).
EVANGELISTA, A. W. P.; FERREIRA, P. A.; PRUSKI, F. F.; SEDIYAMA, G. C. Avaliação do desempenho do modelo CLIGEN em gerar dados climáticos para modelos hidrológicos e agronômicos. Revista Brasileira de Engenharia Agrícola e Ambiental, v. 10, n. 1, p. 119-127, 2006.
FARIA, R. T.; BOWEN, W. T. Evaluation of DSSAT soil-water balance module under cropped and bare soil conditions. Brazilian Archives of Biology and Technology, v. 46, n. 4, p. 489-498, 2003.
FREITAS, P. S. L.; MANTOVANI, E. C.; SEDIYAMA, G. C.; COSTA, L. C. Penalização da produtividade da cultura do milho imposta pelo modelo CERES-Maize. Acta Scientiarum. Agronomy, v. 27, n. 1, p. 97-105, 2005. FREITAS, P. S. L.; REZENDE, R.; MANTOVANI, E. C.; FRIZZONE, J. A. Viabilidade de inserção dos efeitos da uniformidade de irrigação em modelos de crescimento de culturas. Revista Brasileira de Engenharia Agrícola e Ambiental, v. 7, n. 3, p. 437-444, 2003.
JONES, J. W.; RITCHIE, J. T. Crop Growth Models. In: HOFFMAN, G. J.; HOWEL, T. A.; SOLOMON, K. H. (Ed.). Management of farm irrigation systems. St. Joseph: ASAE, 1990. p. 63-89.
JUNQUEIRA, A. M.; ANDRÉ, R. G. B.; PINHEIRO, F. M. A. Consumo de água pelo feijoeiro comum, cv. Carioca.
Revista Brasileira de Agrometeorologia, v. 12, n. 1, p. 51-56, 2004.
MAGALHÃES, A. C. N. Análise quantitativa do crescimento. In: FERRI, M. G. (Ed.). Fisiologia vegetal. São Paulo: EPU/Edusp, 1979. v. 1, cap. 8, p. 331-350. MEIRELLES, E. J. L.; PEREIRA, A. P.; SENTELHAS, P. C.; STONE, L. F.; ZIMMERMANN, F. J. P. Calibration and test of the cropgro-dry bean model for edaphoclimatic conditions in the savannas of central Brazil. Scientia Agricola, v. 59, n. 4, p. 723-729, 2002.
MEIRELLES, E. J. L.; PEREIRA, A. P.; SENTELHAS, P. C.; STONE, L. F.; ZIMMERMANN, F. J. P. Risco climático de quebra de produtividade da cultura do feijoeiro em Santo Antônio de Goiás, GO. Bragantia, v. 62, n. 1, p. 163-171, 2003.
NÓBREGA, J. Q.; RAO, T. V. R.; BELTRÃO, N. E. M.; FIDELES FILHO, J. Análise de crescimento do feijoeiro submetido a quatro níveis de umidade do solo. Revista Brasileira de Engenharia Agrícola e Ambiental, v. 5, n. 3, p. 437-443, 2001.
REICHARDT, K. A. Água em sistemas agrícolas. São Paulo: Manole, 1990.
RITCHIE, J. T. Model for predicting evaporation fron a row crop with a incomplete cover. Water Resourse Research, v. 8, n. 5, p. 1204-1213, 1972.
RODRIGUES, L. N.; SEDIYAMA, G. C.; SOCCOL, O. J.; MANTOVANI, E. C. Modelo de Ritchie para determinações da transpiração do feijoeiro (Phaseolus vulgaris L.) e da evaporação direta da água do solo. Revista Brasileira de Agrometeorologia, v. 6, n. 2, p. 179-185, 1998.
SAU, F.; BOOTE, K. J.; BOSTICK, W. M.; JONES, J. W.; MINGUEZ, M. I. Testing and improving evapotranspiration and soil water balance of the DSSAT crop models. Agronomy Journal, v. 96, n. 5, p. 1243-1257, 2004.
SILVEIRA, P. M. S.; STONE, L. F. Irrigação do feijoeiro. Santo Antonio de Goiás: Embrapa Arroz e Feijão, 2001. VILLA NOVA, N. A.; SENTELHAS, P. C.; PEREIRA, A. B. Evapotranspiração máxima do feijoeiro, cv. Goiano precoce, e função do índice de área foliar e da evaporação do tanque classe A. Publicatio UEPG. Ciências Exatas e da Terra, Ciências Agrárias e Engenharias, v. 9, n. 2, p. 41-45, 2003.
WANG, F.; FRAISSEB, C. W.; KITCHENC, N. R.; SUDDUTH, K. A. Site-specific evaluation of the CROPGRO-soybean model on Missouri claypan soils. Agricultural Systems, v. 76, n. 3, p. 985-1005, 2003. WILLMOTT, C. J. On the validation of models. Physical Geography, v. 2, n. 2, p. 184-94, 1981.
Received on November 25, 2010. Accepted on February 18, 2011.