Simulation of growth and development of irrigated cowpea
in Piauí State by CROPGRO model
(1)Edson Alves Bastos(2), Marcos Vinícius Folegatti(3), Rogério Teixeira de Faria(4), Aderson Soares de Andrade Júnior(2) and Milton José Cardoso(2)
Abstract – The objective of this work was to adapt the CROPGRO model, which is part of the DSSAT system, for simulating the cowpea (Vigna unguiculata) growth and development under soil and climate conditions of the Baixo Parnaíba region, Piauí State, Brazil. In the CROPGRO, only input parameters that define crop species, cultivars, and ecotype were changed in order to characterize the cowpea crop. Soil and climate files were created for the considered site. Field experiments without water deficit were used to calibrate the model. In these experiments, dry matter (DM), leaf area index (LAI), yield components and grain yield of cowpea (cv. BR 14 Mulato) were evaluated. The results showed good fit for DM and LAI estimates. The medium values of R2 and medium absolute error (MAE) were, respectively, 0.95 and 264.9 kg ha-1 for DM, and 0.97 and 0.22 for LAI. The difference between observed and simulated values of plant phenology varied from 0 to 3 days. The model also presented good performance for yield components simulation, excluding 100-grain weight, for which the error ranged from 20.9% to 34.3%. Considering the medium values of crop yield in two years, the model presented an error from 5.6%.
Index terms: Vigna unguiculata,models, climatic factors, edaphic factor, water availability, DSSAT.
Simulação do crescimento e desenvolvimento do caupi irrigado no Estado do Piauí pelo modelo CROPGRO
Resumo – O objetivo deste trabalho foi adaptar o modelo CROPGRO, o qual faz parte do sistema DSSAT, para simular o crescimento e desenvolvimento do caupi (Vigna unguiculata) nas condições de
solo e clima do Baixo Parnaíba, Piauí. No CROPGRO, foram modificados apenas parâmetros que definem os arquivos de espécie, de cultivar e de ecótipo, visando caracterizar a cultura do caupi. Foram criados arquivos contendo as características de solo e de clima do referido local. Na calibração do modelo, foram utilizados experimentos de campo sem restrições hídricas nos quais foram avaliados a matéria seca (MS), o índice de área foliar (IAF), os componentes de produção e a produtividade de grãos da cultivar BR 14 Mulato. Os valores médios dos R2 e do erro absoluto médio (EAM) foram, respectivamente, 0,95 e 264,9 kg ha-1 quanto à MS, e 0,97 e 0,22 quanto ao IAF. A diferença entre os valores observados e simulados da fenologia da planta variaram entre 0 e 3 dias. O modelo também apresentou bom desempenho nas simulações dos componentes de produção, exceto quanto ao peso de 100 grãos, cujos erros de estimativa variaram de 20,9% a 34,3%. Considerando os valores médios de produtividade de grãos de dois anos, o modelo apresentou erro de 5,6%.
Termos para indexação: Vigna unguiculata, modelo, fator climático, fator edáfico, disponibilidade
hídrica, DSSAT.
(1)Accepted for publication on January 31, 2002. (2)Embrapa-Centro de Pesquisa Agropecuária do Meio-Norte,
Caixa Postal 341, CEP 64200-970 Parnaíba, PI. E-mail: [email protected],
[email protected], [email protected] (3)Escola Superior de Agricultura Luiz de Queiroz, Dep. de Engenharia Rural, Caixa Postal 09, CEP 13418-900 Piracicaba, SP. E-mail: [email protected] (4)Instituto Agronômico do Paraná, Rodovia Celso Garcia
Cid, Km 375, Caixa Postal 481, CEP 86001-970 Londrina, PR. E-mail: [email protected]
Introduction
Recommendation of new techniques to increase
crop yield is time consuming and expensive because
it needs evaluation in several locations and years to
become a widespread practice. An alternative to
solve this problem is the use of crop models that
simulate crop yield under different soil and climate
conditions. The great advantage of these models is
the low cost and the short time spent to obtain
re-sults, besides helping a better agricultural planning
and management towards higher profits.
The DSSAT (Decision Support System for
Agrotechnology Transfer) is a computational
sys-tem that includes a data base management syssys-tem,
crop models, and application programs. The DSSAT
models have been used by a large group of
research-ers, extension personnel and consultants in various
levels of agricultural applications (Hoogenboom
et al., 1992). This system includes models for
sev-eral cereal crops (maize, wheat, sorghum, millet, rice
and barley), three legume crops (soybean, peanut and
dry bean) and cassava. The grain legume models
operate using a generic grain legume model, called
CROPGRO. The models require information for soil,
climate (maximum and minimum temperatures,
pre-cipitation and solar radiation) and crop management
conditions (Tsuji et al., 1994).
DSSAT allows the inclusion of other crops by
modi-fications in the specie, cultivar and ecotype files. There
are no reliable models for cowpea in the literature.
The objective of this work was to adapt the
CROPGRO model for simulating the cowpea growth
and development under soil and climate conditions
of the Baixo Parnaíba region, Piauí State, Brazil.
Material and Methods
The CROPGRO-cowpea model was established for simulating the growth and development of cowpea crop. This model uses the codes and structure of CROPGRO v. 3.5, as described by Tsuji et al. (1994) and Boote et al. (1998a, 1998b), but the input parameters that define culti-var and ecotype files (Table 1) and specie file (Table 2) were changed in order to characterize the cowpea crop. This information was obtained from the literature and from some experiments carried out at Embrapa-Centro de Pesquisa Agropecuária do Meio-Norte, in Parnaíba, Piauí, Brazil (3o8' S; 41o78' W and 46.8 m elevation). The
cow-pea files were created by modification of the original files of dry bean (Phaseolus vulgaris L.), that is one of the
le-guminous of CROPGRO. Soil and meteorological data files were created considering the local characteristics. The crop management information, including irrigation man-agement and fertilizer application, as well as planting dates and plant density, were also supplied to the model.
The results of the soils (0-20 cm) chemical analysis were: pH, 6.0; P, 15 mg dm-3; K, 110 mg dm-3; Ca2+,
30 mg dm-3; Mg2+, 13 mg dm-3; Al+3, 0 mg dm-3. The
granulometric composition (g kg-1) were: sand, 650; silt, 250;
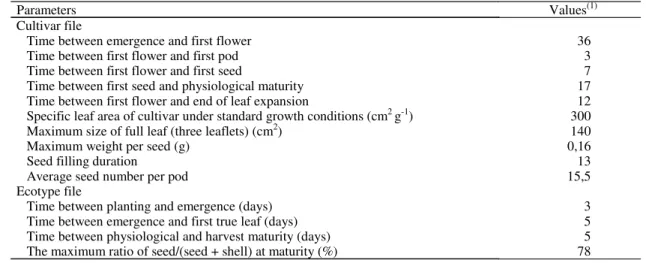
Table 1. Parameters of cultivar and ecotype files modified for calibration of CROPGRO-cowpea.
(1)Values obtained in experiments carried out at Embrapa-Centro de Pesquisa Agropecuária do Meio-Norte, Parnaíba, State of Piauí, Brazil.
Parameters Values(1)
Cultivar file
Time between emergence and first flower 36
Time between first flower and first pod 3
Time between first flower and first seed 7
Time between first seed and physiological maturity 17
Time between first flower and end of leaf expansion 12 Specific leaf area of cultivar under standard growth conditions (cm2 g-1) 300
Maximum size of full leaf (three leaflets) (cm2) 140
Maximum weight per seed (g) 0,16
Seed filling duration 13
Average seed number per pod 15,5
Ecotype file
Time between planting and emergence (days) 3
Time between emergence and first true leaf (days) 5
loam, 100. The bulk density was 1.420 kg m-3 and water
content (cm3 cm-3) was 0.171, 0.139 and 0.042 for
satura-tion, field capacity and permanent wilting point conditions, respectively. The climate is tropical humid, with mean an-nual values of air relative humidity, precipitation and air temperature of 75%, 1,300 mm and 28ºC, respectively.
A field experiment was conducted, using BR 14 Mulato cultivar under four irrigation depths, L1, L2, L3 and L4 (Table 3). The irrigation depths were applied by a line source irrigation system. The experiment was repeated during two years, from June to August of 1997 and from July to October of 1998. A randomized complete block design with four replications was used. The treatment L2, whose water content was maintained near to field capac-ity, was used to calibrate the model because it provided the largest grain yield (Table 3). Dry matter, leaf area in-dex (LAI), yield components (100 grain weight, number of pod per plant and number of grain per pod) and grain yield of cowpea were evaluated.
Determination coefficient (R2) and medium absolute
error (MAE) were used to evaluate the estimates of leaf area index and dry matter. The yield components and grain yield were evaluated by the difference (%) between pre-dicted and measured values.
Results and Discussion
Simulation of the plant phenology was quite
pre-cise in 1997, with a maximum difference of only
two days between observed and simulated data. In
1998, the crop cycle was five days shorter than in
1997, which was not simulated by the model
(Table 4). The shorter growing season probably
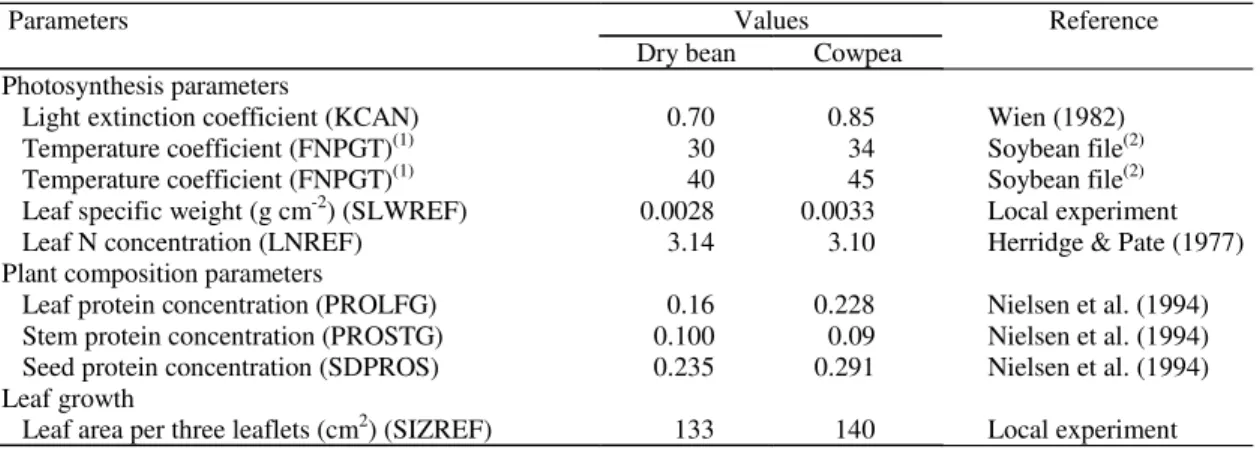
oc-Table 2. Species parameters modified from parameters of dry bean (Phaseolus vulgaris L.) for calibration of
CROPGRO-cowpea model.
(1)This coefficient includes four values; only the third and fourth were modified. (2)Correspond to soybean specie file of CROPGRO model.
Parameters Values Reference
Dry bean Cowpea Photosynthesis parameters
Light extinction coefficient (KCAN) 0.70 0.85 Wien (1982) Temperature coefficient (FNPGT)(1) 30 34 Soybean file(2)
Temperature coefficient (FNPGT)(1) 40 45 Soybean file(2)
Leaf specific weight (g cm-2) (SLWREF) 0.0028 0.0033 Local experiment
Leaf N concentration (LNREF) 3.14 3.10 Herridge & Pate (1977) Plant composition parameters
Leaf protein concentration (PROLFG) 0.16 0.228 Nielsen et al. (1994) Stem protein concentration (PROSTG) 0.100 0.09 Nielsen et al. (1994) Seed protein concentration (SDPROS) 0.235 0.291 Nielsen et al. (1994) Leaf growth
Leaf area per three leaflets (cm2) (SIZREF) 133 140 Local experiment
Table 3. Irrigation depths applied in different treatment
on cowpea (cv. BR 14 Mulato). Parnaíba, State of Piauí, Brazil(1).
(1)Correspond to treatments used on model calibration; L1, L2, L3 and L4: irrigation depth (mm).
Year L1 L2 L3 L4
1997 455 330 274 190
1998 449 429 317 194
curred due to high temperatures during 1998 (>38
oC)
(Figure 1), reducing the flowering time. However,
the results show that the maximum difference
be-tween observed and simulated data in 1998, was
three days for physiological maturity. The difference
between measured and predicted values of numbers
of days for appearing of the first flower, first pod
and first seed, was only two days (Table 4).
Consid-ering that grain yield is directly influenced by the
crop cycle and that the difference between simulated
and observed grain yield in 1998 was only 9.8%
(Table 5), one can affirm that the model presented a
satisfactory performance on phenological data
simu-lation. Besides, the observed value of 63 days to
complete the physiological maturity is atypical for
the Parnaíba conditions. Experiments in previous
years in this region, and in Teresina, where air
tem-perature is higher than in Parnaíba, presented
physi-ological maturity between 65 and 70 days. These
results would be very close to the simulated data.
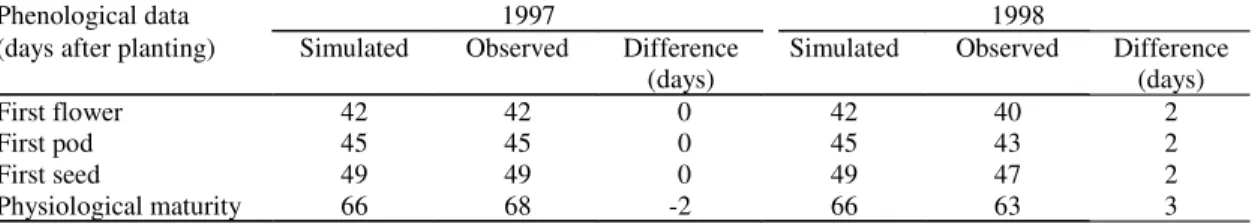
Table 4. Phenological data of cv. BR 14 Mulato, during the CROPGRO-cowpea calibration, in 1997 and 1998. Parnaíba, State of Piauí, Brazil.
Phenological data 1997 1998
(days after planting) Simulated Observed Difference
(days) Simulated Observed Difference(days)
First flower 42 42 0 42 40 2
First pod 45 45 0 45 43 2
First seed 49 49 0 49 47 2
Physiological maturity 66 68 -2 66 63 3
Figure 1. Maximum ( :1998; !: 1997) and minimum ( : 1998; " : 1997) temperature values during experiments in 1997 and 1998. Parnaíba, State of Piauí, Brazil.
which varied from 0.92 to 0.98, and by the relatively
low medium absolute error (MAE), ranging from
204.3 to 325.6 kg ha
-1(Figure 2).
During the vegetative phase, that extended
ap-proximately up to 40 days after planting, simulated
and observed dry matter production were very close
for both years. However, during the reproductive
phase, the differences between predicted and
mea-sured data were greater. In this phase, the flowers,
Table 5. Simulated and observed values of grain yield (kg ha-1) for cv. BR 14 Mulato, during CROPGRO-cow-pea calibration, in 1997 and 1998. Parnaíba, State of Piauí, Brazil.
Year Simulated Observed Difference (%)
1997 2,144 2,189 -2.0
1998 1,736 1,924 -9.8
Medium 1,940 2,056 -5.6
pods and seeds appear, increasing the complexity of
the system. Therefore, accurate simulation of
parti-tioning of assimilated carbohydrates to plant parts
is difficult. Similar results were obtained by Lima
(1995) and Barros (1998), whose models accurately
simulated dry matter during vegetative phase of a
corn crop, but not during reproductive phase.
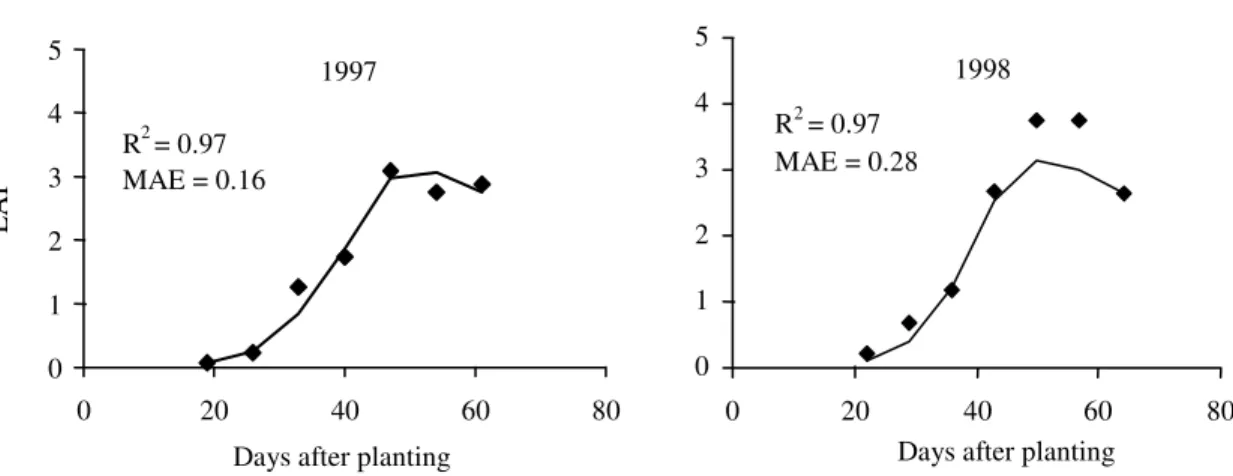
The model showed an excellent performance in
the estimation of LAI, indicated by a high R
2(0.97)
and a low MAE (0.16 to 0.28) (Figure 3).
Observed and simulated LAI values were very
low (<0,25) up to 25 days after planting (DAP),
in-dicating low crop growth in this phase. This is a
common characteristic in cowpea, as observed by
Littleton et al. (1979), Castro et al. (1984), Phogat
et al. (1984) and Sivakumar et al. (1996). Soon
af-ter, an accelerated vegetative growth was observed,
with maximum values of LAI, observed and
simu-lated, varying from 3 to 4.3, in 1997 and 1998,
re-spectively. The number of days to reach the
maxi-mum LAI values ranged from 45 to 60 DAP, which
is in agreement with the results obtained by Littleton
et al. (1979). This variation may be associated with
differences in planting date and seasonal variation
in the air temperature (Summerfield et al., 1983).
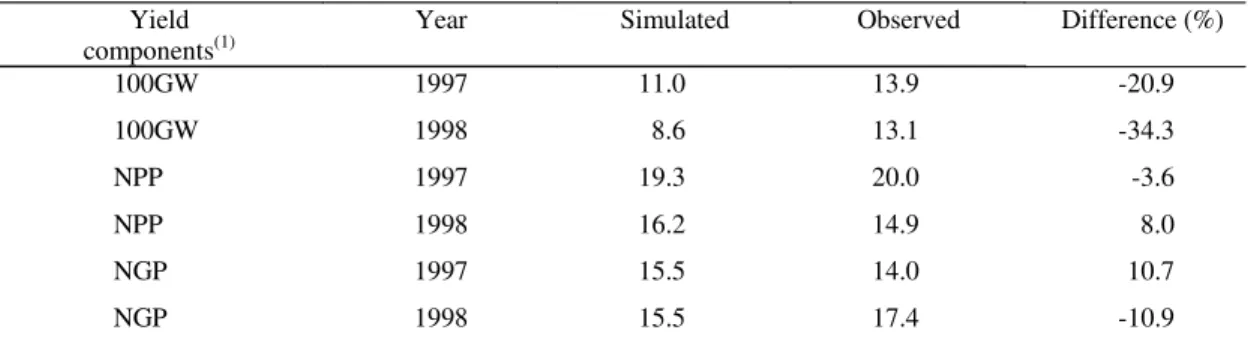
Relatively high deviations were observed in the
100-grain weight estimate, especially in 1998, when
the difference between observed and simulated data
was 34.3% (Table 6). This happened probably due
to high temperature, because, for the model, the
re-productive growth rate, as well as the photosynthate
translocation, are quite small under high
tempera-tures as observed in 1998. However, there was no
significative difference between grain yield observed
and estimated. According to Minchin et al. (1980),
the P100 does not affect the grain yield so much,
10 20 30 40
1 5 9 13 17 21 25 29 33 37 41 45 49 53 57 61 65
Days after planting
Tem
perat
ur
e (
o
C)
Temperature (
0,000 1,000 2,000 3,000 4,000 5,000 6,000 7,000
0 20 40 60 80
Days after planting
R
2= 0.92
MAE
= 325.6 kg ha
-10,000 1,000 2,000 3,000 4,000 5,000 6,000 7,000
0 20 40 60 80
Days after planting
R
2= 0.98
MAE
= 204.3 kg ha
-1Dry
ma
tte
r (k
g ha
-1 )
1997 1998
Figure 2. The observed ( ) and simulated (
__
) cowpea (cv. BR 14 Mulato) dry matter production, in 1997 and 1998. Parnaíba, State of Piauí, Brazil. (MAE: medium absolute error).0 1 2 3 4 5
0 20 40 60 80 Days after planting
L
A
I
R2= 0.97 MAE = 0.16
1997
0 1 2 3 4 5
0 20 40 60 80 Days after planting
1998
R2= 0.97 MAE = 0.28
Figure 3. The observed ( ) and simulated (
__
) cowpea (cv. BR 14 Mulato) leaf area index (LAI), in 1997 and 1998.Parnaíba, State of Piauí, Brazil. MAE (medium absolute error).
which is more influenced by the number of pod per
plant (NPP).
The NPP estimates presented small errors in both
years: 3.6% in 1997 and 8.0% in 1998 (Table 6). Bastos
(1999) also estimated the NPP for cowpea,
consi-dering different plant population (4, 9, 14 and
18 plants m
-2), with medium error of 8.3%. These
re-sults indicate good model accuracy and show that the
CROPGRO-cowpea can be used to estimate the
cow-pea crop grain yield in Piauí State with good
confi-dence level, since NPP is the most important yield
component and is very influenced by the plant
den-sity.
Table 6. Predicted and measured yield components for cv. BR 14 Mulato, during CROPGRO-cowpea calibration.
Parnaíba, State of Piauí, Brazil.
Yield Year Simulated Observed Difference (%)
components(1)
100GW 1997 11.0 13.9 -20.9
100GW 1998 8.6 13.1 -34.3
NPP 1997 19.3 20.0 -3.6
NPP 1998 16.2 14.9 8.0
NGP 1997 15.5 14.0 10.7
NGP 1998 15.5 17.4 -10.9
(1)100GW: 100-grain weight; NPP: number of pod per plant; NGP: number of grain per pod.
observed value in 1997, even considering the
ther-mal stress occurred in 1998. Thus, it can be
con-cluded that the NGP component is not very
sensi-tive to high air temperatures.
The best fit of grain yield was obtained in 1997,
with an error of only 2.0% (Table 5). In 1998, there
was a delay in the planting date (7/31/98) in relation
to the previous year (6/20/97). Thus, in 1998 the
flowering time (about 43 days) of cowpea occurred
during a period of high air temperatures (around
35
oC) (Figure 1), that contributed to reduce both
observed and simulated grain yields by 12 and 19%,
respectively. This was also noted by other authors
(Roberts et al., 1978; Summerfield et al., 1978; Doto
& Whittington, 1981; Shouse et al., 1981; Sivakumar
et al., 1996; Craufurd et al., 1998).
The main problem of the CROPGRO-cowpea is
its deficiency in simulating for dry conditions.
An-other calibration is necessary to supply this gap.
Actually, this model can be used, with
reason-able accuracy, to simulate an economic irrigation
management for cowpea crop and to choose more
favorable planting date. Bastos et al. (2000) applied
this model for Parnaíba region and the results showed
that 50% of soil-water availability provides the best
financial returns. The authors also recommend that
the cowpea should be planted from June to
Septem-ber. Another application of the model is to indicate
a crop management for different plant population
and different manure levels.
Considering the good performance of the model
and the possibility in applying it for various aims,
one can affirm that the CROPGRO-cowpea is an
important tool for helping researchers, producers and
technicians to choose the best cowpea management
for Baixo Parnaíba region.
Conclusion
CROPGRO-cowpea model simulates satisfactorily
the growth and the development of cowpea crop, for
the soil and climate conditions of the Baixo Parnaíba,
Piauí, Brazil, since there is not water deficit.
References
BARROS, A. H. C. Análise do crescimento, do desenvolvimento e da produtividade da cultura do milho
(Zea mays L.):experimentos e modelos. 1998. 85 f.
Dissertação (Mestrado) - Universidade Federal de Viçosa, Viçosa, MG.
BASTOS, E. A. Adaptação do modelo CROPGRO para simulação do crescimento e desenvolvimento do feijão caupi (Vigna unguiculata (L.) Walp.) sob diferentes condições hídricas, no Estado do Piauí. 1999. 91 f. Tese
(Doutorado) - Escola Superior de Agricultura Luiz de Queiroz, Piracicaba.
BOOTE, K. J.; JONES, J. W.; HOOGENBOOM, G. Simu-lation of crop growth: CROPGRO model. In: PEART, R. M.; CURRY, R. B. (Ed.). Agricultural systems modeling and simulation. New York: M. Dekker, 1998a. p. 651-691.
BOOTE, K. J.; JONES, J. W.; HOOGENBOOM, G.; PICKERING, N. B. The CROPGRO model for grain legumes. In: TSUJI, G. Y.; HOOGENBOOM, G.; THORNTON, P. K. (Ed.). Understanding options for agricultural production.
Dordrecht: Kluwer, 1998b. p. 99-128.
CARDOSO, M. J.; ANDRADE JÚNIOR, A. S.; MELO, F. B.; FROTA, A. B. Avaliação agroeconômica da produção de sementes de caupi sob irrigação. Teresina: Embrapa-CPAMN, 1995. 6 p. (Comunicado Técnico, 62). CASTRO, P. R. C.; BERGAMASCHI, H.; SILVEIRA, J. A. G.; MARTINS, P. F. S. Desenvolvimento comparado de três cultivares de caupi, Vigna unguiculata (L.) Walp. Anais da Escola Superior de Agricultura Luiz de Queiroz, Piracicaba, v. 41, n. 2, p. 555-584, 1984.
CRAUFURD, P. Q.; BOJANG, M.; WHELER, T. R.; SUMMERFIELD, R. J. Heat tolerance in cowpea: effect of timing and duration of heat stress. Annals of Applied Biology, Wellesbourne, v. 133, p. 257-267, 1998.
DOTO, A. L.; WHITTINGTON, W. J. Responses of cow-pea (Vigna unguiculata) varieties and their hybrids to
varia-tion in day and night temperature regimes. Annals of Ap-plied Biology, Wellesbourne, v. 97, p. 213-219, 1981.
EHLERS, J. D.; HALL, A. E. Cowpea (Vigna unguiculata L. Walp.). Field Crops Research, Amsterdam, v. 53, p. 187-204, 1997.
HERRIDGE, D. F.; PATE, J. S. Utilization of net photo-synthate for nitrogen fixation and protein production in an annual legume. Plant Physiology, Rockville, v. 60,
p. 759-764, 1977.
HOOGENBOOM, G.; JONES, J. W.; BOOTE, K. J. Mod-eling growth, development, and yield of grain legumes us-ing soygro, pnutgro, and beangro: a review. Transactions of the ASAE, Saint Joseph, v. 35, n. 6, p. 2043-2055, 1992.
LEITE, M. L.; RODRIGUES, J. D.; VIRGENS FILHO, J. S. Avaliação de cultivares de caupi (Vigna unguiculata
(L.) Walp.) quanto à produtividade e componentes de produtividade, sob condições de estufa plástica. Revista de Agricultura, Piracicaba, v. 72, n. 3, p. 375-385, 1997.
LIMA, M. G. Calibração e validação do modelo CERES-maize em condições tropicais do Brasil. 1995. 119 f. Tese (Doutorado) - Escola Superior de Agricultura Luiz de Queiroz, Piracicaba.
LITTLETON, E. J.; DENNET, M. D.; ELSTON J.; MONTEITH, J. L. The growth and development of
cow-peas (Vigna unguiculata) under tropical field conditions 1: leaf area. Journal of Agricultural Science, Cambridge,
England, v. 93, p. 291-307, 1979.
MINCHIN, F. R.; SUMMERFIELD, R. J.; NEVES, C. P. Carbon metabolism, nitrogen assimilation, and seed yield of cowpea (Vigna unguiculata L. Walp.) growth in an
ad-verse temperature regime. Journal of Experimental Botany, Oxford, v. 31, n. 24, p. 1327-1345, 1980.
NIELSEN, S. S.; OSUALA, C. I.; BRANDT, W. E. Early leaf harvest reduces yield but not protein concentration of cowpea seeds. HortScience, Alexandria, v. 29, n. 6, p. 631-632, 1994.
PHOGAT, B. S.; SINGH, D. P.; SINGH, P. Responses of cowpea (Vigna unguiculata (L.) Walp.) and mung bean
(Vigna radiata (L.) Wilczek) to irrigation II: effects on
CO2 exchange, radiation characteristics and growth. Irri-gation Science, Berlin, v. 5, p. 61-72, 1984.
ROBERTS, E. H.; SUMMERFIELD, R. J.; MINCHIN, F. R.; STEWART, K. A.; NDUNGURU, B. J. Effects of air temperature on seed growth and maturation in cowpea (Vigna unguiculata). Annals of Applied Biology,
Wellesbourne, v. 90, p. 437-446, 1978.
SHOUSE, P.; DASBERG, S.; JURY, W. A.; STOLZY, L. H. Water deficit effects on water potential, yield and water use of cowpeas. Agronomy Journal, Madison, v. 73, p. 333-336, 1981.
SIVAKUMAR, M. V. K.; NTARE, B. R.; ROBERTS, J. M. Growth, yield and plant-water relations of four cow-pea (Vigna unguiculata) cultivars in the Sahel. Journal of Agricultural Science, Cambridge, England, v. 126, p. 183-190, 1996.
SUMMERFIELD, R. J.; MINCHIN, F. R.; ROBERTS, E. H.; HADLEY, P. Cowpea. In: SYMPOSIUM ON PO-TENTIAL PRODUCTIVITY OF FIELD CROPS UNDER DIFFERENT ENVIRONMENTS, 1980, Los Baños. Pro-ceedings...Los Baños: International Rice Research Insti-tute, 1983. p. 249-280.
SUMMERFIELD, R. J.; MINCHIN, F. R.; STEWART, K. A.; NDUNGURU, B. J. Growth, reproductive devel-opment and yield of effectively nodulated cowpea plants in contrasting aerial environments. Annals of Applied Biology, Wellesbourne, v. 90, p. 277-291, 1978.
TSUJI, G. Y.; UEHARA, G.; BALAS, S. (Ed.). DSSAT v3. Honolulu: University of Hawaii, 1994. 3 v.
WIEN, H. C. Dry matter production, leaf area development, and light interception of cowpea lines with broad and nar-row leaflet shape. Crop Science, Madison, v. 22, p.