http://www.uem.br/acta ISSN printed: 1679-9275 ISSN on-line: 1807-8621
Doi: 10.4025/actasciagron.v34i3.13424
The performance of the CROPGRO model for bean (
Phaseolus vulgaris
L.)
yield simulation
Evandro Chaves de Oliveira1*, José Maria Nogueira da Costa2, Trazilbo José de Paula Júnior3, Williams Pinto Marques Ferreira4, Flávio Barbosa Justino2 and Leonardo de Oliveira Neves5
1
Instituto Federal do Espírito Santo, BR-259, Km 70, Cx. Postal 256, 29709-910, Campus Itapina, Colatina, Espírito Santo, Brazil. 2
Departamento de Engenharia Agrícola, Centro de Ciências Agrárias, Universidade Federal de Viçosa, Viçosa, Minas Gerais, Brazil. 3
Empresa de Pesquisa Agropecuária de Minas Gerais, Zona da Mata, Viçosa, Minas Gerais, Brazil. 4
Empresa Brasileira de Pesquisa Agropecuária, Sete Lagoas, Minas Gerais, Brazil. 5
Instituto Federal Catarinense, Rio do Sul, Santa Catarina, Brazil. *Author for correspondence. E-mail: [email protected]
ABSTRACT. The aim of this study was to evaluate the CROPGRO-Dry bean model for simulating dry bean yield. The model’s genetic coefficients were calibrated based on the cultivars ‘Pérola’, ‘Ouro Negro’ and ‘Ouro Vermelho’ in Viçosa, State of Minas Gerais, Brazil. The coefficients were adjusted based on two experiments that were performed in 2003 with irrigated and nonirrigated water regimes. An additional experiment with irrigation was conducted in 2004. After calibration, the model simulated the bean yield for the period from 1975 through 2006. The simulations were based on daily data on maximum and minimum air temperatures, total precipitation and global solar radiation. The physical and hydric characteristics of the soil and crop management practices were also included. The results show that the crop model can correctly reproduce the observed yield. This finding may indicate that the model is a useful tool to evaluate the crop response to variability and changing climate.
Keywords: computer simulation, DSSAT, cultivars, Phaseolus vulgaris, yield, forecast date.
Desempenho do modelo CROPGRO-Dry bean na simulação do rendimento de feijão
(
Phaseolus vulgaris
L.)
RESUMO. O presente trabalho teve como objetivo avaliar o modelo CROPGRO-Dry bean como ferramenta de previsão de rendimento de feijão (Phaseolus vulgaris L.), tendo como base as cultivares ‘Pérola’, ‘Ouro Negro’ e ‘Ouro Vermelho’, cultivados em Viçosa, Estado de Minas Gerais. O ajuste dos coeficientes genéticos do modelo foi obtido a partir de dois experimentos realizados em 2003, um conduzido com irrigação e outro em condições de sequeiro. Além destes, outro experimento foi conduzido em 2004, com irrigação. Após o ajuste dos coeficientes, realizou-se a simulação do rendimento do feijoeiro com base em dados de 31 safras entre o período de 1975 a 2006. As simulações foram baseadas em dados meteorológicos diários de temperaturas máxima e mínima do ar, precipitação pluvial e radiação solar global, características físico-hídricas do solo e dados de manejo da cultura. Por meio das análises realizadas nas simulações, verificou-se que o modelo mostrou-se viável como ferramenta para a previsão de rendimento do feijão, obtendo-se estimativa adequada de rendimento com 30 dias de antecedência da colheita.
Palavras-chave: simulação por computador, DSSAT, cultivares, Phaseolus vulgaris, produtividade, previsão de safra.
Introduction
The State of Minas Gerais is the second-highest producer of dry bean (Phaseolus vulgaris L.) in Brazil (IBGE, 2010). The most important groups of bean cultivated in Minas Gerais are “carioca” and “black” (VIEIRA et al., 2005). In the northern, southern and northwestern regions of the State, carioca cultivars are preferred. In the Zona da Mata region, some cultivars of the “red” group are also raised (RAMALHO et al., 1993). At some times of the year, the price of red beans may be twice the price of other beans (VIEIRA, 2005). The production of dry beans is one of the most
Acta Scientiarum. Agronomy Maringá, v. 34, n. 3, p. 239-246, July-Sept., 2012
growing season. It should be emphasized that these models are usually composed of sub-modules that aim to represent different processes occurring in the soil-plant-atmosphere system to simulate crop growth, development and yield.
The last two decades have been marked by the development of more sophisticated crop models. These models include improved representations of crop phenology as a function of accumulated heat units (e.g., the CERES and EPIC models) and relatively detailed soil biogeochemical processes for carbon and nitrogen (e.g., Century, DNDC and EPIC). Recently, process-based models with different levels of complexity have been developed to estimate crop yield in different regions (BETTS, 2005; COSTA et al., 2009; HANSEN, 2005). The Decision Support System for Agrotechnology Transfer (DSSAT) includes a set of models of crop growth and has been widely used in recent years as a useful computational tool in the evaluation of management options associated with environmental conditions (HOOGENBOOM et al., 2003). The modular structure of the DSSAT includes an outstanding model known as CROPGRO. This generic model for legumes allows the simulation of the growth and development of several crops, such as the dry bean, cowpea, peanut and soybean crops.
Examples of the simulation efficiency of CROPGRO were presented by Ruíz-Nogueira et al. (2001), who used the model to evaluate soybean growth and yield under water limitation conditions for three cultivars in different climatic conditions of northeast Spain. Hartkamp et al. (2002) evaluated the performance of CROPGRO to predict phenology, growth, senescence and nitrogen accumulation in locations that represented different scenarios of environmental and agronomic management. The evaluation involved sensitivity analysis of various regimes of temperature and precipitation to identify regions suitable for the production of Mucuna aterrima as green manure. Jagtap and Jones (2002) tested the performance of CROPGRO in predicting soybean yield and observed that the model achieved a performance criterion of 95% in predicting interannual variations in yield.
In Brazil, Faria et al. (1997) used simulations with CROPGRO-Dry bean to evaluate different strategies for the irrigation management of beans in the State of Paraná. Meireles et al. (2003) calibrated the CROPGRO-Dry bean model to quantify decreases in the yield of beans sown on 36 sowing dates in Santo Antônio de Goiás, Goiás State. In a
study conducted in Maringá, State of Paraná, Dallacort et al. (2005) used the model’s simulation of the growth and development of the bean to determine the best sowing times for the cultivar IAPAR 57 from 1980 through 2000.
Sensitivity experiments with CROPGRO to evaluate the effect of meteorological variables on the growth, development and yield of beans may contribute to improved management practices and to a better understanding of the interactions between climate and plants (COSTA et al., 2009; JONES et al., 2003).
In this sense, this study may serve as a tool for small farmers, agro-industrial companies, extension institutions, technical assistance and research institutions, government agencies and development and funding institutions to help in planning agricultural activities with less risk of adverse weather effects.
In view of the importance of beans (Phaseolus vulgaris L.) for the State of Minas Gerais and Brazil and the need for a system of yield prediction, this study was conducted to evaluate the CROPGRO-Dry bean model as a crop-yield forecasting tool for the bean cultivars ‘Pérola’, ‘Ouro Negro’ and ‘Ouro Vermelho’ in Viçosa, Zona da Mata region (State of Minas Gerais, Brazil).
Material and methods
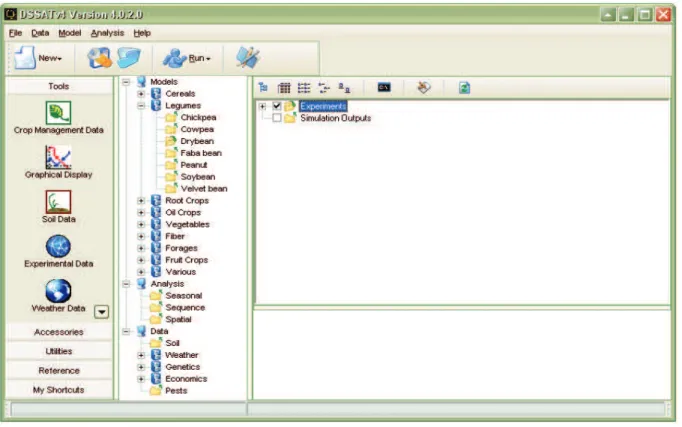
The simulations were performed with the CROPGRO-Dry bean model, included in the DSSAT system, version 4.0.2.0 (HOOGENBOOM et al., 2004), which simulates the growth, development and yield of beans (Phaseolus vulgaris
L.), Figure 1. The construction of the required files for the simulation was described in detail by Boote et al. (1998a, 1998b and 2003). The model allows simulations of the specific conditions of each soil for the principal physical and physiological processes associated with the crop. These processes include photosynthesis, respiration, biomass accumulation and partitioning, phenology, soil water extraction, evapotranspiration and common bean growth and leaf area for both stems and roots as a function of daily climatological variables (rainfall, solar radiation and maximum and minimum temperatures).
Figure 1. Window illustrating the atmosphere-soil-plan database system for the CROPGRO-Dry bean simulation in DSSAT.
Data used in the simulation
Daily weather data and edaphic and crop management information were used as input data for the model. The set of daily weather input variables were taken from 1975 through 2006 and included precipitation, maximum and minimum air temperatures and solar radiation. These data were provided by the 5th District of Meteorology (5 DISME)
of the National Institute of Meteorology (INMET). The location evaluated was Viçosa, Minas Gerais State. The soil of the experimental area is classified as red-yellow podzolic Cambic. Its chemical and physical characteristics are shown in Table 1.
Table 1. Results of sample analysis and classification of the soil (0-40 cm depth) of the experimental area. The chemical and physical analyses were performed at the Laboratory of Soil Analysis (UFV).
H + Al Al Ca Mg K P OM Soil fraction (%) pH in
H2O Cmol(+) dm-3 μg dm-3 dag kg-1 Grit
Fine
Sand Silt Clay
5,9 3.3 0 2.3 0.9 42 9 2.2 19 14 21 46
Texture Class – Clayey; Soil Classification – Red-Yellow Podzolic Cambic (LRd); Organic Matter (OM).
The bean cultivars ‘Pérola’ (carioca group), ‘Ouro Negro’ (black group) and ‘Ouro Vermelho’ (red group) were chosen owing to their economic importance. Fertilization was applied as recommended by Ribeiro et al. (1999). The control
of weeds and pests was performed in accordance with the recommendations for the crop. The sowing dates were March 27, 2003 and March 20, 2004 for the experiments conducted with irrigation. November 20, 2003 was chosen for the experiment conducted during the rainy season and without irrigation.
The sowing was done at a 3-cm depth after the soil was prepared in a conventional manner. The experimental design was completely randomized, with three replications and plots consisting of four rows 0.5 m apart and 4 m long. The average values for adjustment of the genetic coefficients of the model were obtained from these plots.
Calibration and testing of CROPGRO-Dry bean
The calibration and testing of the CROPGRO-Dry bean model for the experimental conditions were performed by adjusting genetic coefficients that characterize the essential aspects of beans, as recommended by Hoogenboom et al. (2003) and Jones et al. (2003).
Acta Scientiarum. Agronomy Maringá, v. 34, n. 3, p. 239-246, July-Sept., 2012
assigned to specific genetic coefficients for growth, beginning with the parameters for phenology and followed by the growth parameters of the crop (HOOGENBOOM et al., 1992). This procedure was performed by a trial-and-error process, i.e., a process in which values were assigned to each factor by determining whether the model generated results close to those measured under field conditions.
The experiment conducted without irrigation in 2003 was used to perform the calibration of CROPGRO-Dry bean, whereas the experiments conducted in the rainy season (2003) and in 2004 were used as independent data for evaluation.
The observed dates of flowering and physiological maturity and yield were statistically compared to the simulated values with the coefficient of determination (r2), the index of agreement (d) (WILLMOTT et al., 1985) and the mean square error (RMSE) (LOAGUE; GREEN, 1991).
Simulation of yield
To evaluate the model as a tool for forecasting bean yield, simulations were performed using a 31-year time series of climate data for the area (1975-2006). The model was developed to simulate the bean yield for the November 20, 2003 sowing date (test year). In the first step, the daily weather data observed during the base year were used. In the second step, the same sowing date was used with a seasonal analysis of the data for all years of the series. In the third step, the seasonal analysis was performed with climate data from the test year for the initial phase of the cycle (first 20 days) and for the rest of the cycle with data for all years of the series. Finally, the historical data were replaced by weekly data that were observed for the year of interest to test the physiological maturity of the crop. The values of the crop yield obtained with simulations using the observed data for the full year were compared with the values obtained by substituting part of the climate data for the historical data. Thus, it was possible to generate a crop yield forecast and define the period of prediction.
Results and discussion
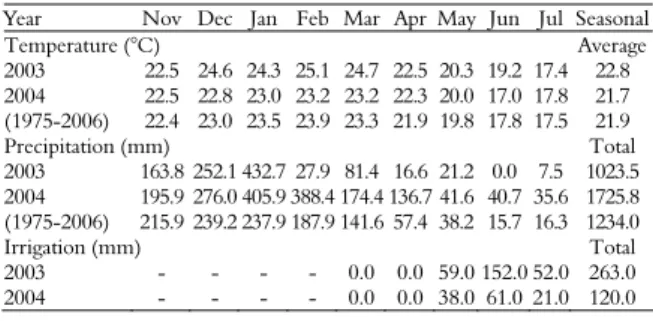
The seasonal temperature and rainfall patterns in the two experimental years were different (Table 2). In 2003, the average air temperature was 1.1 and 0.9°C above that observed in 2004 and in the historic series of 1975-2006, respectively. The total cumulative seasonal rainfall was 17% (2003) and 40% (2004) in relation to the historical average from
1975 through 2006. However, after the rainy season (November through February), irrigation was required from May through July. In 2003, 263 mm of water was applied, and 120 mm was applied in 2004.
Table 2. Mean air temperature and monthly and seasonal rainfall in 2003 and 2004. Viçosa, Minas Gerais State, Brazil.
Year Nov Dec Jan Feb Mar Apr May Jun Jul Seasonal
Temperature (°C) Average
2003 22.5 24.6 24.3 25.1 24.7 22.5 20.3 19.2 17.4 22.8 2004 22.5 22.8 23.0 23.2 23.2 22.3 20.0 17.0 17.8 21.7 (1975-2006) 22.4 23.0 23.5 23.9 23.3 21.9 19.8 17.8 17.5 21.9
Precipitation (mm) Total
2003 163.8 252.1 432.7 27.9 81.4 16.6 21.2 0.0 7.5 1023.5 2004 195.9 276.0 405.9 388.4 174.4 136.7 41.6 40.7 35.6 1725.8 (1975-2006) 215.9 239.2 237.9 187.9 141.6 57.4 38.2 15.7 16.3 1234.0
Irrigation (mm) Total
2003 - - - - 0.0 0.0 59.0 152.0 52.0 263.0
2004 - - - - 0.0 0.0 38.0 61.0 21.0 120.0
Data not collected (-).
Test of the CROPGRO-Dry bean model
Table 3 presents the genetic coefficients of the three bean cultivars for the calibration of the CROPGRO-Dry bean model for the estimation of the growth and development of the plants in the soil conditions and climate of Viçosa, Minas Gerais State. Seven coefficients define the life cycle development characteristics, and eight coefficients define the growth characteristics (BOOTE et al., 2003). According to Didonet and Silva (2004), the Brazilian bean cultivars are generally insensitive to photoperiod (PPSEN = 0), i.e., their development and growth are controlled only by the air temperature, with thermal requirements in photothermal days (dft).
The three cultivars exhibited differences in the following genetic coefficients: the duration of the period between the emergence of the seedlings and the appearance of the first flower; the duration of the period between the appearance of the first flower and the first pod; the duration of the period between the appearance of the first flower and the onset of seed formation; and the duration of the period between the beginning of the formation of seeds and physiological maturity.
Table 3. Genetic coefficients used for the calibration of the CROPGRO-Dry bean model for three cultivars.
Cultivars Coefficients
Pérola Ouro Negro Ouro Vermelho
CSDL 12.17 12.17 12.17
PPSEN 0.0 0.0 0.0
Development parameters
EM-FL 35.5 32.0 34.0
FL-SH 6.0 5.0 6.0
FL-SD 11.0 9.0 10.0
SD-PM 17.0 15.5 16.0
FL-LF 18.0 18.0 18.0
LFMAX 1.0 1.0 1.0
Growth parameters
SLAVAR 270.0 270.0 270.0
SIZLF 100.0 100.0 100.0
XFRT 1.0 1.0 1.0
WTPSD 0.256 0.255 0.255
SFDUR 9.0 9.0 9.0
SDPDV 5.0 5.0 5.0
PODUR 6.5 6.5 6.5
CSDL – critical day length, above which reproductive development is not affected (h);
PPSEN – response inclination for the development of the photophase over time (1 h-1);
EM-FL – period between plant emergence and the appearance of the first flower (R1) (photothermal days); FL-SH – period between the appearance of the first flower and the first pod (R3) (photothermal days); FL-SD – period between the appearance of the first flower and the start of seed formation (R5) (photothermal days); SD-PM – period between the start of seed formation and physiological maturity (R7) (photothermal days); FL-LF – period between the appearance of the first flower (R1) and the end of leaf expansion; LFMAX - maximum leaf photosynthesis rate at an optimal temperature
of 30 ºC; SLAVARN - specific leaf area under standard growth conditions (cm2
); SIZLF
– maximum size of a completely expanded leaf (cm2); XFRT – maximum fraction of
the daily growth that is partitioned between the seed and the pod; WTPSD – maximum weight per seed (g); SFDUR – duration of the grain swelling period in the pods under standard growth conditions (photothermal days); SDPDV – mean seeds per pod under standard growth conditions (photothermal days); PODUR – time necessary for the cultivar to reach ideal pod conditions (photothermal days).
Estimated duration of the phenological stages of the bean
Considerable agreement was evident between the observed and simulated values of the number of days from sowing to flowering and from sowing to maturity for these three bean cultivars (Figure 2). The simulated number of days from sowing to flowering (SF) showed a high coefficient of determination between the simulated and observed values. In addition, the agreement index (d) showed values as high as 0.99. Moreover, the mean square error (RMSE) was 2.97%. These findings show that the CROPGRO-Dry bean model effectively simulated the phenology of the three bean cultivars. The same outcome was observed for the period from sowing to maturity (SM). As shown in Figure
2, the model accurately estimated the period from sowing to physiological maturity and showed high values for the coefficient of determination (r2 =
0.99) and for the index of agreement (d = 0.99). In addition, the RMSE was low (2.47%). These results are consistent with previous studies that showed that the model appeared to simulate the phenology of the bean cultivars adequately (FARIA et al., 1997; MEIRELES et al., 2002).
Days
(s
im
u
la
ted)
100
90
80
70
60
50
40
30
30 40 50 60 70 80 90 100
Days (observed)
Figure 2. Relationship between the number of observed and simulated days from sowing to flowering (SF) and sowing to physiological maturity (SM) for three bean cultivars in trials conducted in 2003 and 2004 in Viçosa, Minas Gerais State, Brazil.
Estimated crop yield
Crop yield was satisfactorily simulated by the CROPGRO-Dry bean model for the three bean cultivars (Table 4). For ‘Perola’ and ‘Ouro Negro’, the observed and simulated values were very similar. The percentage of deviation of the estimate ranged from -5.58 to 6.24%, with rates of agreement that were (d) high (between 0.88 and 0.99) and values of the mean square error (RMSE) under 5%. The performance of the model for the cultivar ‘Ouro Vermelho’ was lower than that for the other two cultivars. The value of the RMSE was 12.63%, and the value of d was 0.91. These differences may be related to the spatial variability of the experimental data.
Table 4. Mean values of the simulated and observed grain yield with the CROPGRO-Dry bean model in the calibration phase for three bean cultivars. Viçosa, Minas Gerais State, Brazil.
Cultivars Experiment Simulated Observed PD(1)
RMSE d
(kg ha-1) (kg ha-1) (%) (%)
Rainy season 2003 1792 1898 -5.58
No irrigation 2003 2222 2125 4.56 4.85 0.88
Perola
2004 2166 2074 4.44
Rainy season 2003 1600 1545 3.56
No irrigation 2003 2249 2261 -0.53 3.88 0.99
Ouro Negro
2004 1908 1796 6.24
Rainy season 2003 1767 1603 10.23
No irrigation 2003 2558 2801 -8.68 12.63 0.91
Ouro Vermelho
2004 2230 2653 -15.94
(1) PD (%) = [(Estimated - Observed) / Observed] x 100.
Acta Scientiarum. Agronomy Maringá, v. 34, n. 3, p. 239-246, July-Sept., 2012
In 2004, a delay in sowing (March 20, 2004) compared with the previous year (February 27, 2003) may have caused the flowering of the bean cultivars in 2004 to occur during a prolonged period of low air temperatures. It is probable that these low temperatures contributed to a decrease in yield from 2125 to 2074 kg ha-1 (2.4%) for ‘Pérola’, 2261 to
1796 kg ha-1 (20.6%) for ‘Ouro Negro’, and 2801 to
2653 kg ha-1 (5.3%) for ‘Ouro Vermelho’. In the
simulation, the CROPGRO-Dry bean exhibited the same trend in yield for the three cultivars. However, it showed reductions of up to 2.5 and 12.8% for ‘Pérola’ and ‘Ouro Vermelho’, respectively. The ‘Ouro Negro’ cultivar was slightly lower (15.1%) compared with the experimental data.
Forecast of the bean yield
Based on the meteorological data for 2003, a simulation of the bean yield from December 5 to February 20 was performed. Figure 3 shows the estimates of the yield for the three bean cultivars and the standard deviations of the estimates. We performed simulations based on weather data for the three cultivars for December 5th through February
20th. The simulation that used the beginning of the
growing season as its initial data exhibited unrealistic values of the yield and high standard deviations. Because no irrigation was used, it is possible that this result was associated with the shortage of water.
In contrast, the simulation of the phenological stages for better-established cultivars showed predicted yields close to the observational data and standard deviations close to zero. The standard deviations of the estimates of yield for December 20th
and January 20th for ‘Pérola’, ‘Ouro Negro’ and ‘Ouro
Vermelho’ ranged from 494 to 222 kg ha-1, 401 to 89 kg
ha-1 and 411 to 131 kg ha-1, respectively. The most
reliable estimates of yields with CROPGRO-Dry bean could be made 30 days in advance of the harvest for the three cultivars. These results are promising because farmers and decision makers could have access to accurate yield forecasts prior to the final harvest. Similarly, the results obtained by Thornton et al. (1997) and Soler et al. (2007), using similar methodology, showed that the accuracy of the estimates of expected income increased toward the end of the growing season. Soler et al. (2007) reported that the CSM-CERES-Maize model can be a promising tool for yield forecasting for maize hybrids grown off season in Piracicaba, São Paulo State, Brazil. An accurate yield forecast was obtained approximately 45 days prior to harvest.
Yield (k
g
ha
-1)
3000
2500
2000
1500
1000
500
0
Dec.-05 Dec.-20 Jan.-05 Jan.-20 Feb.-05 Feb.-20
Forecast date
Yield (k
g
ha
-1)
3000
2500
2000
1500
1000
500
0
Dec.-05 Dec.-20 Jan.-05 Jan.-20 Feb.-05 Feb.-20
Forecast date
Yield (k
g
ha
-1)
3000
2500
2000
1500
1000
500
0
Dec.-05 Dec.-20 Jan.-05 Jan.-20 Feb.-05 Feb.-20
Forecast date
Figure 3. Yield and standard deviations for beans cultivated in the rainy season of 2003 for the ‘Pérola’ (a) ‘Ouro Negro’ (b) and ‘Ouro Vermelho’ (c) cultivars.
Conclusion
The CROPGRO-Dry bean model accurately simulated the phenological development and yield of the bean cultivars ‘Pérola’, ‘Ouro Negro’ and ‘Ouro Vermelho’ for the soil conditions and climate of Viçosa, Minas Gerais State, Brazil.
In addition, the model showed high sensitivity to genetic variation coefficients and exhibited differences between cultivars in the simulations of phenological development and yield and proved to be viable as a tool for forecasting the yield of beans cultivated in the rainy season. Good estimates of the yield were obtained 30 days in advance of the harvest for the bean cultivars ‘Pérola’, ‘Ouro Negro’ and ‘Ouro Vermelho’.
a
b
c
Simulated yield Observed yield
Simulated yield Observed yield
Acknowledgements
We thank the National Council of Scientific and Technological Development (CNPq), the Foundation for Research Support of Minas Gerais (FAPEMIG) and the Coordination of Improvement of Higher Education Personnel (CAPES) for funding the project and for the scholarships granted.
References
BETTS, R. A. Integrated approaches to climate–crop modelling: needs and challenges. Philosophical Transactions of the Royal Society B, v. 360, n. 1463, p. 2049-2065, 2005.
BOOTE, K. J.; JONES, J. W.; HOOGENBOOM, G. Simulation of crop growth: CROPGRO model. In: PEART, R. M.; CURRY, R. B. (Ed.). Agricultural
systems modeling and simulation. New York:
M. Dekker, 1998a. p. 651-691.
BOOTE, K. J.; JONES, J. W.; HOOGENBOOM, G.; PICKERING, N. B. The CROPGRO model for grain legumes. In: TSUJI, G. Y.; HOOGENBOOM, G.; THORNTON, P. K. (Ed.). Understanding options for agricultural production. Dordrecht: Kluwer, 1998b. p. 99-128.
BOOTE, K. J.; JONES, J. W.; BATCHELOR, W. D.; NAFZIGER, E. D.; MYERS, O. Genetic coefficients in the CROPGRO-Soybean Model: links to field performance and genomics. Agronomy Journal, v. 95, n. 1, p. 32-51, 2003. BORÉM, A.; CARNEIRO, J. E. S. A Cultura. In: VIEIRA, C.; PAULA JÚNIOR, T. J.; BORÉM, A. (Ed.).
Feijão. 2. ed. Viçosa: UFV, 2006. p. 13-18.
COSTA, L. C.; JUSTINO, F.; OLIVEIRA, L. J. C.; SEDIYAMA, G.; FERREIRA, W. P. M.; LEMOS, C. F. Potential forcing of CO2, technology and climate changes in maize (Zea mays) and beans (Phaseolus vulgaris) yields in the southern part of Brazil. Environmental Research Letters, v. 4, n. 1, p. 14013-14023, 2009.
DALLACORT, R.; FREITAS, P. S. L.; FARIA, R. T.; GONÇALVES, A. C. A.; REZENDE, R.; BERTONHA, A. Utilização do modelo Cropgro-soybean na determinação de melhores épocas de semeadura da cultura da soja, na região de Palotina, Estado do Paraná. Acta Scientiarum. Agronomy, v. 28, n. 4, p. 583-589, 2006. DALLACORT, R.; REZENDE, R.; FREITAS, P. S. L.; FARIA, R. T.; AZEVEDO, T. L. F.; JÚNIOR, J. B. T. Utilização do modelo Cropgro-drybean na determinação das melhores épocas de semeadura da cultura do feijão para a região de Maringá, Estado do Paraná, Brasil. Acta Scientiarum. Agronomy, v. 27, n. 2, p. 349-355, 2005. DIDONET, A. D.; SILVA, S. C. Elementos climáticos e produtividade do feijoeiro. Informe Agropecuário, v. 25, n. 223, p. 13-19, 2004.
FARIA, R. T.; FOLEGATTI, M. V.; FRIZZONE, J. A.; SAAD, A. M. Determination of a long-term irrigation strategy for drybeans in Parana State-Brazil. Scientia Agricola, v. 54, special issue, p. 155-164, 1997.
HANSEN, J. W. Integrating seasonal climate prediction and agricultural models for insights into agricultural practice. Philosophical Transactions of the Royal Society B, v. 360, n. 1463, p. 2037-2047, 2005.
HARTKAMP, A. D.; HOOGENBOOM, G.; GILBERT, R. A.; TARAWALI, A. J.; GIJSMAN, A. J.; BOWEN, W.; WHITE, J. W. Adaptation of the CROPGRO growth model to velvet bean (Mucuna prurients) II. Culitvar evaluation and model testing. Field Crops Research, v. 78, n. 1, p. 27-40, 2002.
HOOGENBOOM, G.; JONES, J. W.; BOOTE, K. J. Modeling growth, development, and yield of grain legumes using SOYGRO, PNUTGRO, and BEANGRO: a review. Transactions of the ASAE, v. 35, n. 6, p. 2043-2055, 1992.
HOOGENBOOM, G.; JONES, J. W.; WILKENS, P. W.; HUNT, L. A.; PORTES, C. H.; BATCHELOR, W. D.; HUNT, L. A.; BOOTE, K. J.; SINGH, U.; UEHARA, G.; BOWEN, W. T.; GUSMAN, A. J.; DU TOIT, A. S.; WHITE, J. W.; TSUJI, G. Y. Decision support system for agrotechnology transfer: version 4.0. Honolulu: University of Hawaii, 2003. [CD-ROM]
HOOGENBOOM, G.; JONES, J. W.; WILKENS, P. W.; PORTER, C. H.; BATCHELOR, W. D.; HUNT, L. A.; BOOTE, K. J.; SINGH, U.; URYASEV, O.; BOWEN, W. T.; GIJSMAN, A. J.; DU TOIT, A.; WHITE, J. W. E.; TSUJI, G. Y. Decision support system for agrotechnology transfer: version 4.0. Honolulu: University of Hawaii, 2004. [CD-ROM]
IBGE-Instituto Brasileiro de Geografia e Estatística.
Levantamento Sistemático da Produção Agrícola. Rio de Janeiro, v. 23, n. 9, p. 1-80, set. 2010. Available from: <http://www.ibge.gov.br/>. Access on: July 19, 2011. JAGTAP, S. S.; JONES, J. W. Predicting regional soybean yield and production: Adaptation of the CROPGRO soybean simulation model and scaling up yield.
Agriculture, Ecossytems and Environment, v. 93, n. 1-3, p. 78-85, 2002.
JONES, J. W.; HOOGENBOOM, G.; PORTER, C. H.; BOOTE, K. J.; BATCHEALOR, W. D.; HUNT, L. A.; WILKENS, P. W.; SINGH, U.; GIJSMAS, A. J.; RITCHIE, J. T. The DSSAT cropping systems model.
European Journal of Agronomy, v. 18, n. 3-4, p. 235-265, 2003.
LOAGUE, K.; GREEN, R. E. Statistical and graphical methods for evaluating solute transport models: overview and application. Journal of Contaminant Hydrology, v. 7, n. 1-2, p. 51-73, 1991.
MEIRELES, E. J. L.; PEREIRA, A. P.; SENTELHAS, P. C.; STONE, L. F.; ZIMMERMANN, F. J. P. Calibration and test of the cropgro-dry bean model for edaphoclimatic conditions in the savannas of central Brazil. Scientia Agricola, v. 59, n. 4, p. 723-729, 2002.
Acta Scientiarum. Agronomy Maringá, v. 34, n. 3, p. 239-246, July-Sept., 2012
RAMALHO, M. A. P.; ABREU, A. F. B.; RIGHETTO, G. U. Interações de cultivares de feijão por épocas de semeadura em diferentes localidades do Estado de Minas Gerais. Pesquisa Agropecuária Brasileira, v. 28, n. 10, p. 1183-1189, 1993.
RIBEIRO, A. C.; GUIMARÃES, P. T. G.; ALVAREZ, V. H. Recomendações para o uso de corretivos e fertilizantes em Minas Gerais. Viçosa: Comissão de Fertilidade do Solo do Estado de Minas Gerais, 1999. (5º aproximação).
RUÍZ-NOGUEIRA, B.; BOOTE, K. J.; SAU, F. Calibration and use of CROPGRO-soybean model for improving soybean management under rainfed conditions.
Agricultural Systems, v. 68, n. 2, p. 151-173, 2001. SOLER, C. M. T.; SENTELHAS, P. C.; HOOGENBOOM, G. Application of the CSM-CERES-Maize model for planting date evaluation and yield forecasting for maize grown off-season in a subtropical environment. European Journal of Agronomy, v. 27, n. 2-4, p. 165-177, 2007. THORNTON, P. K.; BOWEN, W. T.; RAVELO, A. C.; WILKENS, P. W.; FARMER, G.; BROCK, J.; BRINK, J. E.
Estimating millet production for famine early warning: an application of crop simulation modeling using satellite and ground-based data in Burkina Faso. Agricultural and Forest Meteorology, v. 83, n. 1-2, p. 95-112, 1997. VIEIRA, C. Memórias de meio século de estudo sobre a cultura do feijão. Viçosa: UFV, 2005.
VIEIRA, C.; BORÉM, A.; RAMALHO, M. A. P.; CARNEIRO, J. E. S. Melhoramento de espécies cultivadas. Viçosa: UFV, 2005.
WILLMOTT, C. J.; AKLESON, G. S.; DAVIS, R. E.; FEDDEMA, J. J.; KLINK, K. M.; LEGATES, D. R.; O’DONNELL, J.; ROWE, C. M. Statistic for the evaluation and comparison of models. Jounal of Geophysical Research, v. 90, n. 5, p. 8995-9005, 1985.
Received on May 16, 2011. Accepted on September 23, 2011.