Vol.57, n.1: pp. 110-118, January/February 2014
ISSN 1516-8913 Printed in Brazil BRAZILIAN ARCHIVES OF
BIOLOGY AND TECHNOLOGY
A N I N T E R N A T I O N A L J O U R N A L
Stability of Phenolic Compounds and Antioxidant Capacity
of Regular and Decaffeinated Coffees
Silvio José Valadão Vicente
1*, Yara Severino Queiroz
2, Sabina Léa Davidson Gotlieb
3and
Elizabeth Aparecida Ferraz da Silva Torres
21Departamento de Ecotoxicologia; Universidade Santa Cecília; Santos - SP - Brasil. 2Departamento de Nutrição;
Faculdade de Saúde Pública; Universidade de São Paulo; São Paulo - SP - Brasil. 3Departamento de Epidemiologia; Faculdade de Saúde Pública; Universidade de São Paulo; São Paulo - SP - Brasil
ABSTRACT
This study compared the regular and decaffeinated coffees in relation to antioxidant capacity, levels of some antioxidant molecules and stability of these parameters over a six-month period under different storage conditions. The regular coffee samples analyzed right after the industrial production showed higher antioxidant capacity (ORAC and DPPH), the same levels of phenolic compounds and higher levels of phenolic acids than decaffeinated coffee. After six months, the closed packs of both the grades kept under vacuum at 20°C did not show significant changes from the initial results; the open packs stored at 4°C showed small but statistically significant reductions and the open packs stored at 20°C showed higher and statistically significant losses (p < 0.05). Oxygen was the most important factor for these losses but temperature also played an important role. Tests showed that the storage conditions were very important to preserve the quality of coffees regarding the analyzed parameters.
Key words: Coffee, antioxidant capacity, phenolic compounds, caffeine, ORAC, DPPH
*Author for correspondence: [email protected]
INTRODUCTION
Oxidative stress is a dangerous and undesirable condition caused by increased levels of reactive species and free radicals in the organisms. It has been associated to degenerative diseases and aging (Lee et al. 2004; Santos et al. 2007; Valko et al. 2007). Anti-oxidative functional foods contain natural substances capable of providing beneficial health effects reducing the formation of reactive species, inhibiting their action, or quenching them before they can exert their deleterious effects (Lee et al. 2004). Fruits, vegetables, coffee, tea, onion and garlic, red wine and cocoa contain important quantities of natural antioxidants and most of them are used in a balanced diet (Singh et al. 2004; Mattila et al. 2006).
Coffee contains several antioxidant substances such as phenolic compounds, melanoidins, caffeine and Maillard reaction products (Andrade and Morales 2005; Sánchez-Gonzáles et al. 2005; Morais et al. 2009; Pérez-Martínez et al. 2010). It is used worldwide to prepare a beverage that is appreciated not only for its pleasant taste and aroma but also because of its stimulating qualities (Ross et al. 2006; Pérez-Martínez et al. 2010). Its use helps to prevent cardiovascular damages, reduces fatigue and improves perception and learning capacity (Sánchez-Gonzáles et al. 2005; Farah and Donangelo 2006; Parras et al. 2007). In addition, phenolic acids present in coffee have been correlated to chemoprevention, i.e., the use of
development before invasion and metastasis occur (Yeh and Yen 2006; Parras et al. 2007).
Besides caffeine (0.58 - 1.70 % in Coffea arabica,
1.16 - 3.27 % in C. robusta), very small quantities
of other xanthines such as theobromine (up to 20 mg/kg) and theophylline (up to 5 mg/kg) are also present in coffee (Spiller 1998). As cited by López-Galilea et al. (2008) and Vignoli et al. (2011), caffeine presents antioxidant properties according to different assays but its activity is unclear in the coffee matrix. Among other biological effects, the ingestion of caffeine stimulates the central nervous system, increases the metabolic rate, enlarges the loss of calcium, and affects the cardiovascular system (Spiller, 1998).
Several studies have mentioned that the quality of coffee decreases over the course of its storage through the loss of volatile compounds and oxidative reactions (Mayer and Grosch 2001; Ross et al. 2006). McGee (2004) reported that the room temperature shelf-life of ground coffee was only several days while whole coffee beans could be stored for several weeks at room temperature, or several months under refrigeration. Ross et al. (2006) reported that ground coffee stored for longer than a week presented differences in relation to freshly ground coffee regarding sensory qualities such as aroma, flavor and bitterness. However, these studies investigated subjective changes and they were not proved through chemical analysis.
Given that coffee is not consumed immediately after the industrial production and the packs are kept closed at the point of purchase, or open at home for different periods and under different storage conditions, this work aimed to study the changes in it (1) evaluating its antioxidant capacity, (2) quantifying some antioxidant molecules, and (3) measuring the stability of these parameters over a six-month period. Considering that the consumption of decaffeinated coffee surpassed 10 % of global coffee production (Farah et al. 2006; ABIC 2008), regular and decaffeinated coffees were analyzed to compare their results.
MATERIALS AND METHODS
Samples description and preparation
Medium roast (grade 3) regular and decaffeinated
Brazilian coffees (Coffea arabica var. Bourbon
blended with 15 to 30% of Coffea canephora var.
Robusta) packed under vacuum in 500-g
aluminized bags with an external cardboard box were acquired from the local stores. For each type of coffee, six packs from three different batches were bought, all produced in the same month. Packs 1, 2 and 3 of each batch were kept closed and under vacuum at 20°C to be analyzed after two, four and six months. Packs 4, 5 and 6 of each batch were open, mixed, analyzed and divided in two equal samples that were stored at 4°C (refrigerator) and 20°C in the dark, to be reanalyzed after two, four and six months. All the tests were done with fresh coffee infusions prepared using 80 g of coffee powder (dry matter) per liter of mineral water at 90°C (ABIC 2008). Coffee infusions were manually filtered through coffee paper filters.
Chemicals
Caffeic, ferulic, p-coumaric and gallic acids, Folin-Ciocalteu reagent, DPPH
(1,1’-diphenyl-2-picrylhydrazyl), Trolox
(6-hydroxy-2,5,7,8-tetramethylchroman-2-carboxylic acid) and AAPH (2,2’-azobis(2-amidinopropane) dihydrochloride) were purchased from Sigma-Aldrich Co. (USA). Caffeine was bought from Fluka Chemie GmbH (Germany). Methanol HPLC grade and acetic acid were supplied by Merck KgaA (Germany).
Instrumentation
A HPLC system (TSP-USA) with a quaternary pump, an automatic injector and a dual-channel
detector equipped with a C18 Microsorb® MV
column (250 x 4.6 mm, 5µm of particle size) manufactured by Varian Inc. (USA) was used for the chromatographic tests. A spectrophotometer model 1650 (Shimadzu-Japan) and a fluorimeter model FL-55 (Perkin Elmer-UK), both with a 10 mm temperature-controlled cell were used for the spectroscopic tests.
Phenolic compounds
This analysis was done by visible spectroscopy in accordance to Genovese et al. (2003). Basically, 0.25 mL of coffee infusion, diluted 1:200 (v/v) with demineralized water was mixed with 2.0 mL of demineralized water and 0.25 mL of Folin-Ciocalteu reagent (1:10 v/v). After three minutes
at ambient temperature, 0.25 mL of Na2CO3
were calculated in mg of gallic acid equivalent/mL (mg GAE/mL) using a calibration curve of this standard ranging from 0.01 to 0.05 mg/mL.
Phenolic acids
To quantify the phenolic acids present in coffee infusions, they were hydrolyzed prior to the analysis according to Nardini et al. (2002a). Free phenolic acids obtained after the hydrolysis were diluted 1:40 (v/v) with demineralized water and quantified by HPLC in accordance to Kowalski and Wolski (2003) with small modifications. Basically, 20 µL of hydrolyzed and diluted coffee samples were injected into the HPLC using water/methanol/acetic acid (75/24/1 v/v) as mobile phase at 0.8 mL/min. The dual-channel detector was set at 309 nm for p-coumaric acid and at 323 nm for caffeic and ferulic acids. A previous standardization of the method was done (Vicente et al. 2011), the quantification was performed using external standard curves and the results were
expressed in µg/mL of coffee infusion.
DPPH test
This analysis was developed by visible
spectroscopy in accordance to Brand-Williams et al. (1995). Basically, 750 µL of the coffee infusion diluted 1:200 (v/v) with demineralized water was mixed with 1,500 µL of DPPH (20 mg/L) in methanol. The absorbance was recorded at 517 nm from 0 to 20 min to construct the graph of absorption (AU) versus time (min). The absorption of a standard containing 750 µL of methanol and 1,500 µL of DPPH was also measured and the antioxidant capacities of the samples were calculated using the appropriate equation. The results were expressed as percent of antioxidant capacity (% AC).
Oxygen radical absorbance capacity (ORAC) The antioxidant capacity of the coffee infusions was also measured by ORAC using fluorescence spectroscopy (excitation 494 nm, emission 515 nm) in accordance to Ou et al. (2001). The test solutions were prepared mixing 300 µL coffee infusion diluted 1:4,000 (v/v) with phosphate buffer (pH = 7.4), 2,700 µL of phosphate buffer, 15 µL of fluorescein (440 mg/L in phosphate buffer) and 300 µL of AAPH (60 g/L in phosphate buffer). The fluorescence was measured at 37°C in intervals of 5 min. The graph of fluorescence intensity (FI) versus time (min) was prepared and the area under the curve was calculated using the
appropriated equation. A blank was prepared replacing the sample by 300 µL of phosphate buffer and Trolox standards were prepared replacing the sample by 300 µL of its 5 to 40 µM solutions. The results were expressed as Mmolar of Trolox equivalent/liter (mM TE/L).
Moisture
The moisture of ground coffees was determined as recommended by AOAC (1995). About 10 g of a representative sample was weighed with a precision of ± 0.1 mg, dried at 105°C for 5 h, cooled and weighed. The results were expressed as % of humidity (w/w).
Statistical calculations
Kolmogorov-Smirnov, Student’s t test and Pearson’s correlation test were performed using
the software SPSS® 16.0 for Windows® with a
significance level of p < 0.05. All the tests were done in triplicate and the results were presented as means ± standard deviations.
RESULTS AND DISCUSSION
Moisture
Considering that coffee infusions should be prepared using 80 g of coffee powder (dry basis) per liter of water, it was necessary to measure the water content of both the coffees along the study to compensate eventual changes. The difference between the initial means of regular and decaffeinated coffees was small but statistically significant (p < 0.001) (Table 1).
Table 1 - Evolution of moisture (% w/w) of regular and decaffeinated coffees over a six-month period under different storage conditions (n = 3).
Coffee type Storage* Initial 2 months 4 months 6 months
Regular
C at 20°C
2.48 ± 0.04a
2.49 ± 0.08a 2.45 ± 0.05a 2.50 ± 0.02a
O at 4°C 2.47 ± 0.03a 2.45 ± 0.07a 2.48 ± 0.01a
O at 20°C 2.86 ± 0.14b 3.04 ± 0.16b 3.06 ± 0.06b
Decaffeinated
C at 20°C
2.33 ± 0.03c
2.31 ± 0.03c 2.32 ± 0.05c 2.30 ± 0.04c
O at 4°C 2.37 ± 0.02c 2.33 ± 0.06c 2.28 ± 0.07c
O at 20°C 2.77 ± 0.11d 2.92 ± 0.11d 2.95 ± 0.09d
*C = closed under vacuum at 20°C; O = open at different temperatures. Different superscript letters in the same line indicate statistically significant differences (p < 0.05).
Phenolic compounds
The comparison of initial means of regular (3.52 ± 0.21 mg GAE/mL) and decaffeinated (3.55 ± 0.28 mg GAE/mL) coffees did not show a statistically significant difference (p = 0.836). For regular brewed coffee, Sánchez-González et al. (2005) found from 2.5 to 2.9 mg GAE/mL and Pérez-Martínez et al. (2010) reported from 2.9 to 4.4 mg GAE/mL (results adjusted to 80 g of coffee powder/liter of water). These results were similar to the present study despite the differences in the origin of coffee and brewing methods.
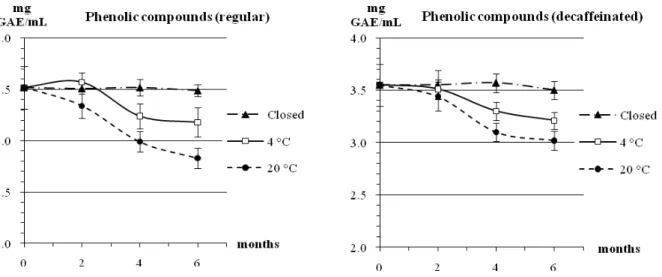
After six-months, the open packs of regular coffee showed statistically significant reductions equals to 9.7 % at 4°C and 19.6% at 20°C, while the vacuum-sealed samples stored at 20°C did not show statistically significant differences in relation to their initial values. Likewise, after the same period, the open packs of decaffeinated coffee showed statistically significant reductions equals to 9.5% at 4°C and 14.9% at 20°C, while the vacuum-sealed packs showed similar results in relation to their initial values. The evolution of phenolic compounds is shown in Figure 1.
Figure 1 - Evolution of phenolic compounds (mg GAE/mL) in regular and decaffeinated coffees over a six-month period under different storage conditions (n = 3).
Most phenolic compounds show antioxidant activity based on hydrogen donation abilities (Lee et al. 2004). After donating a hydrogen atom (H*), these substances are converted into oxidized resonance-stabilized radicals, which do not react with the Folin-Ciocalteu reagent to produce the molybdenum blue complex. This explained the
observed reductions of phenolic compounds along the experiment.
important role within the tested range, given that the losses at 20°C observed for the open packs were about the double than the losses observed at 4°C. The levels of phenolic compounds found in both the coffees indicated that coffee could be an important source of these substances. Considering that a balanced diet should contain about 1.0 g/day of phenolic compounds (Manach et al. 2004), a single serving of 50 mL of coffee could supply about 17% of these substances per day. These results showed that coffee could be considered an antioxidative functional beverage due to the presence of the antioxidant molecules but the storage conditions were important to preserve this attribute.
Phenolic acids
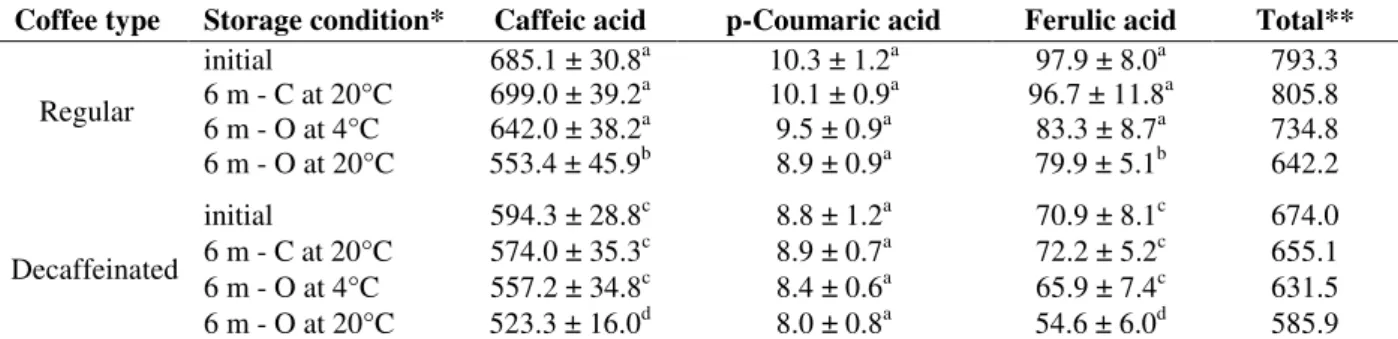
The extraction of caffeine to less than 0.1 % (w/w) during the industrial production of decaffeinated coffee (Toci et al. 2006) always results in concomitant losses of other substances such as chlorogenic acids, phenolic acids and related compounds (Farah et al. 2006). Hence, the initial
means obtained for caffeic and ferulic acids were higher in regular coffee than in decaffeinated coffee while p-coumaric acid showed equivalent results in both of them (Table 2).
After six months, the vacuum-sealed packs and the open packs stored at 4°C of both coffees did not show statistically significant reductions in relation to their respective initial values. On the other hand, the open packs stored at 20°C showed statistically significant reductions for caffeic and ferulic acids while p-coumaric acid remained the same (Table 2). These results indicated that caffeic and ferulic acids were more sensitive to the presence of oxygen at ambient temperature while p-coumaric acid was more stable under these conditions.
The initial levels of phenolic acids found in regular coffee were lower than the results
published in other studies (Mattila and
Kumpulainen 2002; Nardini et al. 2002b; Mattila et al. 2006) even using a higher ratio coffee powder/water to prepare the infusions (Table 3).
Table 2 - Initial and after six months contents of caffeic, p-coumaric, ferulic and total phenolic acids (µg/mL of infusion) of regular and decaffeinated coffees stored under different conditions (n = 3).
Coffee type Storage condition* Caffeic acid p-Coumaric acid Ferulic acid Total**
Regular
initial 685.1 ± 30.8a 10.3 ± 1.2a 97.9 ± 8.0a 793.3
6 m - C at 20°C 699.0 ± 39.2a 10.1 ± 0.9a 96.7 ± 11.8a 805.8 6 m - O at 4°C 642.0 ± 38.2a 9.5 ± 0.9a 83.3 ± 8.7a 734.8 6 m - O at 20°C 553.4 ± 45.9b 8.9 ± 0.9a 79.9 ± 5.1b 642.2
Decaffeinated
initial 594.3 ± 28.8c 8.8 ± 1.2a 70.9 ± 8.1c 674.0
6 m - C at 20°C 574.0 ± 35.3c 8.9 ± 0.7a 72.2 ± 5.2c 655.1 6 m - O at 4°C 557.2 ± 34.8c 8.4 ± 0.6a 65.9 ± 7.4c 631.5 6 m - O at 20°C 523.3 ± 16.0d 8.0 ± 0.8a 54.6 ± 6.0d 585.9 *C = closed under vacuum at 20 °C; O = open at different temperatures. **Total column exhibits the sum of caffeic, p-coumaric and ferulic acids. Different superscript letters in the same column indicate statistically significant differences in relation to the respective initial value (p < 0.05).
Table 3 - Comparison of the levels of phenolic acids (µg/mL of infusion) found in regular coffee in different studies and the respective quantities of coffee powder (g/L) used to prepare the infusions.
References Phenolic acids (µg////mL) Infusion
Caffeic p-Coumaric Ferulic (g////L)
Mattila and Kumpulainen (2002) 870.0 ± 22.0 12.7 ± 0.5 91.0 ± 3.6 50 Nardini et al. (2002b) 830.0 ± 69.9 14.0 ± 1.1 142.8 ± 12.3 60 Mattila et al. (2006) 960.0 ± 31.3 13.7 ± 0.6 90.0 ± 3.0 54
Present study 685.1 ± 30.8 10.3 ± 1.2 97.9 ± 8.0 80
A plausible explanation could be the species of coffee cultivated in Brazil combined with the mild Brazilian climate since phenolic acids such as caffeic, p-coumaric and ferulic acids are secondary
Automatic brewing machines work at a pressure of 15 bar while manual filtrations work at atmospheric pressure. As stated by López-Galilea et al. (2007), pressure-brewing machines such as espresso and mocha allow a better extraction of coffee components than plunger and filter procedures.
The high levels of phenolic acids confirmed that coffee infusion was a powerful antioxidative beverage. These three phenolic acids have been associated to chemoprevention as they increase the transcription of phase II and antioxidant enzymes, improving the protection against oxidative stress (Yeh and Yen 2006; Vicente et al. 2011). However, the losses found in open packs at 20°C indicated that coffee was sensitive to oxygen at ambient temperature and for this reason, coffee must be consumed as soon as possible after the opening of the packs, or stored in a refrigerator to preserve this quality.
DPPH
The antioxidant capacity of foods is frequently evaluated by the DPPH test that estimates the free radical scavenging capacity of the samples by measuring the reduction of the stable free radical DPPH* through the abstraction of an H* from a
reducing donator (Santos et al. 2007; Morais et al. 2009).
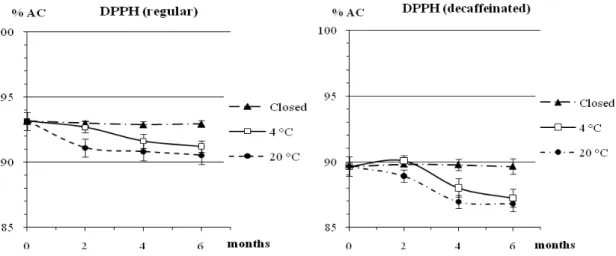
The initial means obtained for the regular and decaffeinated coffees showed that both the samples had strong antioxidant characteristics and had a statistically significant difference (p < 0.001). The mean obtained for the regular coffee surpassed 3.9% of the mean obtained for the decaffeinated coffee. This could be due to higher levels of phenolic acids and caffeine (strong antioxidant molecules) in regular coffee. A solution containing 1.5% (w/v) of caffeine dissolved in distilled water was prepared and evaluated through the DPPH test and the result was able to justify 53.7% of the initial difference between the two coffees. Due to the very low levels of theobromine and theophylline in coffees, their contribution in this test was not significant. After the six-month period, the open packs of regular coffee showed statistically significant reductions equals to 2.1% at 4°C and 2.8% at 20°C. Since the vacuum-sealed samples did not show significant reductions, it was possible to conclude that oxygen was the main factor related to these changes, while temperature practically did not affect the results within the tested range (Fig 2).
Figure 2- Evolution of DPPH results (% AC) of regular and decaffeinated coffees over a six-month period under different storage conditions (n = 3).
The open packs of regular coffee stored at 20°C were analyzed according to the Pearson’s test for the variables DPPH versus phenolic compounds and DPPH versus phenolic acids resulting in linear, positive and statistically significant
the reduction of the DDPH results along the six-month period as a consequence of the loss of the mentioned substances.
After the six-month period, the open packs of decaffeinated coffee also exhibited statistically significant reductions equals to 2.7% at 4°C and 3.2% at 20°C. Once more, the vacuum-sealed samples did not show significant reductions confirming that oxygen was the main factor related to the reductions, and temperature practically did not affect the results of the tests (Fig 2).
The open packs of decaffeinated coffee stored at 20°C were also analyzed through the Pearson’s test for the variables DPPH versus phenolic compounds and DPPH versus phenolic acids
exhibiting linear, positive and statistically
significant correlations equals to 0.996 (p = 0.004) and 0.956 (p = 0.044), respectively. These results corroborated the findings obtained for the regular
coffee, demonstrating excellent correlations
between the DPPH assay and the levels of these antioxidant molecules in decaffeinated coffee.
ORAC
This is another test frequently used to estimate the
antioxidant capacity of foods. It evaluates the capacity of the sample to protect a fluorescent
probe (fluorescein) from the attack of the free radical AAPH* in the reaction media. This method provides a unique and complete assessment, in which both the inhibition time and inhibition degree are measured as the reaction goes to completion (Ou et al. 2001).
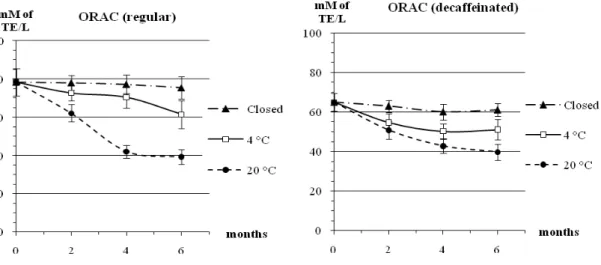
The initial mean for regular coffee was 17.2% higher than the one obtained for decaffeinated coffee, resulting in a statistically significant difference (p < 0.001). Since most important compositional difference between the regular and decaffeinated coffees was the presence of caffeine in the first one (Farah et al. 2006), a solution containing 1.5% (w/v) of this xanthine was prepared and tested, showing an ORAC value that explained 67.1% of the difference between these samples. Again, the very low levels of theobromine and theophylline in coffees reduced their contribution in this test.
After six months, the means obtained for the open packs of regular coffee showed statistically significant reductions equals to 21.6% at 4°C and 49.9% at 20°C. The same tendency was observed for the decaffeinated coffee that showed statistically significant reductions equals to 21.3% at 4°C and 43.4% at 20°C (Fig 3).
Figure 3 - Evolution of ORAC values (mM of Trolox equivalent/L) in regular and decaffeinated coffees over a six-month period under different storage conditions (n = 3).
As the vacuum-sealed samples of both the coffees did not present significant reductions over the six-month period, it was concluded that the losses observed in the open samples were related to oxidation reactions caused by the oxygen present
antioxidant molecules in both the coffees were a solid argument to justify the reductions of ORAC observed in the open samples. Antioxidant molecules have low electrochemical potentials that result in a high tendency to be oxidized. Once oxidized, these molecules lose the ability to protect the fluorescein from the attack of the free radical AAPH*, reducing their ORAC values. The variables ORAC versus phenolic compounds and ORAC versus phenolic acids of regular coffee stored at 20 °C were submitted to the Pearson’s test showing linear, positive and statistically significant correlations equals to 0.981 (p = 0.019) and 0.974 (p = 0.026), respectively. On the other hand, decaffeinated coffee stored at 20°C showed a linear, positive and statistically significant correlation equals to 0.994 (p = 0.006) for the variables ORAC versus phenolic acids but a linear, positive and not statistically significant correlation equals to 0.935 (p = 0.065) for the variables ORAC versus phenolic compounds. Once more, the results showed a straight correlation between this assay and the antioxidant substances present in the coffees.
The ORAC results confirmed that coffee was a
potent antioxidant beverage capable of
neutralizing free radicals, reducing the risks associated to oxidative stress. This conclusion confirmed the results already discussed in the DPPH item.
CONCLUSIONS
Based on the results, it could be concluded that:
a) Regular and decaffeinated coffees were not very hygroscopic materials, if properly stored;
b) Regular coffee had the same levels of phenolic compounds and higher levels of phenolic acids when compared to decaffeinated coffee;
c) Both the coffees produced potent antioxidant beverages that could help the organisms to reduce the consequences of oxidative stress. The presence of phenolic acids in both the coffees indicated that they could be used for chemoprevention;
d) The extraction of caffeine during the production of decaffeinated coffee reduced the levels of phenolic acids as well as the antioxidant capacity measured by the ORAC and DPPH assays;
e) Both the coffees stored under vacuum along six months did not present any reduction of the parameters analyzed in this study. Their storage in
a refrigerator showed much smaller losses when compared to those stored at ambient temperature for six months;
f) The antioxidant capacity measured by the ORAC and DPPH showed good relationship to the
levels of antioxidant molecules phenolic
compounds and phenolic acids.
ACKNOWLEDGEMENT
This work was financially supported by the State of São Paulo Research Foundation (FAPESP) and
the National Council for Scientific and
Technological Development (CNPq).
REFERENCES
ABIC – Associação Brasileira do Café. Jornal Eletrônico da ABIC [Internet]. Rio de Janeiro: December 2008; accessed in November 2009.
Available from:
http://www.abic.com.br/scafe_dicas.hmtl.
Andrade CD, Morales FJ. Unraveling the contribution of melanoidins to the antioxidant activity of coffee brews. J Agric Food Chem. 2005; 53: 1403-1407. AOAC – Association of Official Analytical Chemists.
Official methods of analysis of the AOAC. 16th edition, Arlington: 1995.
Brand-Williams W, Cuvelier ME, Berset C. Use of free radical method to evaluate antioxidant activity. LWT – Food Sci Tecnol. 1995; 28: 25-30.
Farah A, Donangelo CM. Phenolic compounds in coffee. Braz J Plant Phisiol. 2006; 18(1): 26-36. Farah A, Paulis T, Moreira DP, Trugo LC, Martin PR.
Chlorogenic acids and lactones in regular and water-decaffeinated Arabica coffees. J Agric Food Chem. 2006; 54: 374-381.
Genovese MI, Santos RJ, Hassimoto NMA, Lajolo FM. Determinação do conteúdo de fenólicos totais em frutas. Braz J Pharm Sci. 2003; 39: 167-169.
Kowalski R, Wolski T. Evaluation of phenolic acids content in Silphium perfoliatum L. leaves, inflorescences and rhizomes. Elec J Pol Agric Univ.
2003; 6(1): 9-17.
Lee J, Koo N, Min DB. Reactive oxygen species, aging and antioxidant nutraceuticals. Compreh Rev Food Sci Food Saf. 2004; 3: 21-33.
López-Galilea I, Penã MP, Cid C. Application of multivariate analysis to investigate potential antioxidants in conventional and torrefacto roasted coffee. Eur Food Res Technol. 2008; 227: 141-149. Manach C, Scalbert A, Morand C, Rémésy C, Jimenez
L. Polyphenols: food sources and bioavailability. Am J Clin Nut. 2004; 79: 727-747.
Mattila P, Kumpulainen J. Determination of free and total phenolic acids in plant-derived foods by HPLC with diode-array detection. J Agric Food Chem.
2002; 50: 3660-3667.
Mattila P, Hellström J, Törrönen R. Phenolic acids in berries, fruits and beverages. J Agric Food Chem.
2006; 54: 7193-7199.
Mayer F, Grosch W. Aroma simulation on the basis of the odorant composition of roasted coffee headspace.
Flav Frag. J. 2001; 16: 180-190.
McGee H. On food and cooking. Scribner Publishers. New York: 2004.
Morais SAL, Aquino FJT, Nascimento PM, Nascimento EA, Chang R. Bioactive compounds and antioxidant activity of Conilon coffee submitted to different degrees of roasting. Quím Nova. 2009; 32(2): 327-331.
Nardini M, Cirillo E, Natella F, Mencarelli D, Comisso A, Scaccini C. Detection of bound phenolic acids: prevention by ascorbic acid and EDTA of degradation of phenolic acids during alkaline hydrolysis. Food Chem. 2002a; 79: 119-124.
Nardini M, Cirillo E, Natella F, Scaccini C. Absorption of phenolic acids in humans after coffee consumption. J Agric Food Chem. 2002b; 50: 5735-5741.
Ou B, Hampsch-Woodill M, Prior RL. Development and validation of an improved oxygen radical absorbance capacity assay using fluorescein as the fluorescent probe. J Agric Food Chem. 2001; 4: 4619-4626.
Parras P, Martinez-Tomé M, Jiménez AM, Murcia MA. Antioxidant capacity of coffees of several origins brewed following three different procedures. Food Chem. 2007; 102: 582-592.
Pérez-Martínez M, Caemmerer B, Peña MP, Cid C, Kroh LW. Influence of brewing method and acidity regulators on the antioxidant capacity of coffee brews. J Agric Food Chem. 2010; 58: 2958-2965.
Ross CF, Pecka K, Weller K. Effect of storage conditions on the sensory quality of ground Arabica coffee. J Food Qual. 2006; 29: 596-606.
Sánchez-Gonzáles I, Jiménez-Escrig A, Calixto-Saura F. In vitro antioxidant activity of coffees brewed using different procedures (Italian, espresso and filter). Food Chem. 2005; 90: 133-139.
Santos MH, Batista BL, Duarte SMS, Abreu CMP, Gouvêa CMCP. Influência do processamento e da torrefação sobre a atividade antioxidante do café (Coffea arabica). Quím Nova. 2007; 30(3): 604-610. Singh RP, Sharad S, Kapur S. Free radicals and
oxidative stress in neurodegenerative diseases: relevance of dietary antioxidants. J Indian Acad Clin Med. 2004; 5(3): 218-225.
Spiler MA. The chemical components of coffee. In: Spiller GA, editor. Caffeine. Boca Raton: CRC Press; 1998.
Toci A, Farah A, Trugo LC. Efeito do processo de descafeinização com diclorometano sobre a composição química dos cafés arábica e robusta antes e após a torrefação. Quím Nova. 2006; 29(5): 965-971.
Valko M, Leibfritz D, Moncol J, Cronin MTD, Mazur M, Telser J. Free radicals and antioxidants in normal physiological functions and human diseases. Int J Biochem Cell Biol. 2007; 39: 44-84.
Vicente SJV, Ishimoto EY, Cruz RJ, Pereira CDS, Torres EAFS. Increase of the activity of phase II antioxidant enzymes in rats after a single dose of coffee. J Agric Food Chem. 2011; 59: 10887-10892. Vignoli JA, Bassoli DG, Benassi MT. Antioxidant
activity, polyphenols, caffeine and melanoidins in soluble coffee: The influence of processing conditions and raw material. Food Chem. 2011; 124: 863-868.
Yeh CT, Yen GC. Induction of hepatic antioxidant enzymes by phenolic acids in rats is accompanied by increased levels of multidrug resistance-associated protein 3 mRNA expression. J Nutr. 2006; 136: 11-15.