Adsorption of Cu(II), Cd(II), and Pb(II) from aqueous single metal solutions
by mercerized cellulose and mercerized sugarcane bagasse chemically
modified with EDTA dianhydride (EDTAD)
Osvaldo Karnitz Júnior
a, Leandro Vinícius Alves Gurgel
a, Rossimiriam Pereira de Freitas
b,
Laurent Frédéric Gil
a,*aDepartamento de Química, Instituto de Ciências Exatas e Biológicas, Universidade Federal de Ouro Preto, 35400-000 Ouro Preto, Minas Gerais, Brazil bDepartamento de Química, Instituto de Ciências Exatas, Universidade Federal de Minas Gerais, 31270-901 Belo Horizonte, Minas Gerais, Brazil
a r t i c l e
i n f o
Article history:
Received 19 December 2008
Received in revised form 8 February 2009 Accepted 12 February 2009
Available online 21 February 2009
Keywords:
Adsorption Mercerization
Modified sugarcane bagasse
Ethylenediaminetetraacetic dianhydride Heavy metals
a b s t r a c t
This work describes the preparation of new chelating materials derived from cellulose and sugarcane bagasse for adsorption of Cu2+, Cd2+, and Pb2+ions from aqueous solutions. The first part involved the
mercerization treatment of cellulose and sugarcane bagasse with NaOH 5 mol/L. Non- and mercerized cellulose and sugarcane bagasse were then reacted with ethylenediaminetetraacetic dianhydride (EDTAD) in order to prepare different chelating materials. These materials were characterized by mass percent gain, X-ray diffraction, FTIR, and elemental analysis. The second part consisted of evaluating the adsorption capacity of these modified materials for Cu2+, Cd2+, and Pb2+ions from aqueous single
metal solutions, whose concentration was determined by atomic absorption spectroscopy. These materi-als showed maximum adsorption capacities for Cu2+, Cd2+, and Pb2+ions ranging from 38.8 to 92.6 mg/g,
87.7 to 149.0 mg/g, and 192.0 to 333.0 mg/g, respectively. The modified mercerized materials showed lar-ger maximum adsorption capacities than modified non-mercerized materials.
Ó2009 Elsevier Ltd. All rights reserved.
1. Introduction
Water pollution is one of the most serious environmental prob-lems facing modern society (Baird, 1995). Heavy metals constitute a serious environmental problem (Kelter et al., 1997) because these substances are not biodegradable and are highly toxic to living organisms. Toxic metals such as Cu2+, Cd2+, and Pb2+have become
an ecotoxicological hazard of prime interest and increasing signif-icance owing to their tendency to accumulate in the vital organs in humans and animals.
Brazil is the world’s leading producer of sugarcane for both the alcohol and sugar industries. These industries produce a large amount of sugarcane bagasse. According to the last official survey from CONAB, an agency from the Brazilian Ministry of Agriculture, the national production of sugarcane in 2008/2009 was estimated to be about 558 million tons, the largest of all times. On average, 280 kg of sugarcane bagasse containing 50% moisture are produced by ton of sugarcane. In these industries, bagasse is burned to pro-duce energy for sugar mills, but the leftovers are still significant (Gurgel, de Freitas, & Gil, 2008a).
Many efforts are under way to find more efficient uses for renewable agricultural residues, among which sugarcane bagasse stands out (Gupta & Ali, 2000). As a result, there has been increas-ing demand for renewable materials for environmentally friendly applications. This tendency in turn has led to reconsideration of traditional biomaterials, such as natural lignocellulosic fibers, for example, in order to replace synthetic polymers, since in many cases the former perform better.
Since sugarcane bagasse is an important by-product of Brazilian agroindustry, there has been rising interest in the country in find-ing new uses for this material. Accordfind-ing to Caraschi, Campana, and Curvelo (1996), sugarcane bagasse contains about 40–50% of cellulose, 25–30% of polyoses, and 20–25% of lignin. Cellulose con-sists of anhydroglucopyranose units which are joined to form a molecular chain. It can be described as a linear-polymer glucan with a uniform chain structure. The units are bound by b
-(1?4)-glycosidic linkages. The main chain of polyose can consist
of only unit (homopolymer), e.g. xylans, or of two or more units (heteropolymer), e.g. glucomannans. Xylans or glucomannans are linked by b-(1?4)-glycosidic bonds. Lignin is a tridimensional
polymer consisting of three phenylpropanoid units derived from
p-coumaryl, coniferyl, and sinapyl alcohols. These monomeric con-stituents are linked to form a complex structure (Fengel & Wegen-er, 1984). Cellulose and polyoses have primary and secondary
0144-8617/$ - see front matterÓ2009 Elsevier Ltd. All rights reserved. doi:10.1016/j.carbpol.2009.02.016
* Corresponding author. Tel.: +55 31 3559 1717; fax: +55 31 3551 1707.
E-mail address:[email protected](L.F. Gil).
Contents lists available atScienceDirect
Carbohydrate Polymers
hydroxyl groups, and lignin has hydroxyl phenolic groups. There-fore, molecules such as lignin (Xiao, Sun, & Sun, 2001) or cellulose (Navarro, Sumi, Fujii, & Matsumura, 1996) can, through their hydroxylic functions, react chemically and produce new materials with novel properties.
The textile and paper industries, among others, treat their cellu-losic fibers with sodium hydroxide. The tendency of cellulose to form hydrogen bonds is responsible for its characteristic and native crystalline arrangement. Cellulose is known to crystallize in at least four polymorphic forms, commonly known as celluloses I, II, III, and IV (Gurgel et al., 2008b). Treatment of native cellulose or cellulose I with NaOH solution at concentration above 10% im-proves the resistance of the fibers by transforming the crystalline structure of cellulose I into cellulose II, while NaOH solution at con-centration above 17.5% can solubilize a small portion of cellulose calledb- and
c
-cellulose which have lower degree of polymeriza-tion thana
-cellulose. At these concentrations, polyoses are solubi-lized owing to hydrolysis of b-(1?4) linkages and lignin isdegraded by hydrolysis of the ether bonds to form phenolic com-pounds that become soluble (D’Almeida, 1981).
Ethylenediaminetetraacetic acid (EDTA) is a powerful complex-ing agent and is widely available commercially. EDTA has recog-nized efficiency in the complexation of metals, including heavy metals, which can be proved by the high stability constants of the metals complexes (Jeffery, Bassett, Mendham, & Denney, 1989). This occurs because EDTA is a hexadentate ligand that con-tains both carboxylate and amine functions.
In recent decades, many researchers around the world have examined the modification of low-cost materials, and there are many studies in the literature that report versatile chemical trans-formations of cellulose (Gellerested & Gatenholm, 1999; Gurnani, Singh, & Venkataramani, 2003). However, there have been very few works on modification of sugarcane bagasse (Gupta & Ali, 2000, 2004; Gurgel et al., 2008a; Hassan & El-Wakil, 2003; Ibrahim, Hanafiah, & Yahya, 2006; Karnitz et al., 2007; Krishnan & Anirud-han, 2002; Nada & Hassan, 2006). EDTAD, an active agent contain-ing two anhydride groups per molecule, could react with hydroxyl groups of cellulose or lignin molecules in order to introduce chelat-ing groups. The use of EDTA dianhydride (EDTAD) to modify bio-mass has been reported once in the literature (Yu, Tong, Sun, & Li, 2007). However, there is no report of modification of sugarcane bagasse or cellulose with EDTAD.
Due to the harmful effects of water contamination by heavy metals, there is a pressing need to find efficient methods to combat this kind of pollution. In this work we prepared and evaluated new adsorbent materials for Cu2+, Cd2+, and Pb2+ions from aqueous
sin-gle metal solutions. Non- and mercerized cellulose and sugarcane bagasse were modified with EDTAD. This reaction allowed the introduction of carboxylic and amine groups to these materials
viaformation of ester functions. Adsorption studies of Cu2+, Cd2+,
and Pb2+ions from aqueous single metal ion solutions by modified
non- and mercerized cellulose and sugarcane bagasse were devel-oped at different times, pHs, and metal ion concentration. The re-sults were analyzed by Langmuir model (Gurgel et al., 2008a,b; Karnitz et al., 2007).
2. Experimental procedure
2.1. Materials
Grade 3MM Chr cellulose chromatography paper (Cat. No. 3030-861) was purchased from Whatman Company, Maidstone, England. EDTA (disodium salt) and acetic anhydride were pur-chased from Synth (Brazil) and used without purification. Pyridine was refluxed overnight with NaOH and distilled. N,N
-Dimethyl-formamide (DMF) was purchased from Tedia and distilled under reduced pressure before use. CuSO45H2O, Pb(NO3)2, and
CdCl22.5H2O were purchased from Synth (Brazil).
2.2. Sugarcane bagasse preparation
The sugarcane bagasse was dried at 100°C in an oven for
approximately 24 h and then the fiber size was reduced to powder by milling with a tungsten ring. The material was then washed with distilled water under stirring at 65°C for 1 h and dried at
100°C. Finally, it was washed again in a soxhlet system withn
-hexane/ethanol (1:1, v/v) as solvent for 4 h (Gurgel et al., 2008a).
2.3. Synthesis of EDTA dianhydride (EDTAD)
EDTAD was synthesized following the methodology described forCapretta, Maharajh, and Bell (1995). The EDTA (disodium salt) (50.0 g) was solubilized in deionized water (500 mL), and then the concentrated HCl was added drop-by-drop until total precipi-tation of the EDTA (tetra acid). The solid obtained was filtered, washed with ethanol 95%, diethyl ether and then dried in an oven for 2 h at 105°C and left to cool in a desiccator.
EDTA (tetra acid) (18.0 g) was suspended in anhydrous pyridine (31 mL) and then acetic anhydride (24 mL) was added. The mixture was stirred at 65°C for 24 h. Then the EDTAD was obtained as a
so-lid and was filtered, washed with acetic anhydride, diethyl ether, dried under vacuum and stored in a desiccator.
2.4. Cellulose and sugarcane bagasse mercerization
The cellulose (C) (10.0 g) was treated with 270 mL of aqueous NaOH solution (5 mol/L) at 25°C under stirring for 24 h. Then, it
was filtered, washed with distilled water up to pH 7, ethanol and then with acetone. Mercerized cellulose (MC) was dried in an oven at 105°C for 1 h and left to cool in a desiccator.
Sugarcane bagasse (B) (10.0 g) was treated with 500 mL of aqueous NaOH solution (5 mol/L) at 25°C under stirring for 24 h.
Mercerized sugarcane bagasse (MB) was filtered, washed with dis-tilled water up to pH 7, ethanol and then with acetone. Afterwards, it was dried in an oven at 105°C for 1 h and left to cool in a
desic-cator. MB was treated again using the same procedure describe above in order to obtain twice-mercerized sugarcane bagasse (MMB).
2.5. Modification of non- and mercerized cellulose C and MC and sugarcane bagasse B, MB and MMB with EDTAD
The methodology used for the introduction of EDTAD was the same for the materials C, MC, B, MB, and MMB. Each material (5.0 g) was treated with EDTAD (15.0 g) in anhydrous DMF (210 mL) for 20 h at 75°C under constant stirring in order to obtain
EC, EMC, EB, EMB, and EMMB, respectively. After filtration, the materials were washed with DMF, deionized water, saturated so-dium bicarbonate solution, deionized water, ethanol 95%, acetone, and then dried in an oven for 1 h at 80°C and left to cool in a
desiccator.
2.6. Characterization of the new materials obtained
The materials C, MC, EC, EMC, B, MB, MMB, EB, EMB, and EMMB were characterized by mass percent gain (except C and B), FTIR, and elemental analysis.
The samples were previously washed with acetone in a sintered glass funnel and dried at 80°C for 1 h. For FTIR analyses, the
Impact 410 equipment with detector at 4 cm1 resolution from
500 to 4000 cm1. Elemental analyses were accomplished using
Perkin Elmer Series II CHNS/O Model 2400 analyzer. X-ray diffrac-tion analyses were performed at 2°/min from 7 to 50°for C, MC, B,
MB, and MMB, using Mg-filtered Fe K
a
radiation (k= 1.9374 Å)using Shimadzu XRD-6000 diffractometer (Gurgel et al., 2008a).
2.7. Hydrolysis study of ester bond
A study of hydrolysis of ester bond in function of time at pH 1 was performed. Three samples of EMMB (250 mg) were treated with 100.0 mL of aqueous HCl standard solution (0.1 mol/L). The mixtures were shaken for 1, 4, and 24 h. Afterwards, the mixtures were separated by single filtration, washed with deionized water, saturated bicarbonate solution, deionized water, and then ethanol 95%. The materials were dried in an oven at 100°C for 1 h and left
to cool in a desiccator. The hydrolysis of the ester bond was eval-uated by FTIR spectroscopy. In order to quantify the experiments the area of the band at 1743 cm1was calculated for 0, 1, 4, and
24 h of contact with acid solution using software Microcal ORGINTM
8.0.
2.8. Kinetic study of metal ion adsorption for EC, EMC, EB, EMB, and EMMB
Experiments with each material and metal ion were performed to determine the adsorption equilibrium time from 10 to 50 min at 10 min intervals. An amount of 50.0 mg of each material was placed in a 250-mL Erlenmeyer with 50.00 mL of metal ion solution at fixed concentrations (150 mg/L for Cu2+; 200 mg/L for Cd2+, and
200 mg/L for Pb2+) under constant stirring. The experiments were
made at pH 3.0 for all metal ions. The pH values were being mea-sured during the experiments. Variations about 0.1 U of pH were found in relation to values of pH initially adjusted. Then, pH values were corrected by addition of drops of aqueous NaOH and/or HCl solutions (0.01–1.0 mol/L) to the mixtures. At the end of the exper-iments the measured equilibrium pH values were taken into ac-count. After filtration, the metal ion concentration was determined using an atomic absorption spectrophotometer (VAR-IAN SpectrAA 200).
2.9. pH study of metal ion adsorption for EC, EMC, EB, EMB, and EMMB
Experiments with each material and metal ion were performed to determine the effect of pH on metal ion adsorption. An amount of 50.0 mg of each material was placed in a 250-mL Erlenmeyer with 50.00 mL of metal ion solution at fixed concentrations (150 mg/L for Cu2+; 200 mg/L for Cd2+, and 200 mg/L for Pb2+)
un-der constant stirring. The pH values were being measured during the experiments. Variations about 0.1 U of pH were also found in relation to values of pH initially adjusted. Then, pH values were corrected as described earlier. At the end of the experiments the measured equilibrium pH values were also taken into account. The reaction times used were 20 min for all materials. The metal ion concentration was determined after filtration by atomic absorption.
2.10. Adsorption isotherms of EC, EMC, EB, EMB, and EMMB
Experiments were performed for each material and metal ion to determine adsorption isotherms. In each experiment, 50.0 mg of each material was placed in a 250-mL Erlenmeyer with 50.00 mL of metal ion solution at specific concentrations (from 60 to 150 mg/L for Cu2+; 100 to 260 mg/L for Cd2+, and 170 to 350 mg/
L for Pb2+) under stirring during 20 min. Each material was studied
at pH 3.0 and 5.3. The pHs were adjusted by addition of drops of
aqueous NaOH and/or HCl solutions (0.1–1.0 mol/L), and then the erlenmeyers flasks were kept under constant stirring. Some varia-tions about 0.1 U of pH were also found during the experiments. The pH values were also corrected as described earlier. After filtra-tion, the metal ion concentration was also determined by atomic absorption.
3. Results and discussion
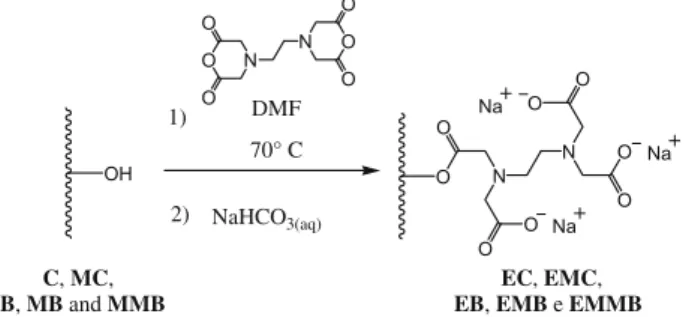
3.1. Synthesis of EC, EMC, EB, EMB, and EMMB
The synthesis route used to prepare EC, EMC, EB, EMB, and EMMB is presented in Fig. 1. The cellulose (C) was treated with an aqueous NaOH solution (5 mol/L) to obtain MC with a mass loss of 2.98%. Sugarcane bagasse (B) was also treated with an aqueous NaOH solution (5 mol/L) to obtain MB with a mass loss of 52.6%. Then, the MB was treated again to obtain MMB with a further mass loss of 14.5% in relation to the MB.
The materials C, MC, B, MB, and MMB were esterified with ED-TAD for the preparation of EC, EMC, EB, EMB, and EMMB, respec-tively. The modified celluloses EC and EMC were obtained with mass percent gains of 22.1% and 22.8%, respectively, while the modified bagasses EB, EMB, and EMMB were obtained with mass percent gains of 50.7%, 36.7%, and 41.2%, respectively.
EDTA is a hexadentate ligand. It has four carboxylate and two amine groups. According toDean (1999), pKavalues for
carboxyl-ate groups are equal to 0.0, 1.5, 2.0, and 2.69, and pKavalues for
amine functions are equal to 6.13 and 10.37. In order to determine the concentration of chelating groups is necessary to ensure that all these groups would be in the protonated form. Considering, therefore EDTA pKavalues, a solution of strong acid of
concentra-tion larger than 1 mol/L would be necessary. EDTA was introduced into non- and mercerized cellulose and sugarcane bagassevia for-mation of an ester bond. Ester groups into modified cellulose ma-trix are more sensible to acidic pH. Besides, steric factors can affect the penetration rate of H+and consequently the rate of hydrolysis
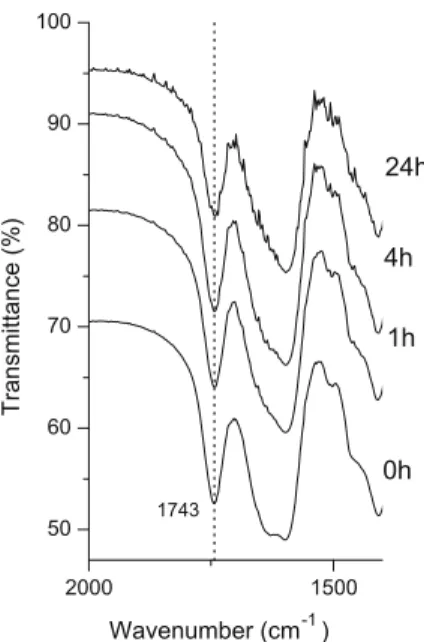
catalyzed by acids. In order to determine the resistance of the ester bonds, a study of hydrolysis of ester bond of EMMB in function of time was carried out in pH 1.
The area of the band at 1743 cm1 (Fig. 2) was calculated to
quantify the hydrolysis of ester bond. For the contact times of 0, 1, 4, and 24 h, the calculated areas were 5680, 4959, 4272, and 2999, respectively. This result indicates that total concentration of chelating functions cannot be determined without hydrolysis of ester groups. Therefore, concentration of chelating functions was not determined.
3.2. Characterization of C, MC, B, MB, and MMB by X-ray diffraction
The treatment of C with NaOH 5 mol/L caused the dissolution of part of the cellulosic chains of lower degree of polymerization and the rearrangement of chain crystal packing from cellulose I into
OH O
N O
O
O O
O DMF
70° C 1)
2) NaHCO3(aq)
O N
N O
O
O O
O O
O Na
Na
Na
C, MC,
B, MB and MMB
EC, EMC,
EB, EMB e EMMB
N
cellulose II. This transformation also caused a change in the crystal-linity degree of the cellulose (Gurgel et al., 2008b; Oh et al., 2005). After the treatment of C with NaOH 5 mol/L a mass loss of 2.98% was observed, probably due to the dissolution ofb- and
c
-cellulose which have lower degree of polymerization thana
-cellulose.The diffraction pattern of C (Figure not shown) showed reflec-tions typically attributed to cellulose I with peaks at 2hof 28.48°,
20.76°, and 18.68°, which are due to the 00 2, 101, and 101
crystal-line planes of cellulose I, respectively. On the other hand, MC (Fig-ure not shown) produced reflections with peaks at 2hof 27.56°,
25.36°, and 15.1°, which are due to the 002, 101, and 101
crystal-line planes of cellulose II.
The crystallinity index (CI) for C and MC was calculated from
X-ray diffraction curves (Figures not shown) according to methodol-ogy proposed by Jayme and Knolle (Krässig, 1993). As discussed earlier, the treatment of cellulose with NaOH changed theCI as
well as the crystal system of the cellulose. The calculatedCIs for
C and MC were 99% and 92%. Therefore, the mercerization treat-ment acted directly on cellulose fibers promoting a decrease of 7% in theCIof MC in relation to C.
The two treatments of B with NaOH 5 mol/L caused the dissolu-tion and consequent removal of part of the lignin and polyoses to-gether with the rearrangement of chain crystal packing from cellulose I into cellulose II. This transformation also caused changes in the crystallinity degree of the materials.
After the first treatment of B with NaOH 5 mol/L a mass loss of 52.6% was observed, probably due to great polyoses and lignin re-moval that constitute 25–35% and 20–25% of the total mass of sug-arcane bagasse, respectively. After the second mercerization treatment a mass loss of 14.5% was observed. As cellulose consti-tutes 40–45% of B and the remaining mass after two treatments was found to be 32.9% of the initial mass it is probable that a small fraction of amorphous cellulose was also hydrolyzed and removed by alkali.
B showed reflections typically attributed to cellulose I (Figure not shown) with peak at 28.26° regarding the 0 02 crystalline
plane, while the curves for MB and MMB (Figure not shown) showed peaks at 27.56° and 25.46° due to the respective 0 02
and 101 crystalline planes of cellulose II.
The crystallinity index (CI) for B, MB, and MMB was calculated
from X-ray diffraction curves (Figures not shown) according to methodology proposed by Jayme and Knolle (Krässig, 1993). The calculated CIs for B, MB, and MMB were 88.6%, 94.9%, and 77.7%,
respectively. Owing to the removal of the great amount of lignin and polyoses, which are amorphous compounds presents in sugar-cane bagasse, by first treatment the crystallinity index increased up to 6.3%, while in the second treatment the absence of great part of lignin and polyoses made possible for the hydroxyl ions directly acted on cellulose fibers promoting hydrolysis of the cellulose chains and consequently an increase of the cellulose amorphous fraction, which decreased CIup to 17.2%.
3.3. Characterization of C, MC, B, MB, and MMB by FTIR
The treatment of C with NaOH 5 mol/L allowed the transforma-tion of cellulose from cellulose I into cellulose II. Owing to this transformation various changes occurred in the minimum trans-mittance peaks and many characteristic bands of the FTIR spectra were shifted (Figure not shown). The bands at 3348, 2901, 1431, 1371, 1282, 1236, 1163, 1032, 983, and 897 cm1were shifted to
3446, 2892, 1421, 1376, 1278, 1227, 1160, 1022, 993 and 894 cm1, respectively (Gurgel et al., 2008b).
Several changes also occurred after the two treatments of B with NaOH 5 mol/L. The minimum transmittance peaks of B at 3411, 1427, 1323, 1163, 1053 and 1037 cm1 were shifted to
3448, 1421, 1315, 1159, 1063 and 1022 cm1, respectively, for
MMB (Figure not shown) (Gurgel et al., 2008a). Besides these changes observed, the treatment of the sugarcane bagasse with NaOH 5 mol/L caused the dissolution of part of the lignin (López et al., 2000) and the polyoses, which justified the observed mass loss. FTIR (Figure not shown) showed the disappearance of the characteristic band of lignin at 1604 cm1, which corresponds to
the aromatic skeletal modes, along with other characteristic bands of lignin and polyoses at 1736, 1514 and 1254 cm1, which
corre-spond to the carbonyl stretching of ketone, skeletal modes and C– O–C stretching, respectively (Bilba & Ouensanga, 1996).
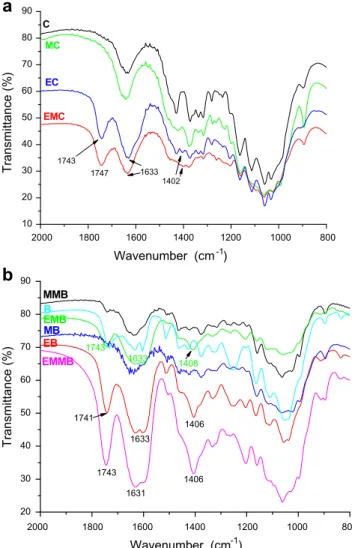
3.4. Characterization of EC, EMC, EB, EMB, and EMMB by FTIR spectroscopy
Characterization of esterified materials was carried out using FTIR spectroscopy. The spectra of the materials before and after modification are shown inFig. 3a and b. The spectra of the modi-fied celluloses EC and EMC, in relation to C and MC, showed the appearance of strong bands at 1743 cm1(EC), 1747 cm1(EMC),
1633 cm1and 1402 cm1(Fig. 3a), while the spectra of EB, EMB,
and EMMB, in relation to B, MB, and MMB, showed the appearance of strong bands at 1743 cm1(EMB and EMMB), 1741 cm1(EB),
1633 cm1(EB and EMB), 1631 cm1(EMMB), 1406 cm1(EB and
EMMB) and 1408 cm1 (EMB) (Fig. 3b). These changes can be
attributed to introduction of two kinds of carbonyl functions, one relative to the ester and other to the carboxylate functions. There-fore, the presence of these functions can evidence the introduction of the EDTA dianhydride into these materials.
3.5. Characterization of C, MC, EC, EMC, B, MB, MMB, EB, EMB, and EMMB by elemental analysis
Characterization of the materials was carried out using elemen-tal analysis. The results are shown inTable 1. The data from the elemental analysis of B and MMB showed that the treatment of B and MB with NaOH 5 mol/L diminished the proportion of carbon and hydrogen. Lignin is a polymer with high content of carbon and hydrogen. Therefore, this result could be explained by the extraction of lignin from the sugarcane bagasse.
The data from the elemental analysis of EC, EMC, EB, EMB, and EMMB showed the appearance of a higher content of nitrogen after the esterification, which could prove the introduction of the EDTA dianhydride. Compared to modified non-mercerized materials,
2000 1500 50
60 70 80 90 100
Transmittance (%)
Wavenumber (cm-1)
0h
1h
4h
24h
1743
modified mercerized materials showed higher nitrogen content. These results can be explained considering that mercerization treatment increases the separation of cellulose chains and specific surface area of the cellulose fiber providing easier access to the hy-droxyl groups of cellulose and reducing its packing efficiency which facilitates the penetration of EDTAD promoting a larger extension of the modification.
Nitrogen content obtained by elemental analysis was used to estimate the quantity of EDTAD that was added to the C, MC, B, MB, and MMB after modification. Thus, it was possible to determi-nate the concentration of EDTA moiety into modified materials (CEDTA(mmol/g)). The results are shown inTable 1. Compared to
EMC, EMMB showed higher concentration of EDTA. This result
can be explained considering the difference of crystallinity index between MC and MMB. MC and MMB showed CIs of 92% and
77.7%, respectively. Materials with lowerCIcan be modified in a
greater extension owing to the easier accessibility of the modifying agent to the hydroxyl groups.
3.6. Adsorption study of metal ions onto EC, EMC, EB, EMB, and EMMB
The studies of the adsorption properties of EC, EMC, EB, EMB, and EMMB were first accomplished for Cu2+ion. The better results
were obtained for EMC and EMMB, modified mercerized cellulose and sugarcane bagasse, respectively. Therefore, these materials were chosen for the adsorption studies of Cd2+and Pb2+ions in
function of contact time, pH, and initial metal ion concentration.
3.6.1. Effect of contact time
The effect of contact time was first evaluated for the removal of Cu2+by EC, EMC, EB, EMB, and EMMB. Adsorption equilibrium time
was attained in 20 min for all materials (Figure not shown). Similar results were obtained for the removal of Cd2+and Pb2+by EC, EMC,
EB, EMB, and EMMB (Figure not shown). Therefore, a contact time of 20 min was chosen for pH and concentration-dependent experiments.
3.6.2. Effect of pH
The removal of metal ions from aqueous solutions by adsorp-tion depends on the soluadsorp-tion’s pH, and how the pH affects both the degree of ionization of the species and the surface characteris-tics of the adsorbent due to its capacity to adsorb protons. There-fore, a study to optimize the pH was performed. The results are presented inFig. 4a and b. The adsorption of Cu2+, Cd2+, and Pb2+
diminished with lower pH for all materials due to the competition for adsorption sites between the metal ions and H+ions, but there
was still a significant adsorption at lower pH values. Thus, in order to evaluate the maximum adsorption capacity of the materials bet-ter, experiments in function of the initial metal ion concentrations were carried out and two adsorption isotherms at two pH values for each metal ion were built.
3.6.3. Adsorption isotherms
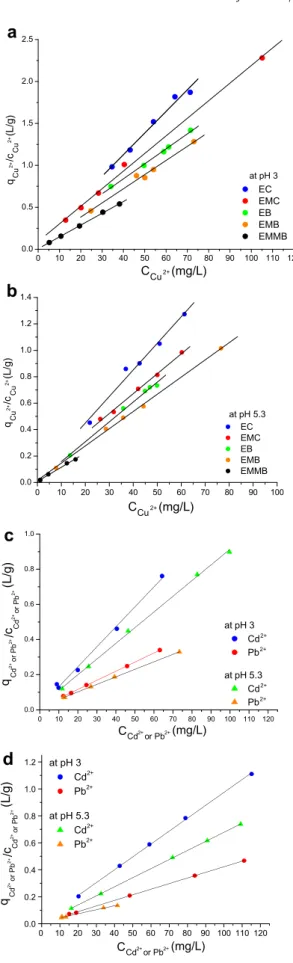
Langmuir isotherms (Ho, Chiu, & Wang, 2005) (Eq.(1)) were used to evaluate the adsorption experiments as a function of the initial metal ion concentrations in aqueous solutions. The contact time used was 20 min. The adsorption studies were conducted at pH 3.0 and 5.3. A linearized form of Langmuir equation is demon-strated by Eq.(1).
c q¼
1
Qmaxbþ
c
Qmax ð
1Þ
where q(mg/g) is the concentration of adsorbed metal ions per gram of adsorbent, c (mg/L) is the concentration of metal ion in aqueous solution at equilibrium, andQmaxandbare the Langmuir
equation parameters (Demirbas et al., 2005).
The high correlation coefficients of the linearized Langmuir equation indicate that this model can explain well metal ion adsorption by the modified materials (Sodré, Lenzi, & da Costa, 2001). The results for Cu2+adsorption by EC, EMC, EB, EMB, and
EMMB are presented inTable 2and for Cd2+and Pb2+adsorption
by EMC and EMMB are presented inTable 3. Langmuir isotherms for Cu2+adsorption by EC, EMC, EB, EMB, and EMMB are shown
inFig. 5a and b, while for Cd2+and Pb2+adsorption by EMC and
EMMB are shown inFig. 5c and d.
The Qmax parameter of the Langmuir isotherm indicates the
maximum adsorption capacity of the material, i.e., the adsorption at high concentrations of metallic cations. As can be seen from Ta-ble 2, the mercerized materials showed higher capacities to adsorb 2000 1800 1600 1400 1200 1000 800
2000 1800 1600 1400 1200 1000 800 10
20 30 40 50 60 70 80 90
1747 EMC
EC C
1402 1633 1743
Transmittance (%)
Wavenumber (cm-1) MC
20 30 40 50 60 70 80 90
1633 1408 B
MMB
EMB MB EB
EMMB
Transmittance (%)
Wavenumber (cm-1) 1743
1631
1406 1741
1633
1406 1743
a
b
Fig. 3.FTIR spectra of C, MC, EC, and EMC (a) and B, MB, MMB, EB, EMB, and EMMB (b).
Table 1
Type of material, elemental analysis, and concentrations of EDTA introduced.
Material C (%) H (%) N (%) CEDTAintroduced (mmol/g)
B 43.98 6.02 0.13
EB 39.93 4.55 2.32 0.786
MB 41.12 5.79 0.20
EMB 36.18 5.12 2.62 0.861
MMB 38.49 5.80 0.21
EMMB 38.95 5.95 3.09 1.040
C 44.44 6.17 0.00
EC 37.66 5.56 0.88 0.314
MC 44.44 6.17 0.00
Cu2+ both at pH 3.0 and 5.3 than non-mercerized materials.
According toAss, Belgacem, and Frollini (2006), the transformation of cellulose I into cellulose II causes an increase in the material’s surface area and also makes the cellulose’s hydroxyl groups more accessible. In this way, the mercerization treatment made these hydroxyl groups more susceptible to esterification with the ED-TAD. This explains the increased in the maximum adsorption capacity observed of EMC in relation to EC, EMB to EB, and EMMB
to EMB at both pH levels. Similar results have also been reported by our research group for succinylated non- and mercerized cellu-lose (Gurgel et al., 2008b) and sugarcane bagasse (Gurgel et al., 2008a).
Table 4 shows a relationship between maximum adsorption capacities of EC, EMC, EB, EMB, and EMMB for adsorbed metal ions at pH 5.3 and amount of EDTA added in each material. Analyzing the amount of metal ions adsorbed per amount of EDTA introduced in each material it is possible to conclude that approximately 3 me-tal ions are adsorbed by 2 EDTA incorporated, except for EC that exhibited the smallest modification extension of all materials and adsorbed approximately 5 metal ions for each 2 EDTA. These re-sults may be explained considering that a smaller modification extension allows that EDTA added are more distant from each other which makes possible to adsorb a larger amount of metal ions per EDTA introduced due to absence of steric hindrance.
The adsorption results of EC and EMC were compared with those that have been reported byGurgel et al. (2008b)for succ-inylated non- and mercerized cellulose (cell 5 and 6, respec-tively). The Qmax of cell 5 and 6 for Cu2+, Cd2+, and Pb2+ were
found to be 123.5 and 153.9 mg/g, 164.0 and 250.0 mg/g, 294.1 and 500.0 mg/g, respectively, at pH 5.0, 8.0, and 5.0 for cell 5 and 5.6, 6.0, and 5.4 for cell 6. Comparing the mercerized materi-als, cell 6 and EMC, cell 6 exhibited largerQmaxfor all metals than
EMC. In contrast, EMC showed a much better maximum adsorp-tion capacity in more acidic condiadsorp-tion (pH 3 or lower) than cell 6. The same conclusions can be done comparing EMMB with succinylated twice-mercerized sugarcane bagasse (MMSCB 2) re-ported byGurgel et al. (2008a).
We compared the Cu2+adsorption results to those obtained by
Vaughan, Seo, and Marshall (2001)for the commercial resin Duo-lite GT-73 and those obtained byDemirbas et al. (2005)for the commercial resin Amberlite IR-120. TheQmaxfor Duolite GT-73
and for Amberlite IR-120 for Cu2+ ions at pH 5.5 were 62 mg/g
and 22 mg/g, respectively. Duolite GT-73 has aQmaxfor Cu2+
great-er than EC, and near that of EMC and EB, and lowgreat-er than EMB and EMMB, while Amberlite IR-120 has a lowerQmaxfor Cu2+than all
the modified materials tested here (Table 2).
4. Conclusions
Through a quick, efficient and inexpensive methodology, we managed to carry out the mercerization of cellulose and sugarcane bagasse with a solution of NaOH 5 mol/L and the incorporation of the EDTAD into the non- and mercerized materials. Mercerization resulted in a material with better properties, after the introduction of the EDTAD, for absorption of Cu2+ in aqueous solutions. The
modified material EMMB presented the highest adsorption capac-ity for all metal ions, 92.6 mg/g, 149 mg/g and 333 mg/g for Cu2+,
Cd2+, and Pb2+, respectively. All the materials showed good
adsorp-0 1 2 3 4 5 6
0 10 20 30 40 50 60 70 80
Qmax
(mg/g) for Cu
2+
pH
EC EMC EB EMB EMMB
0 1 2 3 4 5 6 7
0 20 40 60 80 100 120 140 160 180 200 220
Qmax
(mg/g)
pH
EMC (Cd2+) EMC (Pb2+) EMMB (Cd2+) EMMB (Pb2+)
a
b
Fig. 4.Adsorption of Cu2+by EC, EMC, EB, EMB, and EMMB (a) and of Cd2+and Pb2+ by EMC and EMMB (b) as a function of pH.
Table 2
Langmuir parameters for adsorption of Cu2+by the modified materials EC, EMC, EB, EMB and EMMB at pH of 3.0 and 5.3.
Material pH Langmuir
Qmax(mg/g) b(L/mg) R2
EC 3.0 38.8 0.266 0.9832
5.3 49.8 0.416 0.9818
EMC 3.0 47.6 0.226 0.9975
5.3 66.7 0.211 0.9962
EB 3.0 56.2 0.141 0.9964
5.3 66.7 1.950 0.9952
EMB 3.0 59.2 0.367 0.9876
5.3 76.9 0.807 0.9984
EMMB 3.0 70.9 2.140 0.9993
5.3 92.6 1.370 0.9964
Table 3
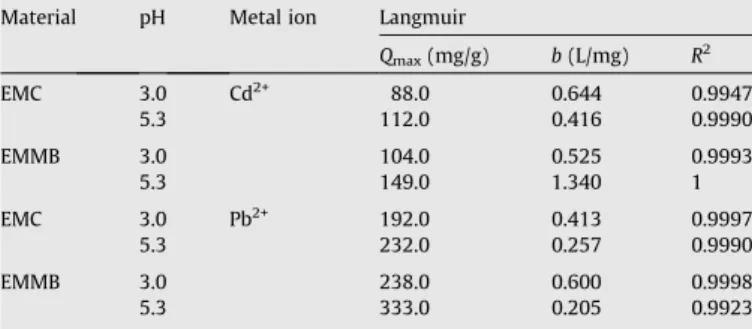
Langmuir parameters for adsorption of Cd2+and Pb2+by the modified materials EMC and EMMB at different pH values.
Material pH Metal ion Langmuir
Qmax(mg/g) b(L/mg) R2
EMC 3.0 Cd2+ 88.0 0.644 0.9947
5.3 112.0 0.416 0.9990
EMMB 3.0 104.0 0.525 0.9993
5.3 149.0 1.340 1
EMC 3.0 Pb2+ 192.0 0.413 0.9997
5.3 232.0 0.257 0.9990
EMMB 3.0 238.0 0.600 0.9998
tion efficiency, even at more acid pH levels. This is a relevant result in relation to the majority of the materials tested in the literature.
As an extension of our research here, we suggest testing the adsorption capacity of these materials for other heavy metals.
Acknowledgments
The authors thank the financial support from the following Bra-zilian Government Agencies: Fundação de Amparo à Pesquisa do Estado de Minas Gerais – FAPEMIG, Coordenação de Aperfeiçoa-mento de Pessoal de Nível Superior – CAPES. The authors are also grateful at Universidade Federal de Ouro Preto – UFOP.
References
Ass, B. A. P., Belgacem, M. N., & Frollini, E. (2006). Mercerized linters cellulose: Characterization and acetylation inN,N-dimethylacetamide/lithium chloride.
Carbohydrate Polymers, 63(1), 19–29.
Baird, C. (1995).Environmental chemistry. New York: W.H. Freeman and Company. Bilba, K., & Ouensanga, A. (1996). Fourier transform infrared spectroscopic study of thermal degradation of sugar cane bagasse.Journal of Analytical and Applied Pyrolysis, 38(1–2), 61–73.
Capretta, A., Maharajh, R. B., & Bell, R. A. (1995). Synthesis and characterization of cyclomaltoheptaose-based metal chelants as probes for intestinal permeability.
Carbohydrate Research, 267, 49–63.
Caraschi, J. C., Campana, S. P., & Curvelo, A. A. S. (1996). Preparação e Caracterização de Polpas Obtidas a Partir de Bagaço de Cana de Açúcar.Polímeros: Ciência e Tecnologia, 3, 24–29.
D’Almeida, M. L. O. (1981).Celulose e Papel: Tecnologia de fabricação de pastas celulósicas(Vol. 1). São Paulo: SENAI – IPT.
Dean, J. (1999).Lange’s handbook of chemistry(15th ed.). McGraw-Hill.
Demirbas, A., Pehlivan, E., Gode, F., Altun, T., & Arslan, G. (2005). Adsorption of Cu(II), Zn(II), Ni(II), Pb(II) and Cd(II) form aqueous solution on Amberlite IR-200 synthetic resin.Journal of Colloid and Interface Science, 282(1), 20–25. Fengel, D., & Wegener, G. (1984).Wood: Chemistry, ultrastructure, reactions. Berlin
and New York: Walter de Gruyter. 613 p.
Gellerested, F., & Gatenholm, P. (1999). Surface properties of lignocellulosic fibers bearing carboxylic groups.Cellulose, 6, 103–121.
Gupta, V. K., & Ali, I. (2000). Utilisation of bagasse fly ash (a sugar industry waste) for the removal of copper and zinc from wastewater.Separation and Purification Technology, 18(2), 131–140.
Gupta, V. K., & Ali, I. (2004). Removal of lead and chromium from wastewater using bagasse fly ash – a sugar industry waste.Journal of Colloid and Interface Science, 271, 321–328.
Gurgel, L. V. A., de Freitas, R. P., & Gil, L. F. (2008a). Adsorption of Cu(II), Cd(II), and Pb(II) from aqueous single metal solutions by sugarcane bagasse and mercerized sugarcane bagasse chemically modified with succinic anhydride.
Carbohydrate Polymers, 74, 922–929.
Gurgel, L. V. A., Karnitz Júnior, O., Gil, R. P. F., & Gil, L. F. (2008b). Adsorption of Cu(II), Cd(II), and Pb(II) from aqueous single metal solutions by cellulose and mercerized cellulose chemically modified with succinic anhydride.Bioresource Technology, 99(8), 3077–3083.
Gurnani, V., Singh, A. K., & Venkataramani, B. (2003). 2,3-Dihydroxypyridine-loaded cellulose: A new macromolecular chelator for metal enrichment prior to their determination by atomic absorption spectrometry.Analytical and Bioanalytical Chemistry, 377, 1079–1086.
Hassan, M. L., & El-Wakil, N. A. (2003). Heavy metal ion removal by amidoximated bagasse.Journal of Applied Polymer Science, 87(4), 666–670.
Ho, Y. S., Chiu, W. T., & Wang, C. C. (2005). Regression analysis for the sorption isotherms of basic dyes on sugarcane dust. Bioresource Technology, 96, 1285–1291.
Ibrahim, S. C., Hanafiah, M. A. K. M., & Yahya, M. Z. A. (2006). Removal of cadmium from aqueous solution by adsorption on sugarcane bagasse.American–Eurasian Journal of Agricultural and Environmental Science, 1, 179–184.
0 10 20 30 40 50 60 70 80 90 100 110 120 0.0 0.5 1.0 1.5 2.0 2.5 qCu 2+/c Cu
2+ (L/g)
qCu
2+
/cCu 2+ (L/g)
EC EMC EB EMB EMMB
at pH 3
0 10 20 30 40 50 60 70 80 90 100 0.0 0.2 0.4 0.6 0.8 1.0 1.2 1.4
CCu2+ (mg/L) CCu2+ (mg/L)
EC EMC EB EMB EMMB at pH 5.3
a
b
0 10 20 30 40 50 60 70 80 90 100 110 120 0.0 0.2 0.4 0.6 0.8 1.0
at pH 3 Cd Pb
at pH 5.3 Cd Pb q C d or Pb /c C d o r Pb (L /g ) q C d or Pb /cC d o r Pb (L /g )
0 10 20 30 40 50 60 70 80 90 100 110 120 0.0 0.2 0.4 0.6 0.8 1.0 1.2 at pH 3
Cd Pb
at pH 5.3 Cd Pb
CCd or Pb (mg/L) CCd or Pb (mg/L)
c
d
Fig. 5.Langmuir isotherm for Cu2+adsorption by EC, EMC, EB, EMB, and EMMB at pH 3 (a), and at pH 5.3 (b), Cd2+and Pb2+by EMC at pH 3 and 5.3 (c), and EMMB at pH 3 and 5.3 (d).
Table 4
Maximum adsorption capacities for EC, EMC, EB, EMB, and EMMB at pH 5.3, concentration of EDTA and amount of metal ion adsorbed per EDTA added. Material Metal ion pH Qmax
(mg/g) Qmax (mmol/g) CEDTA introduced (mmol/g)
Amount of M2+ per EDTA added
EC Cu2+ 5.3 49.8 0.784 0.314 2.50
EMC 66.7 1.050 0.636 1.65
EB 66.7 1.050 0.786 1.34
EMB 76.9 1.210 0.861 1.41
EMMB 92.6 1.457 1.040 1.40
EMC Cd2+ 5.3 112.0 0.996 0.636 1.57
EMMB 149.0 1.326 1.040 1.28
EMC Pb2+ 232.0 1.120 0.636 1.76
Jeffery, G. H., Bassett, J., Mendham, J., & Denney, R. C. (1989). Vogel’s textbook of quantitative chemical analysis. In Longman Scientific and Technical
(pp. 309–322). New York: Co-published with John Wiley and Sons Inc. Karnitz, O., Jr., Gurgel, L. V. A., Perin de Melo, J. C., Botaro, V. R., Melo, T. M. S., Gil, R.
P. F., & Gil, L. F. (2007). Adsorption of heavy metal ion from aqueous solution single metal solution by chemically modified sugarcane bagasse.Bioresource Technology, 98(6), 1291–1297.
Kelter, P. B., Grundman, J., Hage, D. S., Carr, J. D., & Castro-Acuña, C. M. (1997). A discussion of water pollution in the United States and Mexico; with high school laboratory activities for the analysis of lead, atrazine, and nitrate.Journal of Chemical Education, 74, 1413–1421.
Krässig, H.A. (1993). Cellulose: Structure, accessibility and reactivity. Polymer monographs (Vol. 11, pp. 88–90, 100–107, 123–125). Yverdon, Switzerland: Gordon and Breach Science Publishers.
Krishnan, K. A., & Anirudhan, T. S. (2002). Removal of mercury(II) from aqueous solutions and chlor-alkali industry effluent by steam activated and sulphurised activated carbons prepared from bagasse pith: Kinetics and equilibrium studies.
Journal of Hazardous Materials, 92, 161–183.
López, R., Poblano, V. M., Licea-Claveríe, A., Avalos, M., Alvarez-Castillo, A., & Castaño, V. M. (2000). Alkaline surface modification of sugar cane bagasse.
Advanced Composite Materials, 9(2), 99–108.
Nada, A. M. A., & Hassan, M. L. (2006). Ion exchange properties of carbohydrate bagasse.Journal of Applied Polymer Science, 102(2), 1399–1404.
Navarro, R. R., Sumi, K., Fujii, N., & Matsumura, M. (1996). Mercury removal from wastewater using porous cellulose carrier modified with polyethyleneimine.
Water Research, 30, 2488–2494.
Oh, S. Y., Yoo, D. I., Shin, Y., Kim, H. C., Kim, H. Y., Chung, Y. S., Park, W. H., & Youk, J. H. (2005). Crystalline structure analysis of cellulose treated with sodium hydroxide and carbon dioxide by means of X-ray diffraction and FTIR spectroscopy.Carbohydrate Research, 340(15), 2376–2391.
Sodré, F. F., Lenzi, E., & da Costa, A. C. S. (2001). Utilização de modelos físico-químicos de adsorção no estudo do comportamento do cobre em solos argiloso.
Química Nova, 24(3), 324–330.
Vaughan, T., Seo, C. W., & Marshall, W. E. (2001). Removal of selected metal ions from aqueous solution using modified corncobs.Bioresource Technology, 78, 133–139.
Xiao, B., Sun, X. F., & Sun, R. (2001). The chemical modification of lignins with succinic anhydride in aqueous systems.Polymer Degradation and Stability, 71, 223–231.