Adsorption of Cu(II), Cd(II), and Pb(II) from aqueous single metal solutions by
sugarcane bagasse and mercerized sugarcane bagasse chemically modified with
succinic anhydride
Leandro Vinícius Alves Gurgel
a, Rossimiriam Pereira de Freitas
b, Laurent Frédéric Gil
a,* aDepartamento de Química, Instituto de Ciências Exatas e Biológicas, Universidade Federal de Ouro Preto, 35400-000, Ouro Preto, Minas Gerais, Brazil bDepartamento de Química, Instituto de Ciências Exatas, Universidade Federal de Minas Gerais, 31270-901, Belo Horizonte, Minas Gerais, Brazila r t i c l e
i n f o
Article history:
Received 26 February 2008
Received in revised form 10 May 2008 Accepted 20 May 2008
Available online 8 June 2008
Keywords:
Mercerization
Modified sugarcane bagasse Succinylation
Adsorption Heavy metals
a b s t r a c t
This work describes the preparation of new chelating material from mercerized sugarcane bagasse. The first part treats the chemical modification of non-mercerized sugarcane bagasse (SCB) and twice-mercer-ized sugarcane bagasse (MMSCB) with succinic anhydride. Mass percent gains (mpg) and degrees of succ-inylation (DS) of succinylated non- and twice-mercerized sugarcane bagasse 1 (SCB 1 and MMSCB 1) were calculated. MMSCB 1 exhibited an increase in mpg and DS of 49.2% and 0.9 mmol/g in relation to SCB 1. SCB 2 and MMSCB 2 were obtained by treatment of MMSCB 1 and SCB 1 with bicarbonate solution to release the carboxylate functions and characterized by FTIR. The second part evaluates and compares the adsorption capacity of SCB 2 and MMSCB 2 for Cu2+, Cd2+and Pb2+ions in an aqueous single metal solution. Adsorption isotherms were developed using Langmuir model. MMSCB 2 exhibited an increase inQmaxfor Cd2+(43.6 mg/g) and Pb2+(83.3 mg/g) in relation to SCB 2.
Ó2008 Elsevier Ltd. All rights reserved.
1. Introduction
Heavy metal ions are known to be toxic and carcinogenic to
liv-ing organisms (Clement, Eiceman, & Koester, 1995; MacCarthy,
Klusman, Cowling, & Rice, 1995). Their presence in the aquatic environment has been of great concern because of their toxicity and non biodegradable nature. Some metal ions are cumulative poisons, capable of being assimilated and stored in the tissues of
organisms, causing noticeable adverse physiological effects (Gupta
& Ali, 2000).
The removal of toxic metal ions from water is a very difficult
task due to the high cost of treatment methods (Weng & Huang,
1994). There are various methods for the removal of toxic metal
ions from aqueous solutions: reverse osmosis, ion exchange, pre-cipitation, electrodialysis, adsorption, etc. Among these methods, adsorption is by far the most versatile and widely used for the
re-moval of different pollutants (Gupta & Ali, 2004).
Brazil is the world leading producer of sugarcane for both the alcohol and the sugar industries. These industries produce a large amount of sugarcane bagasse. According to the last official survey from CONAB, an agency from the Brazilian Ministry of Agriculture, the national production of sugarcane in 2007/2008 was 527 million
tons, the largest of all times. On average, 280 kg of sugarcane ba-gasse containing 50% moisture are produced by ton of sugarcane. In those industries, bagasse is burned in order to produce energy
for sugar mills, but the leftovers are still significant (Karnitz Júnior
et al., 2007). The remaining bagasse still continues to be a menace to the environment and a suitable utilization of this residue is an
important target to be pursued (Sun, Sun, Zhao, & Sun, 2004).
Sug-arcane bagasse is constituted mainly of cellulose (40–50%),
polyos-es (25–30%), and lignin (20–25%) (Caraschi, Campana, & Curvelo,
1996).
Hassan and El-Wakil (2003)have reported the use of amidoxi-mated bagasse (Am-B) for adsorption of some heavy metal ions such as Cu(II), Hg(II), Ni(II), Cr(III), and Pb(II) from aqueous solu-tions. Adsorption studies were performed at different pHs, contact times, metal ion concentration, and temperatures. The maximum
milligrams of metal ions adsorbedpergram of AM-B were 672,
156, 137, and 47 for Hg2+, Cr3+, Cu2+, and Ni2+, respectively.
Nada and Hassan (2006)have recently reported the chemical modification of bagasse fibers with the aim to prepare lignocellu-losic materials for removal of heavy metal ions from wastewater. Different reactions were used to modify bagasse fibers and to pro-duce the following materials: oxy-bagasse, succinylated bagasse, and carboxymethylated bagasse. Adsorption studies were per-formed to evaluate the ability of these cation exchangers to remove heavy metal ions. The maximum milligrams of metal ions adsorbed
0144-8617/$ - see front matterÓ2008 Elsevier Ltd. All rights reserved. doi:10.1016/j.carbpol.2008.05.023
* Corresponding author. Tel.: +55 31 3559 1717; fax: +55 31 3551 1707.
E-mail address:[email protected](L.F. Gil).
Contents lists available atScienceDirect
Carbohydrate Polymers
pergram of oxy-bagasse, succinylated bagasse, and carboxymethy-lated bagasse were 233, 88, 394, and 200; 170, 113, 321, and 88;
392, 460, 504, and 465, for Cu2+, Ni2+, Cr3+, and Fe3+, respectively.
Karnitz Júnior et al. (2007)have recently reported the use of sugarcane bagasse modified with succinic anhydride (MSB 2) for removal of Cu(II), Cd(II) and Pb(II) from aqueous solutions. The authors have reported that the hydroxyl and phenolic groups in sugarcane bagasse could be easily converted to carboxylic groups by using succinic anhydride. Adsorption studies to determine the
maximum adsorption capacity (Qmax) of MSB 2 towards each heavy
metal were developed. The results were analyzed by Langmuir and Freundlich models. MSB 2 exhibited a maximum adsorption
capac-ity of 114 mg/g for Cu2+, 196 mg/g for Cd2+and 189 mg/g for Pb2+
according to Langmuir model.
Gurgel, Karnitz Júnior, Gil, and Gil (2008)reported the use of modified non- and mercerized cellulose with succinic anhydride for removal of Cu(II), Cd(II) and Pb(II) from aqueous solutions. The authors reported the effect of mercerization in the increase of the fibers specific surface area and in their reactivity. The mer-cerization makes the hydroxyl groups of the cellulose macromole-cules more accessible and decreases the cellulose crystallinity index by 7%. Modified mercerized cellulose exhibited an increase in the mass percent gain and in the concentration of carboxylic functions in relation to modified non-mercerized cellulose by 68% and 2.8 mmol/g, respectively. Adsorption studies to determine
the maximum adsorption capacity (Qmax) of modified celluloses for
metals ions were developed. The results were analyzed by Lang-muir model. Modified mercerized cellulose exhibited an increase
in the adsorption maximum capacity of 30.4 mg/g for Cu2+,
86.0 mg/g for Cd2+and 205.9 mg/g for Pb2+in relation to modified
non-mercerized cellulose.
This work describes the preparation and evaluation of two mate-rials from sugarcane bagasse to adsorb heavy metal ions in aqueous solutions. The first material was prepared by modification of sugar-cane bagasse with succinic anhydride (SCB) and the second was prepared by mercerization of sugarcane bagasse with an aqueous NaOH solution (20 wt%) followed by reaction with succinic
anhy-dride (MMSCB). The adsorption studies of Cu2+, Cd2+and Pb2+from
aqueous single metal ion solutions by SCB and MMSCB were devel-oped at different times, pHs, and metal ion concentration.
2. Experimental procedure
2.1. Materials
Sugarcane bagasse, a waste material of sugar-alcohol industry, was collected from an alcohol factory at Ouro Preto, Brazil. Succinic Anhydride and Pyridine were purchased from VETEC (Brazil).
Cu-SO45H2O, Pb(NO3)2, CdCl22.5H2O were purchased from SYNTH
(Brazil). Pyridine was refluxed with NaOH overnight and distilled.
2.2. Sugarcane bagasse preparation
Integral sugarcane bagasse was first dried under sunlight. The fibers were manually broken into small pieces and subsequently
dried at 90°C in an oven for 24 h. Sugarcane bagasse was
pow-dered by a mill with tungsten rings. The powder was sieved in a 6-sieve system (10, 30, 45, 60, 100 and 200 mesh). The fraction of 200 mesh was chosen for the accomplishment of the experi-ments. This fraction was treated with distilled water under
con-stant stirring at 60–70°C for 1 h to eliminate residual sugars and
separated by single filtration. Afterwards, it was washed with EtOH
95% and dried at 90°C in an oven. Finally, it was washed again in a
soxhlet apparatus with hexane-ethanol (1:1, v/v) for 24 h to elim-inate extractives. During this process small fractions of lignin
ex-tracted during pulverization are also solubilized. Then, it was
dried at 90°C in an oven and stored in desiccator.
2.3. Sugarcane bagasse mercerization
Sugarcane bagasse (SCB) (7.5 g) was treated with 350 mL of
aqueous NaOH solution (20 wt%) at 25°C for 16 h under constant
stirring in order to obtain mercerized sugarcane bagasse (MSCB). MSCB was treated again using the same procedure described above in order to obtain twice-mercerized sugarcane bagasse (MMSCB). In the end of each treatment, the alkali was separated of bagasse by filtration in sintered filter, washed with distilled water up to pH 7 and acetone. The mercerized products (MSCB and MMSCB)
were then dried at 90°C in an oven for 1 h and stored in desiccator.
The mass percent loss (mpl) was calculated at the end of each treatment.
2.4. Synthesis of SCB 1 and MMSCB 1
Sugarcane bagasse (SCB) (5 g) was reacted with succinic anhy-dride (15 g) under pyridine reflux (50 mL) for 24 h in order to ob-tain modified sugarcane bagasse 1 (SCB 1). The twice-mercerized sugarcane bagasse (MMSCB) (5 g) was reacted with succinic anhy-dride (25 g) under pyridine reflux (150 mL) for 4 h in order to ob-tain modified twice-mercerized sugarcane bagasse 1 (MMSCB 1). The modified materials (SCB 1 and MMSCB 1) were separated by filtration in sintered filter, washed in sequence with: solution of acetic acid in methylene chloride (1 mol/L), ethanol 95%, distilled water, chloridric acid solution (0.01 mol/L), distilled water and
fi-nally with acetone. After drying at 80°C in an oven for 1 h and in
a desiccator overnight the mass percent gains (mpg) and degrees of succinylation were calculated.
2.5. Synthesis of SCB 2 and MMSCB 2
SCB 2 and MMSCB 2 were obtained by treatment of SCB 1 and MMSCB 1 with saturated sodium bicarbonate solution in a 250 mL Erlenmeyer for 30 min under constant stirring. Soon afterwards, the materials were separated by filtration in sintered filter and washed with distilled water and acetone. Finally SCB 2
and MMSCB 2 were dried in an oven at 80°C and stored in a
desiccator.
2.6. Materials characterization
2.6.1. Determination of Crystallinity Index (CI)
The crystalline structures of SCB, MSCB and MMSCB were ana-lyzed by wide-angle ray diffraction in a Shimadzu XRP-6000 X-ray diffractometer. The samples were prepared by powdering, laid
on an aluminium sample holder (35553 mm) and analyzed
under plateau conditions. Mg-filtered Fe K
a
radiation(k= 1.9374 Å) generated at a voltage of 40 kV and current of
30 mA was utilized, with a scan speed of 2°/min from 7°to 40°.
The crystalline allomorphs of materials were determined by the resolution of wide-angle X-ray diffraction curves. The
determina-tion of CI was taken from the method of Jayme and Knolle (Krässig,
1993). Amorphous halos were drawn by MicrocalTMORIGINTM
pro-gram for the determination ofhamandhcr. CI was calculated by Eq.
(1)
CI¼1ham
hcr ¼1
ham
ðhtothamÞ ð1Þ
where hcr(crystalline height) is the crystalline scatter of the 002
reflection at 2h of 28.4°for cellulose I or 101 reflection at 2h of
25.0°for cellulose II andham(amorphous height) is the amorphous
reflection at 2h of 22.7° for cellulose I or 20.2° for cellulose II,
respectively (Krässig, 1993).
2.6.2. FTIR analyses
The samples were prepared mixing 1 mg of material with 100 mg of spectroscopy grade KBr. The FTIR spectra were recorded
using Nicolet Impact 410 equipment with detector at 4 cm1
reso-lution from 500 to 4000 cm1and 32 scans per sample.
2.7. Characterization of SCB 1 and MMSCB 1
2.7.1. Mass percent loss (mpl)
The mass percent loss (mpl) after each treatment of sugarcane bagasse (SCB) with NaOH 20 wt% was calculated according to Eq.
(2)
mplð%Þ ¼ ðmimf
mi Þ 100 ð2Þ
wheremiis the mass of sugarcane bagasse before andmfis the mass
of the sugarcane after treatment.
2.7.2. Mass percent gain (mpg)
The mass percent gain (mpg) was calculated according to Eq.(3)
mpgð%Þ ¼ ðmmodmunmod
munmod Þ 100 ð3Þ
where mmodis the mass of modified bagasse and munmodis the mass
of unmodified bagasse.
2.7.3. Degree of succinylation (DS)
The degree of succinylation of SCB 1 and MMSCB 1 was deter-mined by measuring the quantity of introduced acid functions.
The concentration of carboxylic functions per gram of material
was determined by retro-titration. For this, amounts of 0.1000 g of SCB 1 and MMSCB 1 were treated with 100.0 mL of an aqueous NaOH solution (0.01 mmol/L) in a 250-mL Erlenmeyer for 1 h un-der constant stirring. Soon thereafter, the materials were separated by single filtration and three aliquots (25.0 mL) of each obtained solution were titrated with an aqueous HCl solution (0.01 mmol/ L) (Gurgel et al., 2008; Karnitz Júnior et al., 2007). The
concentra-tion of carboxylic funcconcentra-tions was calculated using Eq.(4).
CCOOH¼ ðCNaOHVNaOHÞ ðm 4CHClVHClÞ mat
ð4Þ
whereCNaOHis the concentration of NaOH solution (mmol/L),CHClis
the concentration of HCl solution (mmol/L),VNaOHis the volume of
NaOH solution (L),VHClis the volume of HCl spent in the titration of
excessive non-reacted base (L) andmmatis the material mass (g).
2.8. Kinetic study of metal ion adsorption for SCB 2 and MMSCB 2
Experiments with each material and metal ion were performed to determine the adsorption equilibrium time. The interval times used were 10–40 min. An amount of 100 mg for SCB 2 and MMSCB 2 were placed in a 250 mL Erlenmeyer with 100.0 mL of metal ion
solution at fixed concentrations (200 mg/L and 250 mg/L for Cu2+;
520 mg/L and 370 mg/L for Cd2+; 500 mg/L and 590 mg/L for Pb2+
for SCB 2 and MMSCB 2, respectively) under constant stirring.
The experiments were done at pHs 5.4 for Cu2+, 7.0 for Cd2+, and
6.0 for Pb2+, optimal values to obtain the best adsorption.
Signifi-cant pH variations were noticed during each experiment, but pH values were kept constant by adding up an aqueous NaOH solution (0.01–0.1 mol/L) to the metal solutions with each material.
After single filtration, the concentration of Cu2+ions was
deter-mined by direct titration with EDTA (2 mmol/L) at pH 10 using Murexide as indicator.
In the case of Pb2+and Cd2+ions, the concentration was
deter-mined by retro-titration. In this procedure, an excess of EDTA solu-tion of known concentrasolu-tion (3 mmol/L) is added up to an aliquot
containing Pb2+and Cd2+ions to be analyzed. These ions are
com-plexed by EDTA and consequently they do not precipitate with the
addition of a buffer (NH3/NH4+) of pH equal to 10. In this pH the
EDTA excess can be determined by titration with an aqueous
Mg2+solution (2.5 mmol/L) using Erichrome Black T as an indicator
(Jeffery, Bassett, Mendham, & Denney, 1989). Then, the
concentra-tion of Pb2+and Cd2+ions can be obtained through a simple
calcu-lation according to Eq.(5)
CM2þ¼
ðCEDTAVEDTAÞ ðCMg2þVMg2þÞ VM2þ
" #
MMmetal ð5Þ
whereCM2+is the metal ion concentration (mg/L),CEDTAandVEDTA
are the concentration (mmol/L) and the volume (mL) of EDTA,
CMg2+ and VMg2+ are the concentration (mmol/L) and the volume
(mL) of Mg2+solution,V
M2+is the volume of the aliquot (mL)
ana-lyzed and MMmetalis the molar mass of Lead or Cadmium (mg/
mmol).
2.9. pH study of metal ion adsorption for SCB 2 and MMSCB 2
Experiments with each material and metal ion were performed to determine the effect of pH on metal ion adsorption. An amount of 100 mg for SCB 2 and MMSCB 2 was placed in a 250-mL Erlen-meyer with 100.0 mL of metal ion solution at fixed concentrations
(200 and 250 mg/L for Cu2+; 520 and 370 mg/L for Cd2+; 490 and
570 mg/L for Pb2+for SCB 2 and MMSCB 2, respectively) under
con-stant stirring. The pH range studied for SCB 2 and MMSCB 2 was
from 2.1 to 5.4; 2.5 to 5.6 for Cu2+; 2.4 to 6.1; 2.4 to 6.1 for Cd2+;
2.5 to 5.4; 2.6 to 5.5 for Pb2+, respectively. The pH was adjusted
with an aqueous HCl or NaOH solutions at 0.01–1.0 mol/L. The reaction times used were those obtained from the kinetic study.
There were significant pH variations during the experiments, but they were corrected by adding up an aqueous NaOH or HCl solution (0.01–0.1 mol/L) to the metal solutions with each mate-rial. After single filtration, the metal ions concentration was deter-mined by titration as described earlier.
2.10. Adsorption isotherms for SCB 2 and MMSCB 2
Experiments were performed for each material and metal ion to determine adsorption isotherms. In each experiment, 100 mg for SCB 2 and MMSCB 2 were placed into a 250 mL-Erlenmeyer with 100.0 mL of metal ion solution at specific concentrations from
160 to 290 mg/L and 180 to 230 mg/L for Cu2+; 210 to 310 mg/L
and 250 to 350 mg/L for Cd2+; 430 to 580 mg/L and 500 to
650 mg/L for Pb2+for SCB 2 and MMSCB 2, respectively, under
con-stant stirring. Each experiment was performed using the time and the pH of the greatest ion adsorption obtained from kinetic and pH studies, respectively.
After single filtration, the metal ion concentration was deter-mined by titration as described earlier.
2.10.1. Coordination number
The coordination number was calculated according to Eq.(6)
CN¼ CCOOH
Qmax=MMmetal ð6Þ
whereCCOOHis the concentration of carboxylic functions (mmol/g),
Qmaxis the maximum adsorption capacity (mg/g) obtained from
Langmuir model for Cu2+, Cd2+and Pb2+andMM
metalare the molar
3. Results and discussion
3.1. X-ray diffraction and FTIR analysis for SCB, MSCB and MMSCB
The treatment of lignocellulosic materials such as sisal, cotton linters and sugarcane bagasse with aqueous NaOH solution and the removal of lignin and polyoses together with the rearrange-ment of chain crystal packing from cellulose I in cellulose II have
been reported byAss, Ciacco, and Frollini (2006)andLópez et al.
(2000), regarding position shifts and peak intensities in diffractro-gram and FTIR spectra. Reactions such as the inclusion of alkali and water in cellulose and the splitting and formation of new inter and intramolecular hydrogen bonds have also been reported by Fengel (Fengel,1992, 1993a, 1993b; Fengel & Strobel, 1994), regarding the absorbance variations and wave number shifts in FTIR spectra.
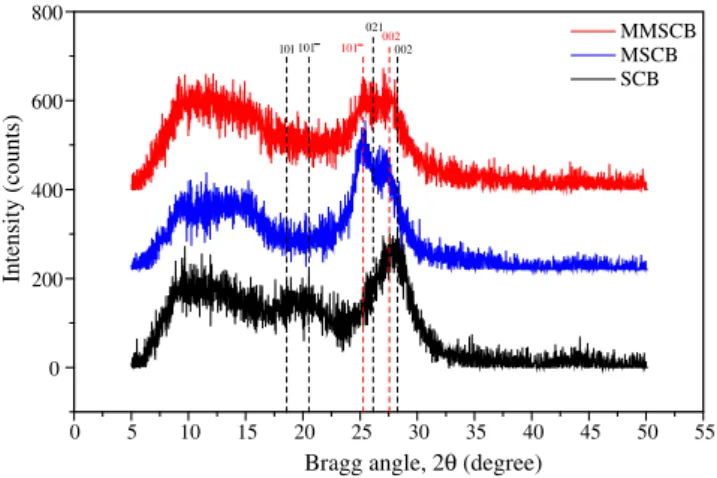
X-ray diffraction curves for SCB, MSCB and MMSCB are shown inFig. 1. When SCB is submitted to the first treatment with aque-ous NaOH solution, hydrolysis reactions of lignin and polyoses oc-cur, consuming a larger amount of alkali and hindering access of hydroxide ions to cellulose. SCB before of the alkaline treatment has shown typical reflections of the polymorphic form attributed
to cellulose I (native cellulose), i.e., at Bragg angles of 28.4°(002
plane), 26.1°(021), 20.6°(101), 18.6°(101). After the first
treat-ment a significant mass loss of 52.6% was noticed due to amor-phous cellulose fraction, lignin and polyoses hydrolysis and cellulose transformation from cellulose I to cellulose II. This trans-formation can be proven by appearance of reflections at Bragg
an-gles typical of cellulose II, namely at 2h25.0°(101) and 27.5°(002)
for MSCB and MMSCB.
When mercerized sugarcane bagasse (MSCB) was submitted to the second treatment with aqueous NaOH solution, a mass loss of 14.5% was noticed. This mass loss is attributed to residual lignin hydrolysis of the first treatment and hydrolysis of glycosidic bonds of cellulose chains. An increase of the amorphous fraction of mate-rials was also observed, characterized by an increase of the region
intensity at 2hfrom 5°to 15°for MMSCB (seeFig. 1).
FTIR spectra in the 3500–640 cm1region are shown inFig. 2a
and b for SCB, MSCB and MMSCB. The treatment of SCB with NaOH transforms cellulose I into cellulose II, and produces a large re-moval of lignin and polyoses and also hydrolysis of amorphous cel-lulose fraction. By this transformation of celcel-lulose I into celcel-lulose II, many characteristic bands are shifted at the maximum peak, and
absorbance is changed as shown inTable 1. The bands at 1631,
1427, 1165, 1053, 1038, 991 and 897 cm1 are shifted to 1637,
1419, 1159, 1062, 1026, 996 and 894 cm1, respectively. Including
the shift of O-H and C-H stretching vibrations (3411?3444 cm1
and 2900?2892 cm1), all the bands are influenced by the
trans-formation related to the change of intra and intermolecular bonds (Ho, Chiu, & Wang, 2005).
By treatment with aqueous NaOH solution, characteristic bands of lignin disappear, and/or the absorbance is changed as can be
no-ticed inFig. 2a and b. We can notice that the large removal of lignin
can be attributed to the disappearance of bands at 1604, 1514 e
1252 cm1(López et al., 2000) corresponding to aromatic skeletal
vibrations and C@O stretch, and of bands at 1325 and 1111 cm1
corresponding to phenolic OH, syringil and condensed guaiacyl
rings vibration. The absorbance of the band at 1377 cm1that
cor-responds to deformation vibration of C–H has decreased due to
large removal of lignin (Schwanninger, Rodrigues, Pereira, &
Hin-terstoisser, 2004).
3.2. The change of CI by transformation
The crystallinity index (CI) for SCB, MMSCB and MMSCB
ob-tained from X-ray diffraction curves, as shown inFig. 1, are 88.6,
94.9 and 77.7%, respectively. The first treatment of SCB with aque-ous NaOH solution removed a large amount of lignin, polyoses and amorphous cellulose fraction, allowing a better packing of cellulose
chains and increasing CI (Ass et al., 2006). On the second
treat-ment, due to large removal of lignin and polyoses, the hydroxide ions could act directly on cellulose fibers, promoting decrease of crystallinity and increase of the material’s amorphous fraction.
3.3. Synthesis of SCB1, MMSCB 1, SCB 2 and MMSCB 2
The synthesis route used to prepare SCB 1, MMSCB 1, SCB 2 and
MMSCB 2 is shown inFig. 3. SCB and MMSCB were reacted with
succinic anhydride for 24 and 4 h, respectively. The reaction with succinic anhydride (succinylation) allows the introduction of car-boxylic functions to materials through formation of ester functions.
The mass percent gains (mpg) were calculated according to Eq.(3).
The succinylation degrees of materials were determined by mea-suring the acid function introduced. The concentration of
carbox-ylic functionspergram of modified materials was determined by
retro-titration [Eq.(4)]. The results are shown inTable 2.
The two treatments of SCB with aqueous NaOH 20 wt% solution reduced CI by 10.9%, removed large amount of lignin and polyoses, converted cellulose I into cellulose II and increased the mass per-cent gain of MMSCB 1 in relation to SCB 1 from 89.6% to 138.6% and the concentration of carboxylic functions from 5.6 to
6.5 mmol/g (Table 2). As the role of the lignin and polyoses is to
unit the bundles of cellulose fiber, their removal facilitates pene-tration of reagents, making the hydroxyl groups of cellulose macro-molecules more easily accessible and making the transformation of cellulose I into cellulose II possible. This rearrangement resulting from alkaline treatment increases the chains separation, reducing packing efficiency and thereby facilitates the penetration of succi-nic anhydride. As a consequence, MMSCB exhibited a larger succ-inylation capacity than SCB.
3.3.1. Characterization of SCB 2 and MMSCB 2
The characterization of carboxylated materials was
accom-plished by FTIR spectroscopy. Fig. 4 shows the FTIR spectra for
SCB and SCB 2 (a), MMSCB and MMSCB 2 (b).
As depicted inFig. 4, the major changes that can be noticed in
FTIR spectrum for SCB in relation to SCB 2, and for MMSCB in rela-tion to MMSCB 2 are: (1) the arising of bands at 2925 for SCB 2 and
MMSCB 2, corresponding to asymmetric stretching of CH2due to
introduction of the succinyl group; (2) the arising of bands at
1577 and 1419 cm1 for SCB 2 and at 1570 and 1417 cm1 for
MMSCB 2, corresponding to asymmetric and symmetric stretching due to presence of carboxylate ion and (3) the arising of two strong
bands, the first for SCB 2 at 1743 cm1and the second for MMSCB 2
0 5 10 15 20 25 30 35 40 45 50 55
0 200 400 600 800
Intensity (counts)
101 101
002 MMSCB
MSCB SCB
Bragg angle, 2θ(degree)
002 021
101
Fig. 1.Wide-angle X-ray diffraction curves for SCB, MSCB and MMSCB.
at 1741 cm1, corresponding to asymmetric and symmetric
stretching of ester groups C–O due to introduction of the succinyl group.
The ester and carboxylate IR bands indicate that succinyl groups
were introducedviaformation of ester bonds with consequent
re-lease of carboxylic functional groups.
3500 3400 3300 3200 3100 3000 2900
40 45 50 55 60 65 70 75 80 85
1800 1750 1700 1650 1600 1550 1500 1450 1400 70
75 80 85 90 95 2892 2900
3444 3411
Transmittance (%)
Wavenumber (cm-1)
Wavenumber (cm-1) Wavenumber (cm-1) Wavenumber (cm-1) SCB
MSCB MMSCB
1514 1734
1631 1637
1604
1419 1427
1400 1350 1300 1250 1200 1150 1100 1050 1000 950 900 50
60 70 80 90
1000 950 900 850 800 750 700 650 600
60 70 80 90 996 991
1053 1062
1038 1026 1165 1159
1252
Transmittance (%)
1377 1325
1111
835 894
897 SCB
MSCB MMSCB
a
b
Fig. 2.FTIR spectra for SCB, MSCB and MMSCB (a) from 3500 to 1400 cm1and (b) from 1400 to 600 cm1.
Table 1
Band characteristics of FTIR spectra related to transformation (cellulose I?cellulose II) by NaOH treatmenta
Characteristics m(cm1) related to the crystal system Dm(cm1)/absorbance change Assignmentb
Cellulose I Cellulose II
Peak Shift 3352 3447 +95/ cOH (hydrogen bonded)
2901 2892 9/ cCH
1431 1419 12/r dCH2(sym) at C-6)
1373 1376 +3/r dC-H
1319 1317 2/r dCH2(wagging) at C-6
1282 1278 4/r dC-H
1236 1228 8/r dCOH in plane at C-6
1202 1200 2/ dCOH in plane at C-6
1165 1162 3/r cCOC atb-glucosidic linkage
1032 1019 13/r cCO at C-6
983 993 +10/D cCO at C-6
897 894 3/D cCOC atb-glycosidic linkagecCOC,cCCO, andcCCH at C5 and C-6
Absorbance change 1337 1337 r dCOH in plane at C-2 or C-3
1263 1263 D dCOH in plane at C-2 or C-3
1114 1114 r cring in plane
1058 1058 r cCO at C-3cC-C
713 713 r dCOH out plane (cellulose Ib)
668 668 D dCOH out of plane
aData fromOh et al. (2005).
3.4. Study of adsorption of Cu2+, Cd2+and Pb2+for SCB 2 and MMSCB 2
The studies of adsorption properties for SCB 2 and MMSCB 2 were accomplished for each material and metal ion. At first, a ki-netic study and an adsorption study as a function of pH were car-ried out.
3.4.1. Effect of contact time
The adsorption equilibrium time experiments were carried out for different contact times with a fixed adsorbent quantity
(100 mg) with 100.0 mL of metal ion solution at pH 5.0 for Cu2+,
7.0 for Cd2+and 6.0 for Pb2+, at fixed concentration. The adsorption
of Cu2+, Cd2+and Pb2+ions increases with contact time. The
equi-librium time was achieved after 10 and 10 min for Cu2+; 20 and
10 min for Cd2+; 20 and 10 min for Pb2+for SCB 2 and MMSCB 2,
respectively. The adsorption equilibrium times mentioned above were chosen for pH and concentration-dependent experiments.
3.4.2. The pH effect
The removal of metal ions from aqueous solutions by adsorp-tion is dependent on the soluadsorp-tion’s pH and, since it affects adsor-bent surface charge, on the degree of ionization, and on the
adsorbates species. The studies of adsorption of Cu2+, Cd2+ and
Pb2+ions on SCB 2 and MMSCB 2 as a function of the pH are shown
inFig. 5a and b. The adsorption of Cu2+, Cd2+ and Pb2+ions
in-creases with the increase of pH. The maximum removal of Cu2+,
Cd2+and Pb2+ions was noticed at pHs 5.4, 6.1 and 5.4 for SCB 2
and at pHs 5.6, 6.1 and 5.5 for MMSCB 2, respectively.
3.4.3. Adsorption isotherms
Adsorption isotherms describe how adsorbates interact with adsorbents and are important in optimizing the use of the latter.
The widely used Langmuir isotherm (Langmuir, 1918) has found
successful application in many real adsorption processes and is ex-pressed as:
qe¼Q1maxbCe
þbCe ð7Þ
which can be rearranged to obtain a linear form Ce
qe¼
1
Qmaxbþ
Ce
Qmax ð8Þ
whereqe(mg/g) is the equilibrium adsorption capacity,Qmax(mg/g)
is the maximum amount of metal ionperunit weight of the cell to
form a complete monolayer coverage on the surface bound at high
equilibrium metal ion concentrationCe(mg/L) andb(L/mg) is
Lang-muir constant related to the binding sites affinity.Qmaxrepresents
the practical limiting adsorption capacity when the surface is fully covered with metal ions, assisting the comparison of adsorption
performance, andbindicates the adsorption reaction bond energy
between metal and material (Ho et al., 2005).
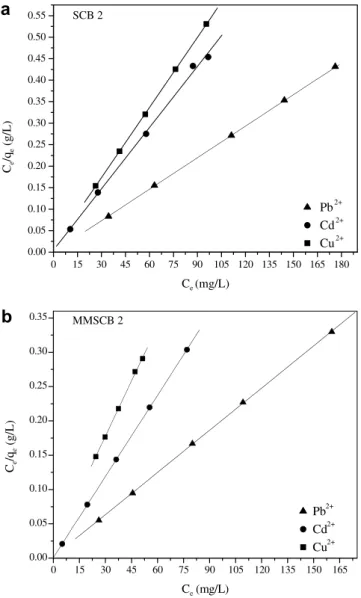
A linearized plot ofCe/qeversus Ceis obtained from the model
shown inFig. 6a and b.Qmaxandbare computed from the slopes
and interceptions of different straight lines representing materials
with different metal ions.Table 3lists the calculated results.
The high correlation coefficients of linearized Langmuir equa-tion indicate that this model can explain metal ion adsorpequa-tion by the modified materials very well.
As shown in Table 3, MMSCB 2 presented larger adsorption
capacity (Qmax) for Pb2+and Cd2+ions than SCB 2. This can be
ex-plained by the removal of large amount of lignin promoted by two treatments with aqueous NaOH solution (20 wt%) and by high-er degree of succinylation exhibited by the MMSCB 2 in relation to
SCB 2. Comparing the coordination number for adsorption of Pb2+
and Cd2+ions for MMSCB 2 and SCB 2, the adsorption capacity of
OH OH
OH
OH OH
OH
O
O O
O
O
SCB: Cellulose I, lignin and polyoses MMSCB: Cellulose II, residual lignin
and polyoses
OH O
SCB 1 and MMSCB 1
Pyridine
O
O
O-Na+ O
NaHCO3
SCB 2 and MMSCB 2
Fig. 3.Synthetic route used to obtain SCB 1, MMSCB 1, SCB 2 and MMSCB 2.
Table 2
Type of material, mass percent gains and concentrations of carboxylic functions
Material Type of cellulose Crystallinity index (%) Mpg (%) CCOOH(mmol/
g)
SCB 1 I 88.6 89.6 5.6 ± 0.0
MMSCB 1 II 77.7 138.8 6.5 ± 0.1
these ions is proportional to the concentration of carboxylic
func-tions, while for adsorption of Cu2+the same is not noticed.
The lignin present in SCB 2 has ligand groups of R–OH type (OH phenolic and unsaturated chains OH) which are classified as hard
bases and show preferences for complex hard acids such as Cu2+
ions, also justifying the smaller maximum adsorption capacity for
Pb2+and Cd2+ions presented by SCB 2 in relation to MMSCB 2.
SCB 2 and MMSCB 2 exhibited equal maximum adsorption
capacity for Cu2+ions. This is explained by the ligand groups of
R–OH type present in lignin. They are classified as hard bases and, therefore, show preferences for complex hard or moderate
acids such as Cu2+ions to form complexes with larger stability
con-stant, justifying this result.
These results were compared with those that have reported by
Gurgel et al. (2008)for succinylated non- and mercerized cellulose
with carboxylate groups (cell 5 and 6, respectively). TheQmaxof
cell 5 and 6 for Cu2+, Cd2+and Pb2+were 123.5 and 153.9 mg/g,
164.0 and 250.0 mg/g, 294.1 and 500.0 mg/g, respectively. Com-paring the succinylated mercerized materials, cell 6 and MMSCB
2, MMSCB 2 exhibited largerQmaxfor Cu2+and Cd2+than cell 6,
and equalQmaxfor Pb2+. For non-mercerized materials, cell 5 and
SCB 2, SCB 2 exhibited largerQmaxfor Cu2+, Cd2+and Pb2+than cell
5. MMSCB 2 presented the largestQmaxin the materials mentioned.
This result shows the efficiency of the mercerization in the synthe-sis of chelating cellulosic materials.
The obtained results were also compared with those reported byHassan and El-Wakil (2003)andNada and Hassan (2006)for
Cu2+ adsorption in aqueous solution. The amidoximated bagasse
(Am-B) obtained by Hassan and El-Wakil (2003) adsorbed
137 mg/g of Cu2+. The oxy-, succinylated, and carboxymethylated
bagasse obtained byNada and Hassan (2006)adsorbed 233, 170,
392 mg/g of Cu2+, respectively. Comparing with obtained materials
in this work only oxy- and carboxymethylated bagasse have shown
a largerQmaxfor Cu2+adsorption.
4. Conclusions
The two alkaline treatments of sugarcane bagasse removed large amount of lignin and polyoses and also the amorphous cellu-lose fraction, converted cellucellu-lose I into cellucellu-lose II, decreased the crystallinity index and increased the separation of the cellulose chains. These modifications provided a higher degree of succinyla-tion proven by higher mass percent gain and concentrasuccinyla-tion of car-boxylic functions exhibited by modified mercerized sugarcane bagasse MMSCB 1. MMSCB 2 exhibited higher adsorption capacity
for Cd2+and Pb2+ions than SCB 2 and equal capacity for Cu2+ion.
4000 3500 3000 2500 2000 1500 1000 500
35 40 45 50 55 60 65 70 75 80 85
30 35 40 45 50 55 60 65 70
Transmittance (%)
Wavenumber (cm-1)
SCB
1419
1577 1743 2925
SCB 2
4000 3500 3000 2500 2000 1500 1000 500
40 45 50 55 60 65 70 75 80 85 90
25 30 35 40 45 MMSCB
1417
1570 1741 2925
Transmittance (%)
Wavenumber (cm-1)
MMSCB 2
a
b
Fig. 4.FTIR spectrum for SCB and SCB 2 (a), MMSCB and MMSCB 2 (b).
2.0 2.5 3.0 3.5 4.0 4.5 5.0 5.5 6.0 6.5
0 50 100 150 200 250 300 350 400 450
Qmax
(mg/g)
pH
Pb2+ Cd2+ Cu2+
SCB 2
2.0 2.5 3.0 3.5 4.0 4.5 5.0 5.5 6.0 6.5
0 50 100 150 200 250 300 350 400 450 500
Qma
x
(mg/g)
pH
Pb2+ Cd2+ Cu2+
MMSCB 2
a
b
In relation to modified non-mercerized sugarcane bagasse (SCB 1), modified mercerized sugarcane bagasse (MMSCB 1) showed an increase in mass percent gain and concentration of carboxylic functions of 49.2% and 0.9 mmol/g, respectively. In relation to modified non-mercerized sugarcane bagasse (SCB 2), modified mercerized sugarcane bagasse (MMSCB 2) presented an increase
in adsorption capacity for Cd2+(43.6 mg/g) and Pb2+(83.3 mg/g)
and also demonstrated that metal ion adsorption efficiency is
pro-portional to the number of introduced carboxylic acid groups. This result shows the efficiency of the mercerization in the synthesis of chelating cellulosic materials.
Acknowledgements
The authors thank the financial support from the following Bra-zilian Government Agencies: Fundação de Amparo à Pesquisa do Estado de Minas Gerais – FAPEMIG, Coordenação de Aperfeiçoa-mento de Pessoal de Nível Superior – CAPES. The authors are also grateful at Universidade Federal de Ouro Preto – UFOP.
References
Ass, B. A. P., Ciacco, G. T., & Frollini, E. (2006). Cellulose acetates from linters and sisal: Correlation between synthesis conditions in DMAc/LiCl and product properties.Bioresource Technology, 97(14), 1696–1702.
Caraschi, J. C., Campana, S. P., & Curvelo, A. A. S. (1996). Preparação e caracterização de polpas para dissolução obtidas a partir de bagaço de cana-de-açúcar.
Polímeros: Ciência e Tecnologia, 3, 24–29.
Clement, R. E., Eiceman, G. A., & Koester, C. J. (1995). Environmental analysis.
Analytical Chemistry, 67(12), 221R–225R.
Fengel, D. (1992). Characterization of cellulose by deconvoluting the OH valency range in FTIR spectra.Holzforschung, 46(4), 283–288.
Fengel, D. (1993a). Influence of water on the OH valency range in deconvoluted FTIR spectra of cellulose.Holzforschung, 47(2), 103–108.
Fengel, D. (1993b). In J. F. Kennedy, G. O. Philips, & P. A. Williams (Eds.).Cellulosics: Chemical, Biochemical and Material Aspects (pp. 135–140). New York: Ellis Horwood.
Fengel, D., & Strobel, C. (1994). FTIR spectroscopic studies on the heterogeneous transformation of cellulose I into cellulose II.Acta Polymerica, 45(4), 319–324. Gupta, V. K., & Ali, I. (2000). Utilisation of bagasse fly ash (a sugar industry waste)
for the removal of copper and zinc from wastewater.Separation and Purification Technology, 18(2), 131–140.
Gupta, V. K., & Ali, I. (2004). Removal of lead and chromium from wastewater using bagasse fly ash – A sugar industry waste.Journal Colloid Interface Science, 271(2), 321–328.
Gurgel, L. V. A., Karnitz Júnior, O., Gil, R. P. F., & Gil, L. F. (2008). Adsorption of Cu(II), Cd(II), and Pb(II) from aqueous single metal solutions by cellulose and mercerized cellulose chemically modified with succinic anhydride.Bioresource Technology, 99(8), 3077–3083.
Hassan, M. L., & El-Wakil, N. A. (2003). Heavy metal ion removal by amidoximated bagasse.Journal of Applied Polymer Science, 87(4), 666–670.
Ho, Y. S., Chiu, W. T., & Wang, C. C. (2005). Regression analysis for the sorption isotherms of basic dyes on sugarcane dust.Bioresource Technology, 96(11), 1285–1291.
Jeffery, G. H., Bassett, J., Mendham, J., & Denney, R. C. (1989). Vogel’s textbook of quantitative chemical analysis. InLongman Scientific & Technical(pp. 309–322). New York: Co-published with John Wiley and Sons Inc (326).
Karnitz Júnior, O., Gurgel, L. V. A., Perin de Melo, J. C., Botaro, V. R., Melo, T. M. S., Gil, R. P. F., et al. (2007). Adsorption of heavy metal ion from aqueous single metal solution by chemically modified sugarcane bagasse. Bioresource Technology, 98(6), 1291–1297.
Krässig, H. A. (1993). Cellulose: Structure, accessibility and reactivity. Polymer monographs(Vol. 11, pp. 88–90). Yverdon, Switzerland: Gordon and Breach Science Publishers. 100–107, 123–125.
Langmuir, I. (1918). Adsorption of gases on plain surfaces of glass, mica and platinum.Journal of the American Chemical Society, 40, 1361–1403.
López, R., Poblano, V. M., Licea-Claveríe, A., Avalos, M., Alvarez-Castillo, A., & Castaño, V. M. (2000). Alkaline surface modification of sugar cane bagasse.
Advanced Composite Materials, 9(2), 99–108.
MacCarthy, P., Klusman, R. W., Cowling, S. W., & Rice, J. A. (1995). Water analysis.
Analytical Chemistry, 67(12), 525R–582R.
Nada, A. M. A., & Hassan, M. L. (2006). Ion exchange properties of carbohydrate bagasse.Journal of Applied Polymer Science, 102(2), 1399–1404.
Oh, S. Y., Yoo, D. I., Shin, Y., Kim, H. C., Kim, H. Y., Chung, Y. S., et al. (2005). Crystalline structure analysis of cellulose treated with sodium hydroxide and carbon dioxide by means of X-ray diffraction and FTIR spectroscopy.
Carbohydrate Research, 340(15), 2376–2391.
Schwanninger, M., Rodrigues, J. C., Pereira, H., & Hinterstoisser, B. (2004). Effects of short-time vibratory ball milling on the shape of FT-IR spectra of wood and cellulose.Vibrational Spectroscopy, 36(1), 23–40.
Sun, J. X., Sun, X. F., Zhao, H., & Sun, R. C. (2004). Isolation and characterization of cellulose from sugarcane bagasse. Polymer Degradation and Stability, 84(2), 331–339.
Weng, C. H., & Huang, C. P. (1994). Treatment of metal industrial wastewater by fly ash and cement fixation. Journal of Environmental Engineering, 120(6), 1470–1487.
0 15 30 45 60 75 90 105 120 135 150 165 180
0.00 0.05 0.10 0.15 0.20 0.25 0.30 0.35 0.40 0.45 0.50 0.55
Pb2+ Cd2+ Cu2+
Ce (mg/L)
SCB 2
0 15 30 45 60 75 90 105 120 135 150 165
0.00 0.05 0.10 0.15 0.20 0.25 0.30 0.35
Pb2+ Cd2+ Cu2+ Ce
/qe
(g/L)
Ce(mg/L)
MMSCB 2
Ce /qe
(g/L)
a
b
Fig. 6.Langmuir isotherm for SCB 2 (a) and MMSCB 2 (b).
Table 3
The Langmuir parameters for Cu2+, Cd2+and Pb2+adsorption
Metal ion Material Langmuir Coordination number
Qmax(mg/g) b(L/mg) R2
Cu2+ SCB 2 185.2 0.540 0.9999 1.85
MMSCB 2 185.2 0.307 0.9994 2.23
Cd2+ SCB 2 212.8 0.94 0.9972 2.85
MMSCB 2 256.4 1.700 0.9998 2.85
Pb2+ SCB 2 416.7 1.000 0.9997 2.69
MMSCB 2 500.00 0.952 0.9999 2.69