ESTIMATION OF HEIGHT OF EUCALYPTUS TREES WITH
NEUROEVOLUTION OF AUGMENTING TOPOLOGIES (NEAT)
1Daniel Henrique Breda Binoti2*, Paulo Junio Duarte3, Mayra Luiza Marques da Silva4, Gilson Fernandes da Silva4, Helio Garcia Leite5, Adriano Ribeiro de Mendonça6, Valdir Carlos Lima De Andrade7 and
Andreina Epifanía Dávila Vega8
1 Received on 01.06.2015 accepted for publication on 16.03.2017.
2 Universidade Federal de Viçosa, Doutorado em Ciência Florestal, Viçosa, Minas Gerais, Brasil. E-mail: <[email protected]>. 3 Universidade Federal de Lavras, Programa de Pós-Graduação em Tecnologia da Madeira, Lavras, Minas Gerais, Brasil.
E-mail: <[email protected]>.
4 Universidade Federal do Espírito Santo, Departamento de Engenharia Florestal, Espírito Santos, Brasil. E-mail: <[email protected]>
and<[email protected]>.
5 Universidade Federal de Viçosa, Departamento de Engenharia Florestal, Viçosa, Minas Gerais, Brasil. E-mail: <[email protected]>. 6 Universidade Federal do Espírito Santo, Departamento de Engenharia Florestal e da Madeira, Jerônimo, Espírito Santo,
Brasil. E-mail: <[email protected]>.
7 Universidade Federal de Lavras, Doutorado em Engenharia Florestal, Viçosa, Minas Gerais, Brasil. E-mail: <[email protected]>. 8 Universidade Federal de Viçosa, Programa de Pós-Graduação em Ciência Florestal, Viçosa, Minas Gerais, Brasil. E-mail:
<[email protected]>. *Corresponding author.
ABSTRACT – The aim of this study was to evaluate the method of neuroevolution of augmenting topologies (NEAT) to adjust the weights and the topology of artificial neural networks (ANNs) in the estimation of tree height in a clonal population of eucalyptus, and compare with estimates obtained by a hypsometric regression model. To estimate the total tree height (Ht), the RNAs and the regression model, we used as variables a diameter of 1.3 m height (dbh) and the dominant height (Hd). The RNAs were adjusted and applied to the computer system NeuroForest, varying the size of the initial population (the genetic algorithm parameter) and the density of initial connections. Estimates of the total height of the trees obtained with the use of RNA and the regression model were evaluated based on the correlation coefficient, the percentage of errors scatter plot, the percentage frequency histogram of percentage errors, and the root mean square error (root mean square error - RMSE). Various settings which resulted in superior statistics to the hypsometric regression model were found. Connections had the highest correlation and the lowest RMSE% with a population size value of 300 and an initial density of 0.1 RNA. The NEAT methodology proved effective in estimating the height of trees in clonal population of eucalyptus.
Keywords: Hypsometric regression; Forest measurement; Artificial neural networks.
ESTIMAÇÃO DA ALTURA DE ÁRVORES DE EUCALIPTO COM
NEUROEVOLUTION OF AUGMENTING TOPOLOGIES (NEAT)
RESUMO – O objetivo geral deste trabalho foi avaliar o método Neuroevolution of Augmenting Topologies
de tamanho de população 300 e densidade inicial das conexões de 0,1 obteve a maior correlação e o menor RMSE%. Foram encontradas várias configurações de RNA com estatísticas superiores ao modelo hipsométrico de regressão. A metodologia NEAT pode ser utilizada para a estimação da altura de árvores em povoamento clonais de eucalipto.
Palavras-Chave: Relação hipsométrica; Mensuração florestal; Redes neurais artificiais.
1. INTRODUCTION
The estimation of the volume of trees in forest inventories provides information about the wood stock and the productive potential of the forests. This is important information for the planning of the sector. The most commonly used estimation method is the forest inventory, which is based on the allocation of representative forest stands and then estimation of the results for the total area (Husch et al., 2003; Burkhart and Tomé, 2012).
In forest inventories, height and diameter are dendrometric variables essential for estimating the volume of wood in trees (Campos, 1983). The relationship between these variables is referred to as hypsometric. This relationship is affected by environmental factors and characteristics of the population, such as age, genetic material, productive capacity and qualitative characteristics (Curtis, 1967; Zhang et al., 1997; Fang and Bailey, 1998). The inclusion of forest stands characteristics in hypsometric models such as those cited above has advantages including obtaining more accurate estimates and greater biological realism, making the equation adaptable to various locations (Campos and Leite, 2013).
According to Leite and Andrade (2004), height measurement is considered a significant component in the calculation of forest inventory. Obtaining it involves performing the measurement indirectly, and so the method is neither fast nor accurate, particularly when compared to dbh. In addition, problems such as wind conditions, and lack of visibility from the top of the tree in dense forests, may make measurement infeasible in forest plantations. Within this context, the common practice is to measure the height of some trees in the forest inventory plots, and estimate the heights of the others with hypsometric models.
An alternative method of forest measurement is the application of artificial neural networks (ANN), which has produced results superior to the conventional statistical models (Diamantopoulou 2005; Görgens et al., 2009; Silva et al., 2009; Diamantopoulou and Milios, 2010; Leite et al., 2010; Binoti, 2012).
ANN is a mathematical representation of the biological neural networks found in the human brain. In practice, they consist of a parallel computer system consisting of several simple processing elements (artificial neurons) linked together in a specific way to perform a given task. The ANN is presented with several examples of a possible problem, from which it extracts characteristics during the learning process (adjustment of the synaptic weights), and then applies the knowledge acquired to new data from similar problems (generalization) (Braga et al., 2007; Silva et al., 2010).
Despite the increasing development and application of ANN in the area of forestry (in both academic and business environments), one of the biggest challenges to ANN users is to define the topology and the appropriate architecture. Several factors including the number of layers, the number of neurons per layer, and type of activation function, make up the topology. The architecture refers to the direction of the connections between the neurons (feedforward or feedbackward). Generally, these parameters are defined empirically, testing different configurations until an acceptable level of error is reached (Braga et al., 2007; Silva et al., 2010; Binoti, 2012; Diamantopoulou, 2012).
The neuroevolution of augmenting topologies (NEAT) method was developed by Stanley (2004) to address the problem. NEAT allows for the simultaneous adjustment of the synaptic weights of an artificial neural network and the appropriate topology. This method uses genetic algorithms (GAs). NEAT initiates the topology with input and output layers, increasing the complexity of the topology with each GA generation. In a NEAT network, an intermediate neuron does not necessarily constitute an intermediate layer because it can connect to only a few neurons with unidirectional or bidirectional connections (Stanley and Miikkulaien, 2002; Stanley, 2004).
2. MATERIAL AND METHODS 2.1 Data Description
Data from forest plantations located in the southern region of the state of Bahia were used. The total height of 19,560 eucalyptus trees, from a single source of genetic material, with an age range from 21.3 to 136.8 months, was considered for this analysis. For the estimation of the total height of the trees (Ht) we used quantitative variables, with the diameter value set to 1.3 m height (dbh) and dominant height (Hd) used for both RNA and regression model. The measured sample trees had Ht values between 7.0 and 39.0 m, dbh values between 5.1 and 28.3 cm, and the Hd of the plots ranged between 8.6 and 39.0 m.
The data obtained from the sample trees were divided into two groups: training (adjustment) and generalization (validation). In the selection of these sets, an equivalent proportion of data was considered in each diametric class, so that the sets were representative of the data. For the artificial neural networks, the training set consisted of the first three trees with the total height measurement of each plot, while the generalization set consisted of the other trees with total height measurement (10 to 15 per plot) in each forest inventory. To adjust the hypsometric regression models, the adjustment set consisted of all heights measured in the plot (10 or 15 trees with height measured per plot). As such validation was not performed, as this is the traditional process in use in most companies in the Brazilian forestry sector. 2.2 Neuroevolution of Augmenting Topologies (NEAT)
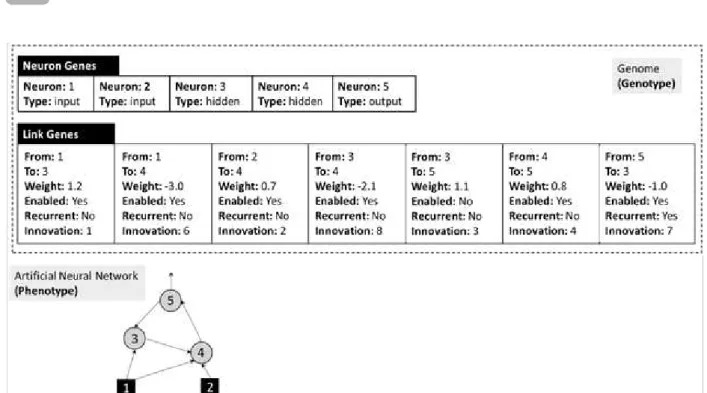
The NEAT method simultaneously adjusts synaptic weights and ANN topology using a GA, constituting an area known as neuroevolution (Stanley and Miikkulaien, 2002; Stanley, 2004). GA are heuristic techniques inspired by the biological process of natural evolution. Each ANN is represented by a set of parameters called the genome or chromosome. The genome is composed of genes that can take on different values called alleles. The coding of neural networks in genome structure (chromosomes) consists of a list of genes referring to the artificial neurons and a list of genes referring to the connections between these neurons. Figure 1 shows the genotype (lists of neurons and connections) and the phenotype (network) of an ANN with two input neurons, two hidden neurons, and one output neuron. The list of neurons identifies the
neuron number and type (input, hidden, or output). The list of connections identifies the connection sense, the synaptic weight value, whether the connection is enabled or not (whether or not it is expressed in the phenotype), whether it is recurring or not, and the number of the innovation.
Initially the NEAT creates a population of single layer networks, but with different synaptic weights. Through successive generations of GA, genetic operators increase the structure of networks by adding neurons and/or connections, as well as adjusting the synaptic weights until a network with satisfactory results is obtained (Figure 2).
2.3 Hypsometric Model
For comparison purposes, a hypsometric model, commonly used on an operational scale by forestry companies in Brazil, was adjusted.
Where: ln = Napierian logarithm; i = regression parameters; dbh = diameter at 1.3 m height; Hd = dominant height of plot; and
2.4 Application of the NEAT method
The computational system used to apply the NEAT was the NeuroForest 3.3 (Binoti, 2012), available free of charge from their homepage (http:// neuroforest.ucoz.com/). The system allows the user to configure the population size and density parameters of the initial connections.
In this work population sizes of 100, 200, 300, and 400 individuals (number of nets tested in each iteration), and initial connection densities of 0.1, 0.5, and 1.0 (initial connection rate of each iteration, for example, 0.1 equals 10%) were used. Five ANN were trained for each of the combinations of the NEAT parameters, totaling 60 ANN.
The NEAT was set to stop training when the number of times or cycles (number of times all the training set data are applied to the RNA for parameter adjustment) reached 3,000 or when the mean squared error was equal to 0.0001, whichever happened first.
The processing time of the NEAT method for the combinations of the initial parameters was quantified in a computer with an AMD FX™-8350 Eight-Core, 4.00 GHz processor, 32.0 GB of RAM, and a 64-bit operating system.
Eq1
Figura 2 – Esquema geral do método NEAT. Figure 2 – General scheme of NEAT method.
Figure 1 – Encoding genotype and phenotype of an artificial neural network by NEAT method (Adapted from Buckland, 2002).
2.5 Evaluation of methods
Estimates of the total height of the trees obtained with RNA and the regression model were evaluated based on the Pearson linear correlation coefficient between the observed and estimated values in the percentage error dispersion graph, and the percentage frequency histogram of the percentage errors and root mean square error (RMSE %).
The root mean square error (RMSE%) evaluates the mean square difference between the observed values and the estimated values. The lower the RMSE, the better the accuracy of the estimate being:
where, (Ht) ´ is the mean of observed heights (field measurements),?Ht?_i is the observed height of the i-th tree, (Ht) ^_i is the estimated height of the i-th tree and n is the total number of data.
To evaluate the average performance of the ANN for each configuration option of the NEAT parameters, the correlation and the mean RMSE% of the five ANNs adjusted for each combination were evaluated.
3. RESULTS
Among the various combinations of the parameters of the NEAT method tested, the 12 ANN that presented the best results in terms of linear correlation and RMSE% are presented in Table 1, along with the corresponding statistics for the hypsometric model. ANN were found that presented higher correlation and lower values of RMSE% in comparison to the hypsometric model in both training and generalization.
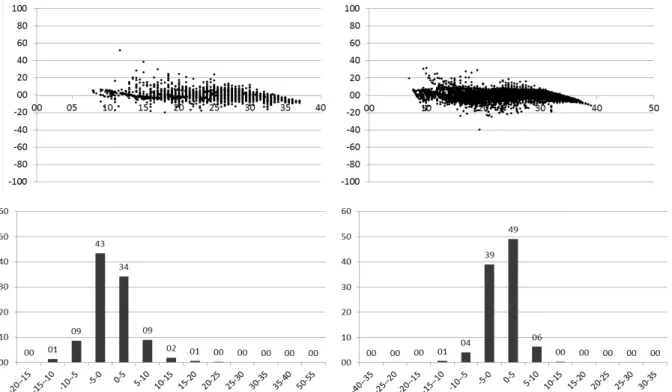
The best result was obtained with ANN 49, which completed its training after 3,000 cycles, with population size equal to 400 and initial density of connections equal to 0.1 (Table 1). The percentage errors of the estimates by ANN 49, 95% in training were between ± 10%, and 98% in this same interval in generalization (Figure 3).
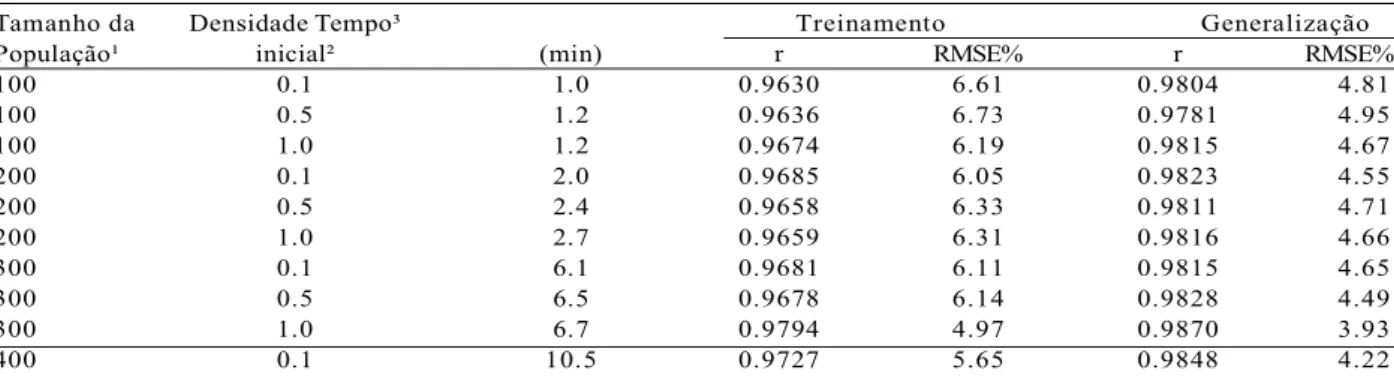
On average, a population size value of 300 and an initial density of connections value of 0.1 obtained the highest correlation and the lowest RMSE% (Table 2).
Table 2 indicates that the processing time spent for RNA generation was not high, even with a relatively large database, maintaining the accuracy of the traditional method commonly used and reducing the number of trees collected in the field.
4. DISCUSSION
There was a small improvement in the analyzed statistics with increased population size, but at the cost of a significant increase in the processing time of each ANN. According to Heaton (2011), this increase in computational cost during network training with increasing population size may lead to non-convergence of the algorithm or hardware locking.
It was not possible to perceive any influence of the initial density of the connections in the quality of the estimates, as good results were obtained in all values tested.
During the process of training the ANNs for operational application, the measurement team faced the problem of defining the structure and the ideal topology for training. Achieving consistency and avoiding bias in the estimates was a concern.
Because of the dynamics of the forest company, where innumerable hypsometric estimates must be obtained with temporal and computational constraints, tests on the best structure and/or topology of the ANNs used could not be implemented as they would have resulted in a low operational measurement performance. Algorithms that automatically define the structure and topology of the ANNs are thus extremely important to facilitate their application. This applies not only in the forest measurement sector, but also in more diverse sectors of forestry engineering where the aim is to reduce operational and processing costs.
Measuring tree heights in the forest inventory is carried out indirectly. Several factors can introduce errors in the measurement process of this variable. These include wind, tree positioning, tree visibility, luminosity, and equipment accuracy (Hush et al., 2003). Although a simple change of methodology for the estimation of tree height will not provide significant gains for the forest measurement team, associated reduction in the number of trees measured in the field does provide the advantage of reducing both costs and errors associated with the difficulty of measuring this variable (Binoti, 2012).
Modelo Tamanho da Densidade Critério de Treinamento Generalização
População¹ inicial² Parada³ r RMSE% r RMSE%
Hipsométrico - - - 0.9799 5.01 -
-RNA 4 100 0.1 3000 0.9686 6.11 0.9844 4.30
RNA 8 100 0.5 3000 0.9616 6.71 0.9793 4.95
RNA 14 100 1.0 3000 0.9796 4.96 0.9868 3.97
RNA 16 200 0.1 3000 0.9805 4.83 0.9883 3.73
RNA 25 200 0.5 3000 0.9784 5.07 0.9871 3.92
RNA 26 200 1.0 3000 0.9807 4.80 0.9881 3.78
RNA 31 300 0.1 3000 0.9810 4.78 0.9878 3.80
RNA 36 300 0.5 3000 0.9803 4.85 0.9894 3.56
RNA 41 300 1.0 3000 0.9803 4.85 0.9878 3.82
RNA 49 400 0.1 3000 0.9810 4.76 0.9896 3.53
RNA 51 400 0.5 3000 0.9818 4.66 0.9891 3.64
RNA 60 400 1.0 3000 0.9789 5.03 0.9884 3.73
Table 1 – Characteristics of the twelve best artificial neural networks by NEAT adjusted for each combination of parameters and their statistics for the training and generalization.
Tabela 1 – Características das doze melhores redes neurais artificiais ajustadas pelo NEAT para cada combinação de parâmetros e suas respectivas estatísticas para o treinamento e generalização.
¹ Número inicial de RNA testadas a cada iteração do NEAT. ² Taxa de conexões iniciais. ³ Critério de parada do algoritmo, 3000 ciclos ou épocas. r = coeficiente de correlação linear de Pearson. RMSE%: Root Mean Square Error.
Figure 3 – Dispersal of percentage errors on the amounts of the observed heights (m), training and generalization. Percentage frequency histogram of percentage errors in training and generalization, respectively.
5. CONCLUSION
The NEAT methodology generated accurate estimates, with no bias, for the proposed study. This proves that the NEAT method is feasible for the parameterization of ANNs for academic and operational applications of measurement and forest management
6.REFERENCES
Binoti MLMS. Redes neurais artificiais aplicadas ao manejo florestal [tese]. Viçosa, MG:
Universidade Federal de Viçosa; 2012.
Braga AP, Carvalho APLF, Ludermir TB. Redes neurais artificiais: Teoria e aplicações. 2ª ed. Rio de Janeiro: LTC; 2007.
Burkhart HE, Tomé M. Modeling forest trees and stands. Dordrecht: Springer; 2012
Campos JCC. Dendrometria. Viçosa, MG: Universidade Federal de Viçosa; 1983.
Campos JCC, Leite HG. Mensuração florestal: perguntas e respostas. 4ª ed. Viçosa, MG: Universidade Federal de Viçosa; 2013.
Curtis RO. Height-diameter and height-diameter-age equations for second growth Douglas-fir. Forest Science. 1967;13:365-75.
Diamantopoulou MJ. Artificial neural networks as an alternative tool in pine bark volume estimation.
Tamanho da Densidade Tempo³ Treinamento Generalização
População¹ inicial² (min) r RMSE% r RMSE%
100 0.1 1.0 0.9630 6.61 0.9804 4.81
100 0.5 1.2 0.9636 6.73 0.9781 4.95
100 1.0 1.2 0.9674 6.19 0.9815 4.67
200 0.1 2.0 0.9685 6.05 0.9823 4.55
200 0.5 2.4 0.9658 6.33 0.9811 4.71
200 1.0 2.7 0.9659 6.31 0.9816 4.66
300 0.1 6.1 0.9681 6.11 0.9815 4.65
300 0.5 6.5 0.9678 6.14 0.9828 4.49
300 1.0 6.7 0.9794 4.97 0.9870 3.93
400 0.1 10.5 0.9727 5.65 0.9848 4.22
Table 2 – Average performance of correlation and RMSE% of each combination of NEAT parameters.
Tabela 2 – Desempenho médio das estatísticas de correlação e RMSE% de cada combinação dos parâmetros do NEAT.
¹ Número inicial de RNA testadas a cada iteração do NEAT. ² Taxa de conexões iniciais. ³ Tempo médio de processamento de cada RNA em minutos. 4 Critério de parada do algoritmo, 3000 ciclos ou épocas. r = coeficiente de correlação linear de Pearson. RMSE%: Root
Mean Square Error.
Computers and Electronics in Agriculture. 2005;10:235-44.
Diamantopoulou M, Milios E. Modelling total volume of dominant pine trees in reforestations via multivariate analysis and artificial neural network models. Biosystems Engineering. 2010;105:306-15.
Diamantopoulou M. Assessing a reliable modeling approach of features of trees through neural network models for sustainable forests.
Sustainable Computing: Informatics and Systems. 2012;2:190-7.
Fang Z, Bailey RL. Height-diameter models for tropical forests on Hainan Island in southern China. Forest Ecology and Management. 1998;110:315-27
Görgens EB, Leite HG, Santos HN, Gleriani JM. Estimação do volume de árvores utilizando redes neurais artificiais. Revista Árvore. 2009;33:1141-7.
Heaton J. Programming Neural Networks with Encog3 in Java. 2nd ed. Heaton Research; 2011
Husch B, Beers TW, Kershaw JA. Forest mensuration. 4th ed. New York: John Wiley & Sons; 2003.
Leite HG, Andrade VCL. Uso do método da altura relativa em inventário florestal de um povoamento
Silva IN, Spatti DH, Flauzino RA. Redes neurais artificiais para engenharia e ciências aplicadas. São Paulo: Artliber; 2010.
Silva MLM, Binoti DHB, Gleriani JM, Leite HG. Ajuste do modelo de Schumacher e Hall e aplicação de redes neurais artificiais para estimar volume de árvores de eucalipto. Revista Árvore. 2009;33:1133-9.
Stanley K, Miikkulaien R. Evolving neural networks through augmenting topologies.
Evolutionary Computation. 2002;10:99-127.
Stanley KO. Efficient evolution of neural networks through complexification [tese]. Austin: The University of Texas at Austin, Department of Computer Sciences; 2004.
Zhang S, Burkhart HE, Amateis RL. The influence of thinning on tree height and diameter
relationships in loblolly pine