Epistatic effects on grain yield of soybean [
Glycine max
(L.) Merrill]
Marco Antonio Acevedo Barona1, José Manoel Colombari Filho2, Vanderlei da Silva Santos3 and Isaias Olívio Geraldi4*
Received 04 July 2012 Accepted 25 September 2012
Abstract – Studies addressing the estimation of genetic parameters in soybean have not emphasized the epistatic effects. The purpose of this study was to estimate the significance of these effects on soybean grain yield, based on the Modified Triple Test Cross design. Thirty-two inbred lines derived from a cross between two contrasting lines were used, which were crossed with two testers (L1 and L2). The experiments were carried out at two locations, in 10 x 10 triple lattice designs with 9 replications, containing 32 lines (Pi ), 64 crosses (32 Pi x L1 and 32 Pi x L2 ) and controls. The variation between ( ͞L1i + ͞L2i - ͞Pi ) revealed the presence of epistasis, as well as an interaction of epistasis x environment. Since the predominant component of epistasis in autogamous species is additive x additive (i type), we suggest postponing the selection for grain yield to later generations of inbreeding in order to exploit the beneficial effects of additive x additive epistasis.
Key words: Gene action, modified triple test cross, epistasis × environment interaction.
1 Instituto Nacional de Investigaciones Agrícola (INIA), Calabozo, Guárico, Venezuela 2 Embrapa Arroz e Feijão, C.P. 179, 75.375-000, Santo Antônio de Goiás, GO, Brazil 3 Embrapa Mandioca e Fruticultura, C.P. 07, 44.380-000, Cruz das Almas, BA, Brazil
4 Departmento de Genetica, ESALQ/USP, C.P. 83, 60.245-965, Piracicaba, SP, Brazil. * E-mail: [email protected] INTRODUCTION
In soybean breeding programs [Glycine max (L.) Mer-rill], inbred lines are developed in a continuous process to release new cultivars, which is one of the strategies that has contributed most to increase yield and sustainability in modern agriculture. Most of the traits with an economic impact on the different species are quantitative. Genetic
studies are usually based on a simplified model that defines
the phenotypic value as a result of the genotypic plus the
environmental effect. Johannsen was the first to demon
-strate that the observed phenotypic variation results from the combined effect of genetic variation and environmental variation (Allard 1971), so that the environmental effect always represents an uncertainty factor in the estimation of genetic parameters (Ramalho et al. 2000).
With the advancement of quantitative genetics, the population structure was better understood by the genetic components of variation, resulting from the allelic and non-allelic action and interaction (epistasis). The term
epistasis was first proposed by Bateson (1909) to designate
the interaction between alleles from different loci. In 1918, Fisher partitioned the genetic variance in additive (average
effects of alleles), dominant (interactions between alleles of the same locus) and epistatic (interactions between alleles of different loci), of which the latter was considered the most complex for trait inheritance studies (Fisher 1984). According to Bernardo (2002), epistatic effects exist when the sum of the individual effects of the loci are larger or smaller than the overall effect thereof; in other words, in the absence of epistatic effects, a single additive-dominant model would fully explain the expression of a character. On the other hand, when epistasis is present, it can bias the estimates of additive and dominant genetic components, resulting in inaccurate estimates of important genetic parameters, such as heritability and expected response to selection.
Although epistasis is already known since the first genetic
studies, discussions about the importance for quantitative traits have repeatedly emerged in the literature, without consistent results. Currently, there is a growing interest in epistasis, mainly because the epistatic effects are involved in the genetic basis of heterosis and inbreeding depression (Primomo et al. 2005). For autogamous species, the most important are possibly the additive x additive epistatic effects, since inbred lines are developed by natural and
artificial selection.
Crop Breeding and Applied Biotechnology 12: 231-236, 2012 Brazilian Society of Plant Breeding. Printed in Brazil
There are many examples of epistasis for qualitative traits, but this does not apply to the quantitative traits, where relatively complex designs are required to detect epistasis. Mather (1949) proposed a method based on the analysis of generation means; however, the additive, dominant and epistatic genetic effects that constitute the model cannot be tested independently, preventing an individual interpretation of each effect. The method of Cockerham (1954) allows testing the genetic effects of the model independently; however, for being based on variance components, the error is larger than of the mean components. Moreover, the method involves a more complex genetic-statistical approach, limiting its ap-plications. The Triple Test Cross (TTC) design proposed by
Kearsey and Jinks (1968), which is a modification of the “North
Carolina III” design, has been widely used because it allows an accurate detection of the presence of epistasis, regardless of the allele frequency, inbreeding level and occurrence of linkage disequilibrium in the population. Later, Jinks et al.
(1969) proposed a modification, known as Modified Triple
Test Cross, which is better suited for autogamous species. The importance of epistasis has been reported in several species for many economically important traits, e.g. yield,
using the TTC or Modified TTC, especially in recent years.
However, few papers deal with epistasis in soybean. In ad-dition, few studies have addressed the interaction between epistatic effects and environments. The purpose of this work
was to study the epistatic influence on grain yield and the
epistasis x environment interaction in soybean.
MATERIALS AND METHODS
The plant material used in this experiment consisted of inbred lines of a soybean population derived from the cross between lines PI-123439 and PI-239235. From the F2 generation of this cross, the population was inbred without selection, by the single-seed descent (SSD) method up to generation F8, to develop a set of completely inbred lines. From this population, 32 lines were randomly chosen (Pi, with i = 1, 2, ..., 32) and two others were selected (the most contrasting for grain yield) as testers ( L1 and L2), according
to the Modified TTC method (Jinks et al. 1969).
The 32 lines were crossed with the two testers, i.e., 32 ( Pi x L1 ) crosses and 32 ( Pi x L2 ) crosses, resulting in a total of 64 crosses. From the F1 seeds, the F2, F3 andF4 generations were obtained for the 64 crosses, by harvesting all plants of each cross in bulk. This procedure was applied to increase the number seeds of each cross, and allows per-forming experiments with a large number of replications. For this purpose, the experimental evaluations were carried out in the F4 generation.
In the 2006/7 growing season, experimental evaluations were carried out at two locations: Location 1: Experimental
Station of the Department of Genetics, in Piracicaba, São Paulo, and Location 2: Experimental Station of Anhumas, in Piracicaba, São Paulo, both of which belongto the Department of Genetics, ESALQ/USP. These locations differ primarily in the soil type (Location 1-clay soil, and Location 2- sandy soil).
A 10 x 10 triple lattice design (nine replications) was used, with 100 treatments: 32 (Pi x L1) crosses and 32 (Pi x L2) crosses; 32 original lines (Pi); two commercial controls (IAC-100 and IAC-8); plus two experimental lines. The last two were only included to complete 100 treatments. The plots consisted of 2-m-rows spaced 0.5 m apart, with 35 plants each after thinning. The grain yield (GY) was evaluated in g plot-1 at maturity.
The experimental data were subjected to analysis of vari-ance by location and then to combined analysis of varivari-ance, according to the following mathematical model, in which the treatment effect was considered as random and the location
effect as fixed: Yijkl = μ + ti + rj(l) + bk(jl) + ll + tlil + εijkl, where
Yijkl is the observed value of treatment i in block k of replica-tion j at location l; μ is the general mean; tiis the effect of treatment i, with i varying from 1 to 100; rj(l)is the effect of replication j within location l, with j ranging from 1 to 9;
bk(jl)is the effect of block k within replication j and location l, with k ranging from 1 to 10; llis the effect of location l, with l ranging from 1 to 2; tlilis the interaction effect of treatmenti i and location l; andεijklis the experimental error associated with the plot ijkl. In all analyses, the grain yield (GY) data were corrected according to the stand (number of surviving plants per plot).
Then, the treatment means were subjected to analysis
of variance according to the modified TTC method (Jinks
et al. 1969). This method tests epistasis based on the vari-ance between (͞L1i + ͞L2i - ͞Pi) for i = 1, 2,... 32, where L1i is the mean of the cross of the i-th line with tester L
1; L2iis
the mean of the cross of the i-th line with tester L 2; and Pi
is the mean of the i-th line per se. As there are 32 contrasts,
the mean square has 31 degrees of freedom and is tested with the error of the analysis of variance. If the variation
between these contrasts is non-significant, the conclusion is
that there is no epistasis, whereas significance of the varia
-tion between the contrasts shows the existence of epistasis; in this second case, the genetic variances estimated by the additive-dominant model may be biased (Jinks et al. 1 969).
The original methodology is based on the evaluation of the crosses ( L1i and L2i ) in the F1 generation, but in this study the F4 generation was assessed. The progeny means in the F4 generation, based on a model of two loci with two
alleles (data not shown), indicated that only the coefficients
Following the recommendation of Ketata et al. (1976),
the t-test was also used to compare the significance of the
overall mean of the epistatic deviations, based on the con-trasts among populations. According to these authors, the reason is that when (͞L1i + ͞L2i - ͞Pi) for i = 1, 2, ..., n, have similar magnitudes and equal sign, the F test cannot detect the presence of epistasis. The t-test is performed using the error degrees of freedom of the analysis of variance.
RESULTS AND DISCUSSION
The experimental precision of the experiments at both
locations was satisfactory, with coefficients of experimen
-tal variation (CV%) for GY (Table 1) similar to those re-ported in the literature for the same plot size used in this study (Barona et al. 2009, Colombari-Filho et al. 2010). The overall mean was 144.1 g plot-1 for Location1 and 203.4
g plot-1 for Location 2, which is the reason for the higher
CV% at Location 1 (32.3%) than at Location 2 (23.6%), since the mean squares of the error of both locations were similar. This difference between locations can also be shown in the control (IAC-100 and IAC-8) means, which were about 20% higher at Location 2.
Significant differences (p ≤ 0.01) among treatments were
observed at both locations (Table 1). When the variation among treatments was partitioned in crosses L1i, crosses L2i and lines Pi, the occurrence of significant differences
(p ≤ 0.01) for GY was observe d at both locations for all
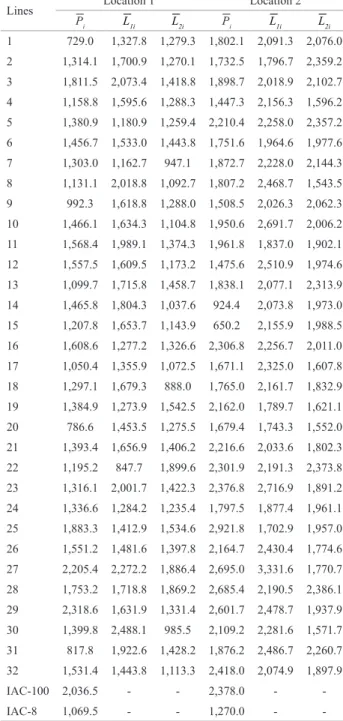
sources, indicating the occurrence of high variability for crosses and lines considered. This variation can be easily observed by the treatment means (Table 2). The means of the 32 lines ranged from 729 - 2,318 kg ha-1 (Location 1)
and 650 - 2,921 kg ha-1 (Location 2). For crosses with Tester
1, means ranged from 847 - 2,488 kg ha-1 (Location 1) and
1,702 - 3,331 kg ha-1 (Location 2), while for the crosses with
Tester 2 means ranged from 888 - 1,899 kg ha-1 (Location
1) and 1,543 - 2,386 kg ha-1 (Location 2).
Table 1. Analysis of variance for grain yield (GY, g plot-1) of soybean at
two locations. Modified Triple Test Cross design, assessed in two 10 x 10
triple lattice experiments with nine replications
Sources of variation Location 1 Location 2
df MS df MS
Replications (R) 8 20,267.0 ** 8 68,991.0 **
Blocks/R 81 2,705.0 81 9,401.6 **
Treatments - - -
-Crosses (L1i) 31 9,609.6 ** 31 8,568.9 **
Crosses (L2i ) 31 4,523.9 ** 31 5,525.0 **
Lines (Pi ) 31 10,037.0 ** 31 17,827.0 **
Intra-block error 686 2,174.9 676 2,432.9
Mean 144.1 203.4
CV% 32.3 23.6
IAC-100 203.6 237.8
IAC-8 106.9 127.0
** significant (p ≤ 0.01) by the F test, respectively.
Table 2. Means, in kg ha-1, of 32 soybean lines ( ͞P
i), 32 crosses of the
lines with tester 1 ( ͞L1i ), 32 crosses of the lines with tester 2 ( ͞L2i ) and controls, at both locations, assessed in two 10 x 10 triple lattice design, with nine replications
Lines Location 1 Location 2
͞Pi ͞L1i ͞L2i ͞Pi ͞L1i ͞L2i 1 729.0 1,327.8 1,279.3 1,802.1 2,091.3 2,076.0
2 1,314.1 1,700.9 1,270.1 1,732.5 1,796.7 2,359.2
3 1,811.5 2,073.4 1,418.8 1,898.7 2,018.9 2,102.7
4 1,158.8 1,595.6 1,288.3 1,447.3 2,156.3 1,596.2
5 1,380.9 1,180.9 1,259.4 2,210.4 2,258.0 2,357.2
6 1,456.7 1,533.0 1,443.8 1,751.6 1,964.6 1,977.6
7 1,303.0 1,162.7 947.1 1,872.7 2,228.0 2,144.3
8 1,131.1 2,018.8 1,092.7 1,807.2 2,468.7 1,543.5
9 992.3 1,618.8 1,288.0 1,508.5 2,026.3 2,062.3
10 1,466.1 1,634.3 1,104.8 1,950.6 2,691.7 2,006.2
11 1,568.4 1,989.1 1,374.3 1,961.8 1,837.0 1,902.1
12 1,557.5 1,609.5 1,173.2 1,475.6 2,510.9 1,974.6
13 1,099.7 1,715.8 1,458.7 1,838.1 2,077.1 2,313.9
14 1,465.8 1,804.3 1,037.6 924.4 2,073.8 1,973.0
15 1,207.8 1,653.7 1,143.9 650.2 2,155.9 1,988.5
16 1,608.6 1,277.2 1,326.6 2,306.8 2,256.7 2,011.0
17 1,050.4 1,355.9 1,072.5 1,671.1 2,325.0 1,607.8
18 1,297.1 1,679.3 888.0 1,765.0 2,161.7 1,832.9
19 1,384.9 1,273.9 1,542.5 2,162.0 1,789.7 1,621.1
20 786.6 1,453.5 1,275.5 1,679.4 1,743.3 1,552.0
21 1,393.4 1,656.9 1,406.2 2,216.6 2,033.6 1,802.3
22 1,195.2 847.7 1,899.6 2,301.9 2,191.3 2,373.8
23 1,316.1 2,001.7 1,422.3 2,376.8 2,716.9 1,891.2
24 1,336.6 1,284.2 1,235.4 1,797.5 1,877.4 1,961.1
25 1,883.3 1,412.9 1,534.6 2,921.8 1,702.9 1,957.0
26 1,551.2 1,481.6 1,397.8 2,164.7 2,430.4 1,774.6
27 2,205.4 2,272.2 1,886.4 2,695.0 3,331.6 1,770.7
28 1,753.2 1,718.8 1,869.2 2,685.4 2,190.5 2,386.1
29 2,318.6 1,631.9 1,331.4 2,601.7 2,478.7 1,937.9
30 1,399.8 2,488.1 985.5 2,109.2 2,281.6 1,571.7
31 817.8 1,922.6 1,428.2 1,876.2 2,486.7 2,260.7
32 1,531.4 1,443.8 1,113.3 2,418.0 2,074.9 1,897.9
IAC-100 2,036.5 - - 2,378.0 -
-In the combined analysis of variance (Table 3), significant differences (p ≤ 0.01) between locations were detected, which
are easily observed by the differences between the means of the populations and controls at both locations (Table 1).
The occurrence of significant differences (p ≤ 0.01) for
the treatment effect of three types of populations was also observed, as already noted in the individual analyses. The interactions of the crosses ( L1iand L2i ) and lines ( Pi ) with
locations were highly significant (p ≤ 0.01), showing that
the performance of crosses ( L1i and L2i ) and lines ( Pi ) was not consistent in both locations, indicating an already well-known fact: the occurrence of genotype x environment interaction, common in plant breeding. This fact is evident when comparing the means of the two locations (Table 2).
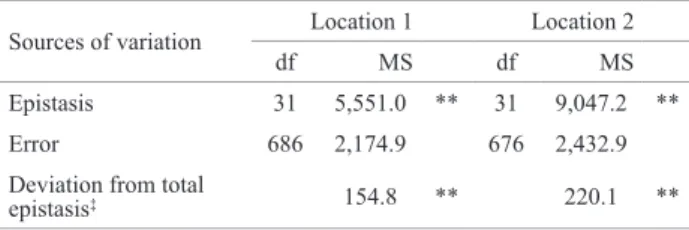
In the analysis of variance of epistasis (Table 4), signifi
-cant differences (p ≤ 0.01) were detected for GY, indicating
the occurrence of epistasis in the expression of this trait,
which was reinforced by the significance of the t test, which
tests the deviation of total epistasis. Therefore, results indicate that epistasis cannot be excluded from the model to estimate the genetic variance for GY in soybean (Jinks et al. 1969) or that the genetic variance for GY in soybean cannot be explained by only one additive-dominant model.
In the breeding of autogamous species, where the objec-tive is to obtain inbred lines, addiobjec-tive x addiobjec-tive epistasis
(i type) is possibly the most important because it is fixable
in homozygous genotypes, contributing to the superiority of elite lines (Cockerham 1954, Goldringer et al. 1997). In this study, highly homozygous lines were used, which al-lows the conclusion that the detected epistasis is additive x
additive (i type). Consequently, we suggest postponing the selection for grain yield to later generations of inbreeding (F5 or F6) in order to exploit the beneficial effects of addi -tive x addi-tive epistasis.
Studies on the genetic variation in soybean using inbred lines, segregating populations, molecular markers (QTL) and several genetic analysis models (generation means, scaling tests and diallel crosses), among others (Toledo et al. 2000, Gravina et al. 2004, Vollmann et al. 2005, and Primomo et al. 2005), showed that additive variance is the main component of genetic variation, with a contribution of 60 - 90% for most agronomic traits, but that a large propor-tion is attributed to additive x additive epistatic variance (i
type). According to Bernardo (2002), although the epistatic
variation is present, there are certain difficulties to sepa
-rate it from additive and dominance variation because it is smaller and the error associated with its estimation higher, compared to the error of additive and dominant variances.
The occurrence of epistasis for GY using the TTC or
Modified TTC designs has been reported for other species,
e.g., wheat (Ketata et al. 1976, Singh 1981), maize (Wolf and Hallauer 1997, Parvez et al. 2006), mung bean (Khattak et al. 2001, Khattak et al. 2002), cotton (Silva and Alves 1983, Bhatti et al. 2006), peanut (Upadhyaya and Nigam 1999), rice (Saleem et al. 2005, Subbsaraman and Ranagasamy
1989), flax (Sood et al. 2007), common bean (Moreto et
al. 2012), soybean (Barona et al. 2009), and Arabidopsis
thaliana (Kusterer et al. 2007). Interestingly, most of these studies were published in recent years.
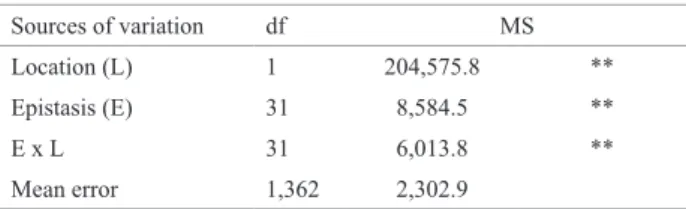
The effect of locations was significant (p ≤ 0.01), in
-dicating that the expression of GY depends on non-allelic interactions and that these two locations differed in the expression of epistasis (Table 5). Furthermore, epistasis
x environment interaction was significant (p ≤ 0.01) and
therefore the sensitivity or non-consistent performance of epistasis of the GY-related loci between locations. It is noteworthy that interactions with environments depend on the number of loci involved in the trait inheritance, i.e., the higher the number of involved loci, the greater the
possibil-ity of environmental influence on trait expression, which
Table 3. Combined analysis of variance (two locations) of grain yield (GY,
in g plot-1) in soybean. Modified Triple Test Cross design, assessed in two
10 x 10 triple lattice experiments, with nine replications
Sources of variation df MS
Locations (L) 1 1,532,940.0 **
Replications (R)/L 16 44.629.0 **
Blocks /R/L 162 6,053.3 **
Treatments (T) -
-Crosses (L1i) 31 12,680.0 **
Crosses (L2i) 31 6,058.1 **
Lines (Pi) 31 18,840.0 **
T x L -
-Crosses (L1i ) x L 31 5,344.2 **
Crosses (L2i) x L 31 3,423.3 **
Lines (Pi) x L 31 6,306.7 **
Mean intra-block error 1,362 2,302.9
General mean 173.62
** significant at p ≤ 0.01 by the F test.
soybean at two locations, according to a Modified Triple Test Cross design
Sources of variation Location 1 Location 2
df MS df MS
Epistasis 31 5,551.0 ** 31 9,047.2 **
Error 686 2,174.9 676 2,432.9
Deviation from total
epistasis‡ 154.8 ** 220.1 **
is characteristic of quantitative traits. Also, mechanisms involved in the expression of a complex trait such as GY may differ, according to the environment. Thus, if the loci that determine GY in soybean participate in adaptation and interact with the particular environment, then epistasis will be environmentally variable and this could therefore be a possible explanation for the strong epistasis × environment interaction detected in this study.
Changes in the relative magnitudes of the variance com-ponents (additive, dominant and epistatic) between different environments can occur if the loci that determine the trait have different sensitivities for the environments considered (Jinks and Perkins 1970). Goldringer et al. (1997) estimated the epistatic variance for GY in wheat in two years and found that the interaction of epistasis with years was more consistent than the interaction of additive variance with years. Upadhyaya and Nigam (1999) reported the presence of epistasis for yield in peanuts in several environments and also found that the epistasis x environment interaction was more pronounced than interactions of additive and dominant
effects with environments. Perkins and Jinks (1971) stated, for plant height in tobacco, that i type epistasis (additive x additive) is more sensitive to environmental effects than j
type epistasis (additive x dominant). Variations in the pat-tern of epistasis x environment interaction between different traits were also reported by Khattak et al. (2002).
Although there are few reports on the epistasis x location interaction using TTC, the surveysconducted in various crops suggest that the results obtained may change across years and locations because of epistasis x environment interactions and that a series of experiments would be required to improve
the efficiency of plant breeding procedures (Jinks et al. 1969,
Ketata et al. 1976, Tefera and Peat 1997, Sood et al. 2007). The results of this study therefore indicate that epistasis is present in yield expression in soybeans and, furthermore, that it interacts with environments, i.e., its expression is not consistent in different environments. Consequently, the genetic variance of this trait cannot be explained only by an additive-dominant model. In view of these facts, we suggest postponing the selection for grain yield to later generations of inbreeding as well as evaluating the inbred
lines across several environments, to exploit the beneficial
effect of additive x additive epistasis in each test environ-ment of soybean breeding programs.
ACKNOWLEDGEMENTS
The authors thank the CNPq for two doctoral fellow-ships (JM Colombari Filho and VS Santos) and a research fellowship (IO Geraldi).
Table 5. Combined analysis of variance (two locations) of epistasis for
grain yield (GY, in g plot-1) in soybean, according to a Modified Triple
Test Cross design
Sources of variation df MS
Location (L) 1 204,575.8 **
Epistasis (E) 31 8,584.5 **
E x L 31 6,013.8 **
Mean error 1,362 2,302.9
** significant at p ≤ 0.01 by the F test.
REFERENCES
Allard RW (1971) Princípios do melhoramento genético das plantas. Edgard Blucher, São Paulo, 381p.
Barona MAA, Colombari-Filho JM and Geraldi IO (2009) Epistasia para a produção de grãos em soja. Bragantia 68: 313-318.
Bateson W (1909) Mendel’s principles of heredity. Cambridge University Press, Cambridge, 396p.
Bernardo R (2002) Breeding for quantitative traits in plants. Stemma Press, Woodbury, 141p.
Bhatti M, Azhar FM, Albi AW and Ayub M (2006) Triple test cross analysis of seed cotton (Gossypium hirsutum L.) yield and its components grown in salinized conditions. International Journal of Agriculture and Biology 8: 820-823.
Cockerham CC (1954) An extension of the concept of partitioning hereditary variance for analysis of covariances among relatives when epistasis is present. Genetics 39: 859-882.
Efeitos epistáticos para produção de grãos em soja [
Glycine max
(L.) Merrill]
Resumo - Efeitos epistáticos não têm sido muito enfatizados em estudos envolvendo a estimação de parâmetros genéticos em soja. O presente trabalho teve por objetivo estimar a significância destes efeitos na produção de grãos para esta cultura utilizando-se o delineamento Triple Test Cross Modificado. Utilizaram-se 32 linhagens derivadas do cruzamento entre duas linhagens contrastantes, as quais foram cruzadas com dois testadores (L1 e L2). Os experimentos foram conduzidos em dois locais, em delineamentos em látice triplo 10 x 10 com nove repetições, contendo 32 linhagens (Pi), 64 cruzamentos (32 Pi x L1 e 32 Pi x L2) e testemunhas. A variação entre (L1i + L2i - Pi) revelou a presença de epistasia, bem como a ocorrência de interação epistasia x locais. Como em espécies au -tógamas o componente predominante de epistasia é aditiva x aditiva (tipo i), recomenda-se que a seleção para a produção de grãos seja feita em gerações mais avançadas de endogamia, para capitalizar os efeitos positivos deste tipo de epistasia.
distâncias genéticas moleculares para a produção de grãos em soja. Ciência e Agrotecnologia 34: 940-945.
Fisher RA (1984) The correlation between relatives on the supposition of mendelian inheritance. In Hill WG (ed.) Quantitative genetics. Part I. Explanation and analysis of continuous variation. Van Nostrand Reinhold, New York, p. 58-92.
Goldringer I, Brabant P and Gallais A (1997) Estimation of additive and epistatic genetic variances for agronomic traits in a population of doubled haploid lines of wheat. Heredity 79: 60-71.
Gravina GA, Filho SM, Sediyama CS and Cruz CD (2004) Parâmetros genéticos da resistência da soja a Cercospora sojina. Pesquisa Agropecuária Brasileira 39: 653-659.
Jinks JL and Perkins JM (1970) Detection and estimation of genotype environmental, linkage and epistatic components of variation for a metrical trait. Heredity 25: 157-177.
Jinks JL, Perkins JM and Breeze EL (1969) A general method of detecting additive, dominance and epistatic components of variation for metrical traits: II. Application to inbred lines. Heredity 24: 45-57.
Kearsey MJ and Jinks JL (1968) A general method of detecting additive, dominance and epistatic variation for metric traits: I. Theory. Heredity 23: 403-409.
Ketata H, Smith EL, Edwards LH and McNew RW (1976) Detection of epistatic, additive and dominance variation in winter wheat (Triticum
aestivum L). Crop Science 16: 1-4.
Khattak GS, Haq MA, Ashraf MA and McNeilly T (2001) Genetic basis of variation of yield and yield components in mungbean (Vigna radiate
(L.) Wilczek). Hereditas 134: 211-217.
Khattak GS, Haq MA, Ashraf MA, Khan AJ and Zamir R (2002) Genetic architecture of secondary yield components in mungbean (Vigna
radiate (L.) Wilczek). Breeding Science 52: 235-241.
Kusterer B, Muminovic J, Utz HF, Piepho HP, Barth S, Heckenberger M, Meyer RC, Altmann T and Melchinger AE (2007) Analysis of a triple testcross design with recombinant inbred lines reveals a significant role of epistasis in heterosis for biomass-related traits in Arabidopsis. Genetics 175: 2009-2017.
Mather K (1949). Biometrical genetics. Methuen and Co., London, 162p.
Moreto AL, Ramalho MAP and Bruzzi AT (2012) Epistasis in and Andean by Mesoamerican cross of common bean. Euphytica 186: 755-760.
Parvez A, Rather AG and Venkatesh S (2006) Triple test cross analysis for
Pakistan Journal of Biological Sciences 9: 1983-1986.
Perkins JM and Jinks JL (1971) Analysis of genotype x environment interaction in triple test cross data. Heredity 26: 203-209.
Primomo VS, Poysa V, Ablett G, Chung-Ja J, Gijzen M and Rajcan I (2005) Mapping QTL for individual and total isoflavone content in soybean seeds. Crop Science 45: 2454-2464.
Ramalho MAP, Santos JB and Pinto CA (2000) Genética na agropecuária. Editora UFLA, Lavras, 404p.
Saleem MY, Atta BM, Cheema AA, Mukhtar Z and Haq MA (2005) Detection of epistasis and estimation of additive and dominance components of genetic variation using triple test cross analysis in rice
(Oryza sativa L.). Caderno de Pesquisa série Biologia 17: 37-50.
Silva FP and Alves JF (1983) Estimation of epistatic, additive and dominance variation in cotton (Gossypium hirsutum L. r. latifolium Hutch). Revista Brasileira de Genética 3: 491-504.
Singh S (1981) Single tester triple test cross analysis in spring wheat. Theoretical and Applied Genetics 59: 247-249.
Sood S, Kalia NR, Bhateria S and Kumar S (2007) Detection of genetic components of variation for some biometrical traits in Linum
usitatissimum L. in sub-mountain Himalaya region. Euphytica 155:
107-115.
Subbsaraman N and Ranagasamy SR (1989) Triple test cross analysis in rice. Euphytica 42: 35-40.
Tefera H and Peat WE (1997) Genetics of grain yield and other agronomic characters in t’ef (Eragrostis tef Zucc. Trotter). II. The triple test cross. Euphytica 96: 193-202.
Toledo JF, Arias CA, Oliveira M, Triller C and Miranda Z (2000) Genetical and environmental analyses of yield in six biparental soybean crosses. Pesquisa Agropecuária Brasileira 35: 1783-1796.
Upadhyaya HD and Nigam SN (1999) Detection of epistasis for protein and oil contents and oil quality parameters in peanut. Crop Science 39: 115-118.
Vollmann J, Pokeprasert A, Stift G and Lelley T (2005) Epistatic gene interaction in QTLs of soybean seed characters. In 2005 Annual Meeting A.S.A. American Society of Agronomy, Salt Lake City. Available at <http://crops.confex.com/crops/2005am/techprogram/ P7201.HTM> Accessed on Dec 11, 2012.