Estimation of genetic parameters and selection of
Brachiaria
humidicola
progenies using a selection index
Ulisses José de Figueiredo1*, José Airton Rodrigues Nunes1 and Cacilda Borges do Valle2
Received 24 August 2011
Accepted 29 May 2012
Abstract –The objectives of this study were to estimate genetic parameters for agronomic and nutritive value traits for leaves and stems of Brachiaria humidicola progenies and to compare the selection using an additive index considering the agronomic traits alone or combined with the main nutritive value traits. Fifty progenies of the cross cv. BRS Tupi x H31 were evaluated. The experiment was arranged in a randomized block design with eight replications. The forage was cut seven times, at intervals of 30 - 35 days in the
rainy season and two intervals of 60 days in the dry season. Trait variability among the progenies was confirmed. The mean progeny
heritability ranged from 49.14% to 75.56% for the agronomic and from 19.59% to 71.11% for nutritive value traits. Nine of the ten best lines coincided in the selection for agronomic traits alone and in the selection including the main traits of nutritive value.
Key words: Correlation, heritability, repeatability, genetic value, nutritive value.
1 Universidade Federal de Lavras (UFLA), C.P. 3037, 37.200-000, Lavras, MG, Brazil. *E-mail: [email protected] 2 Embrapa Gado de Corte, C. P. 154, 79.002-970, Campo Grande, MS, Brazil
INTRODUCTION
In Brazil, the feeding of ruminant animals is based on pasture, and on approximately 50% of the area of planted
pastures, species of the genus Brachiaria are grown (Macedo
2009). The breeding of these forage species is therefore
economically relevant.
In Brachiaria species, one of the target traits for im-provement is the total dry matter yield and traits related
to the proportion of leaf blades. This plant component is preferred by cattle and has a higher nutritive value than the stem component (Baroni et al. 2010), aside from being an important factor in the prediction of forage intake by cattle
(Rego et al. 2006).
Among the species of the genus Brachiaria, B. humidicola
(Syn. Urochloa humidicola) has a particular ability to grow
on poorly drained, acidic soils (Keller-Grein et al. 1996). B. humidicola has a lower nutritive value than the other species of the genus Brachiaria (Valle et al. 2009). This limitation
could be overcome by breeding. Furthermore, other traits
such as total dry matter (TDM) yield and seed dormancy
could also be improved (Euclides et al. 2010). The in situ
digestibility of neutral detergent fiber of the stem and dry
matter digestibility of the whole plant of B. brizantha were
higher than that of B. humidicola (Brito et al. 2003). These authors also reported a higher crude protein content of B. brizantha compared to B. humidicola.
One noteworthy aspect to ensure success in the breeding of a species is the availability of information on the genetic
variability of traits of interest. Thus, the estimation of ge
-netic parameters such as heritability, repeatability, ge-netic correlations between traits and genetic interactions with
the cuts in the case of forage are important as orientation
in breeding programs for genetic gain (Cruz and Carneiro
2006). For the species B. humidicola, the information in the literature on genetic and phenotypic parameters is scarce.
A priority in forage plant selection is to identify genotype
combinations with favorable phenotypic performance for several
characters, particularly yield and nutritional-value related traits.
Methods of simultaneous trait selection, e.g., based on selection
indices, are therefore an attractive alternative (Bernardo 2010),
mainly because implementation and interpretation are easier,
compared to the multivariate-analysis methods.
The purpose of this study was to estimate genetic param-eters of traits of agronomic interest and the nutritive value of Crop Breeding and Applied Biotechnology 12: 237-244, 2012
Brazilian Society of Plant Breeding. Printed in Brazil
leaf and stem of progenies of the forage species B. humidicola,
evaluated in nine harvest cuts. Moreover, the objective was to compare the selection of the best progenies firstly based on agronomic traits alone and then in combination with the
main nutritive-value traits, using an additive selection index.
MATERIAL AND METHODS
The experiment was carried out at Embrapa Beef Cattle (lat 20° 27’ S, long 54° 37’ W and alt 530 m asl), in Campo Grande, MS. The soil type is an Alic Oxisol. According to the Köppen classification, the climate is tropical rainy, subtype AW, characterized by a well-defined dry season in
the colder and a rainy season in the warmer months. The average annual temperature is 23 °C.
The genetic treatments consisted of 50 full-sib progenies
of B. humidicola and their parents, cv. BRS-Tupi (apomictic
cultivar) and H31 (sexual accession), both hexaploid (2n = 6x = 36). These progenies had been selected from among 364 progenies of the above biparental cross, in a preliminary
assessment for qualitative characteristics of vigor, foliage
density and abundant flowering. Of the selected progenies,
29 were apomictic and 21 sexual.
The experiment was initiated in January 2007, with
52 treatments of vegetatively propagated seedlings, in a randomized block design with eight replications. Each
plot consisted of three plants spaced 1.0 m apart and rows spaced 1.0 m apart, covering an area 3.0 m2, of which 1.0 m2 was separated to assess seed production, resulting in an evaluation area of 2.0 m2 per plot. Pensacola bahiagrass was
planted along the borders, surrounding the plots.
The grass on the plots was cut nine times at about 10 cm from the ground, at regrowth intervals of 30-35
days in the rainy season and intervals of 60 days in the dry season. At cutting, the grass had grown to a height of
about 30 cm. Of these cuts, seven occurred in the rainy season (11/27/2007, 01/21/2008, 02/25/2008, 10/08/2008,
12/09/2008, 01/28/2009, and 04/02/2009), and two in the dry season (04/23/2008 and 07/12/2010).
At each cut, five agronomic traits were evaluated. The
total dry matter yield (TDM, kg ha-1) was estimated from the green matter yield and dry matter percentage. The leaves, stems and dead material were morphologically separated
in four of eight replications and based on the weight of the components, the leaf percentage was determined (%L), as well as the leaf: stem ratio (LSR). The leaf dry matter (LDM,
kg ha-1) yield was also determined from the TDM and % L. Care was taken to use always the same four replications for the sampling for morphological separation in all cuts.
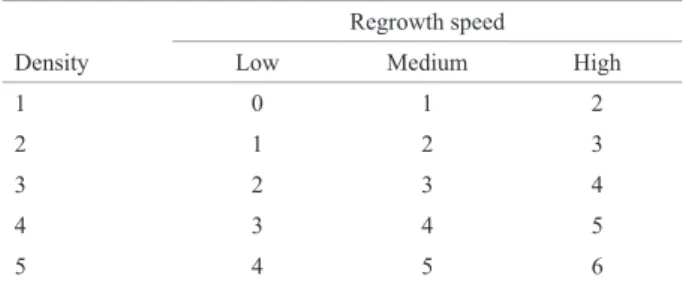
The ability of regrowth of the progenies was scored seven days after each cut, based on the combination of density (score 1: less than 20% of regrown tillers, 2: 20%
- 40%, 3: 40% - 60%, 4: 60 - 80%, and 5: more than 80%)
and rate of tiller regrowth (low, medium and high height
growth) (Table 1). As expected, regrowth could not be
evaluated after the two harvest cuts in the dry season, be
-cause seven days after the cuts, there was not enough volume for a sound comparison of the progenies.
Dried and ground samples of leaf and stem cuttings were analyzed separately for their nutritive value, using
near infrared spectroscopy (NIRS) (Marten et al. 1985).
The following nutritive-value traits were assessed on a dry
matter basis: crude protein (CP), in vitro organic matter
digestibility (IVOMD), neutral detergent fiber (NDF), acid detergent fiber (ADF) and lignin contents (Lig).
The data were processed using a mixed model approach
and software SELEGEN REML/BLUP (Resende 2007a). Since each trait was evaluated in several cuts per plot, firstly one analysis per harvest cut was run. Subsequently, based on the heterogeneity of residual variances evidenced by the variation of estimates of the individual heritabilities per cut, the phenotypic data were standardized by multiplying the data
of each trait in each cut by the expression (Resende
et al. 2008), in which h²ik is the plant heritability for trait i in cut k and h²i the average plant heritability of k cuts for trait i.
With the standardized data, combined analysis was
performed, considering all cuts, according to the following statistical model:
yp= Xm + Zg + Wp + Ti + e
where:
yp: vector of standardized data; m: vector of the combined effects
of cut-replication (fixed) added to the overall average; g: vector of
genotypic effects of the progenies (random), where g ~ NMV (0, Isg2),
sg2 is the genotypic variance associated with the progeny effects; p:
vector of permanent environmental effects or plots (random), where p ~ NMV (0, I sp2), s
p
2 is the variance associated with the plot effects; i:
vector of the effects of the genotype x cut interaction (random), where i ~ NMV (0, Isgc2 ), s
gc
2 is the variance component associated with the
effects of the genotype x cut interaction; e: vector of random errors, where e ~ NMV (0, I sp2 ) and X, Z, W and T: incidence matrices for
m, g, p and i, respectively.
Table 1. Regrowth scores estimated by combining the scores of density
and speed of regrowth
Regrowth speed
Density Low Medium High
1 0 1 2
2 1 2 3
3 2 3 4
4 3 4 5
The variance components and prediction of random ef-fects, especially those of genotypic values associated with
the progenies, were estimated by REML/BLUP (restricted maximum likelihood / best linear unbiased prediction) (Resende 2002, 2007b).
The experimental precision was assessed by estimating the accuracy, as proposed by Resende and Duarte (2007). In
addition, the following genetic parameters were estimated:
heritability of the progeny mean ( hm
2 ), genetic correlations of genotypes across the cuts (rgc), average repeatability of the cuts (rm), coefficient of determination (R2), and gain with
selection for each trait based on the predicted genotypic values of the 10 best progenies.
To investigate the association between the traits, the
genetic correlation (rG(x,y)) among traits was estimated by
the equation (Bernardo 2010): ,
where: is the covariance between traits x and y; and : estimates of genetic variance among progenies for the traits x and y. The procedure described by Holland (2006) was used to calculate the standard errors associated with genotype correlations, where a standard error of at least
50% below the estimate (statistic t ≅ 2) was considered
significant (P <0.05) (Steel et al. 1997).
In the selection for genetic improvement and gain for multiple traits simultaneously, in the rainy and dry seasons,
the following additive index was adopted (Resende 2007b):
, where: Ij: index value associated with progeny j; : predicted genotypic value of progeny j for trait i; wi : proportional importance or presumed economic weight associated with trait and : estimated genotypic standard deviation for trait i.
Initially, the 10 best progenies were selected considering
equal economic weights among agronomic traits (Index 1). Later, in addition to agronomic traits, the following traits of nutritive value were used: crude protein, neutral
detergent fiber and in vitro digestibility of leaf organic
matter, composing the second index (Index 2), i.e., to select
progenies with not only higher yields but also enhanced
nutritional value. The economic weights assigned in the second index were 0.14 for each agronomic and 0.10 for each nutritive-value trait, so that the weight of the
ag-ronomic traits was 70% and of the nutritive-value traits 30%. Based on the progeny ranking by these indices, the gain with selection by the predicted genotypic values was
estimated for each trait.
The best progenies selected by the indices were plotted on a polar graph, as proposed by Nunes et al. (2005). For this purpose, standardized breeding values were obtained
from the genotypic values of the progenies for each trait
by the expression:
,
where zij is the standardized genetic value of progeny j for trait i and is the estimate of genotypic variance for trait i.
RESULTS AND DISCUSSION
In the separate analyses for each cut, significant variation
was detected in the values of individual heritabilities ( ) of
the traits assessed (data not shown). According to Resende
(2007b), this shows the presence of heterogeneity of the
variances or otherwise, varied accuracy in the evaluation of the progenies depending on the cut. In this case, the data
for each cut were weighted by the ratio of the square root
of estimated at the cut and the square root of the mean in the various cuts for each trait, as described by
Resende (2007b). According to Resende et al. (2008), this data transformation prior to combined analysis is desirable,
since, in the REML/BLUP-predicted genotypic values in
the combined analysis, the data of all harvest cuts will be weighted by an average heritability of all cuts.
Selection based on all cuts was favorable, because the
accuracy for most traits was above 67% (Table 2), a con
-dition classified as high experimental precision (Resende
and Duarte 2007). Another important aspect in this context is the fact that the estimate of genotypic variance ( ) in
progenies was significantly non-zero (P<0.05) for all agro
-nomic traits (Table 2), indicating the existence of genetic variability and the possibility of gain with selection. This information was confirmed by the range of variation of the
predicted genotypic values of progenies in relation to the
mean from 21.5% to 74.6% among traits (Table 2). For the
nutritive-value traits, was significantly non-zero (P<0.05),
except for stem crude protein (stCP) (P>0.05) (Table 2). Genetic variability for nutritive value was less significant
than for agronomic traits, since the range of variation of the
genotypic values was smaller (2.11% - 14.11%) (Table 2).
Estimates of heritability in the progeny mean ( ) were
above 59% for the traits TDM,% L, LDM and Regrowth (Table 2), indicating a greater chance of selecting progenies
genotypically superior for these agronomic traits, while
for LSR, the greatest fraction of phenotypic variation was
caused by environmental variation. Similar values were
reported for the traits LDM, F% and regrowth for accessions
were found ranging from 64% to 97% for LDM; 73% to 96% for %L and 43% to 92% for regrowth. Resende et al.
(2007) found a for TDM of 42% for the dry and 54% for the rainy season, in the evaluation of Brachiaria hybrids.
The nutritive-value traits lCP, NDFl, IVOMDl, ADFst and LIGst also had values above 59% (Table 2). In an evaluation of B. brizantha hybrids of 30% was observed for the in vitro dry matter digestibility of leaves and 36% for
stems (Senanayake 1994). From the standpoint of selection,
the nutritive-value traits of leaves: lCP, NDFl and IVOMDl
proved interesting, since most of the observed phenotypic variation in these traits had a substantially genetic nature and could be combined with the agronomic traits. This
would allow for the selection of progenies with a higher proportion of leaves and increased nutritive value.
In forage plants, several measurements must be carried out on the same plot. The possible occurrence of a genotype x cut interaction should therefore be verified. The variance of the genotype x cut interaction was significant (P<0.05)
for agronomic and nutritive-value traits, except for stem
lignin (LIGst) (Table 2). The presence of this interaction
indicates that the performance of the progenies was not consistent across the cuts for these characters. A similar
result was observed by Lédo et al. (2008) in an evaluation
of 23 genotypes of Panicum maximum and of 17 clones of Pennisetum purpureum Schum by Daher et al. (2004).
Another parameter that is directly related to the effect and nature of the progeny x cut interaction is the genotypic
correlation between cuts. The values of the estimates of
genotypic correlations between cuts (rgc) were moderate
to low (Table 2), ranging from 0.2225 (LSR) to 0.5276
(regrowth) for agronomic traits and from 0.1376 (stCP) to
0.6816 (LIGst), for the nutritive-value traits, confirming
the presence of progeny x cut interaction for most traits. This fact reinforces the importance of estimating the
repeat-ability for the different traits in different measures (cuts), to increase the reliability of selection.
The repeatability coefficients based on the averages of
cuts (rm) for agronomic traits ranged from 0.6089 (LSR) to
0.8094 (Regrowth) (Table 2). These values are considered high for the parameter repeatability (Resende 2002). Souza Sobrinho et al. (2010) found lower values for TDM in seven
cuts of B. ruziziensis half-sib progenies. Martuscello et al. (2007) evaluated Panicum maximum progenies and found
similar values for LDM and % L, and lower results for TDM.
These high rm values for all traits indicate the possibility of selecting progenies that provided a maximum forage yield in the two years it took to complete the nine cuts.
Table 2. Estimates of the genotypic variance ( g
2), variance of the interaction genotype x cuts ( gc
2), the mean progeny heritability (h m
2), genotypic
correlations between cuts (rgc ) accuracy (Acc), mean repeatability of the cuts (rm), coefficient of determination (R
2), general mean ( ) and amplitude
of variation (A) for the agronomic and the nutritive-value traits based on the evaluation of Brachiaria humidicola progenies in nine harvest cuts
Traits g 2
gc
2 h
m
2 r
gc Acc rm R
2 A#
TDM 17978.0853* 20480.9185* 69.11* 0.4675* 83.13 0.8021 0.9746 1125.90 39.60
%L 9.1827* 19.6160* 68.32* 0.3189* 82.65 0.7280 0.9601 50.51 21.60
LDM 4985.1441* 8041.0810* 59.17* 0.3827* 76.92 0.7805 0.9697 507.15 45.40
LSR 0.2244* 0.7842* 49.14* 0.2225* 70.10 0.6089 0.9334 2.05 74.60 Regrowth 0.0582* 0.0521* 75.56* 0.5276* 86.93 0.8094 0.9745 2.87 30.00
lCP 0.1057* 0.0963* 66.46* 0.5235* 81.52 0.7107 0.9567 9.03 13.47
NDFf 0.4578* 0.3953* 71.11* 0.5367* 84.33 0.6824 0.9508 65.44 3.98
ADFl 0.0793* 0.1940* 46.05* 0.2902* 67.86 0.4703 0.8888 34.41 2.63 IVOMDl 1.8165* 1.9891* 63.93* 0.4773* 79.96 0.6659 0.9472 56.24 7.61 LIGl 0.0029* 0.0119* 35.29* 0.1964* 59.41 0.2990 0.7933 2.55 6.24 stCP 0.0122 0.0764* 19.59 0.1376 44.26 0.2320 0.7311 6.22 3.05 NDFst 0.2667* 0.3970* 54.96* 0.4018* 74.14 0.5174 0.9061 71.73 2.11 ADFst 0.3143* 0.4599* 59.88* 0.4059* 77.38 0.5566 0.9187 42.90 4.22 IVOMDst 0.6976* 1.7942* 37.50* 0.2800* 61.24 0.4057 0.8600 49.52 4.54 LIGst 0.0249* 0.0116 69.23* 0.6816* 83.20 0.6652 0.9470 3.85 14.11
TDM: total dry matter yield (kg ha-1);% L: percentage of leaves; LDM: leaf dry matter yield (kg ha-1); LSR: leaf: stem ratio; Regrowth: regrowth score; lCP: leaf crude
protein (% DM), NDFl: neutral detergent fiber of leaves (DM%); ADFl: acid detergent fiber of leaves (DM%); IVOMDl: in vitro organic matter digestibility of leaves (%); LIGl : leaf lignin (% DM), stCP: stem crude protein (% DM); NDFst: neutral detergent fiber of stems (% DM); ADFst: acid detergent fiber of stems (% DM); IVOMDst: in vitro organic matter digestibility of stems (%); LIGst: lignin in the stems (% DM).
* Significant by the χ 2 test, at 5% probability
For the traits lCP, NDFl, IVOMDl, and LIGst, coeffi -cients of rm > 60% were also observed, and low to medium
rm for the other nutritive-value traits (Table 2). Ferreira et
al. (1999) performed three harvests of alfalfa cultivars in two seasons and found lower rm for lCP, with estimates ranging from 0.2730 to 0.4189, however, for stCP, the rm
ranged from 0.1348 to 0.3508, i.e., thus similar to the rm
obtained in this study.
In addition to the repeatability estimated based on the
cuts, the coefficients of genotypic determination (R2) (Table
2) represent the accuracy with which the real genotypic value
is being estimated. The R2 values were high (> 85%), with
the exception of LIGl and stCP. Therefore, these values are
considered suitable for selection of improved genotypes (Re
-sende 2002). Thus, the best apomictic progenies can be safely selected for evaluation in the Brazilian test network, to be
released as new cultivars with improved agronomic as well as
key nutritive-value traits of leaf and stem, especially because
this analysis considered cuts in the rainy and dry seasons. The
best sexual progenies are candidates for recombination, as
mother plants in recurrent selection for this species. In the context of simultaneous selection for several traits,
knowledge about trait correlations is essential, especially with regard to the genetic correlation, since it reflects the possibility of an indirect selection and therefore the response
correlated with selection. The reason is that the correlation
may be caused by the action of pleiotropic and/or closely
linked genes that affect the traits under study (Falconer and Mackay 1996).
Among the agronomic traits, the genotype correlations were high and positive for the pairs LDM-TDM,
TDM-Regrowth and LDM-TDM-Regrowth (r = 0.93 ± 0.03, 0.97 ± 0.06 and 0.91 ± 0.08, respectively). This indicates a favorable
condition for the selection of high-yielding genotypes with improved regrowth and with the advantage of a high leaf dry matter in the total dry matter yield. This result is interesting since parallel to the selection for high yields, genotypes
with higher regrowth are selected, which are capable of
increasing the pasture carrying capacity and have high LDM.
Basso et al. (2009) observed that the %L should be
considered in multi-trait selection, in view of the low ge-notypic correlation with TDM and LDM. In this study, we
observed an average value of the correlation of %L with TDM (0.49 ± 0.15) and zero (0.36 ± 0.19) with the LSR. These findings confirm the inclusion of this trait (%L) in the
selection index together with the forage TDM for selection
of desirable B. humidicola genotypes.
Considering the genotypic correlations between agro
-nomic and nutritive traits of leaf and stem, there were a few
highly correlated and significantly non-zero pairs (P <0.05),
for example: TDM-stCP (-0.78), %L-lCP (-0.89), LDM-lCP (-0.70), LDM-ADFl (0.68), LDM-stCP (-0.78) and LSR-lCP (-0.76) and others with median values, e.g., TDM-lCP (-0.45), TDM-ADFl (0.47), %L-ADFl% (0.51), %L-NDFst (-0.49), %L-LIGst (-0.58), LSR-NDFl (0.44), Regrowth-lCP (-0.40),
Regrowth-ADFl (0.44) and Regrowth-NDFst (-0.55). Interest
-ing in this context are the negative correlations between LDM
and TDM with stCP and lCP, demonstrating that the
pheno-typic expression of these traits was influenced by pleiotropic and/or linked genes, but acting in opposite directions. Thus,
selection for higher yield will result in genotypes with lower
levels of crude protein, which is undesirable. Reyes-Purata et al. (2009) observed a negative phenotypic correlation between dry matter yield and crude protein when evaluating
21 B. humidicola genotypes. These authors reported that in higher-yielding genotypes, the crude protein contents tend
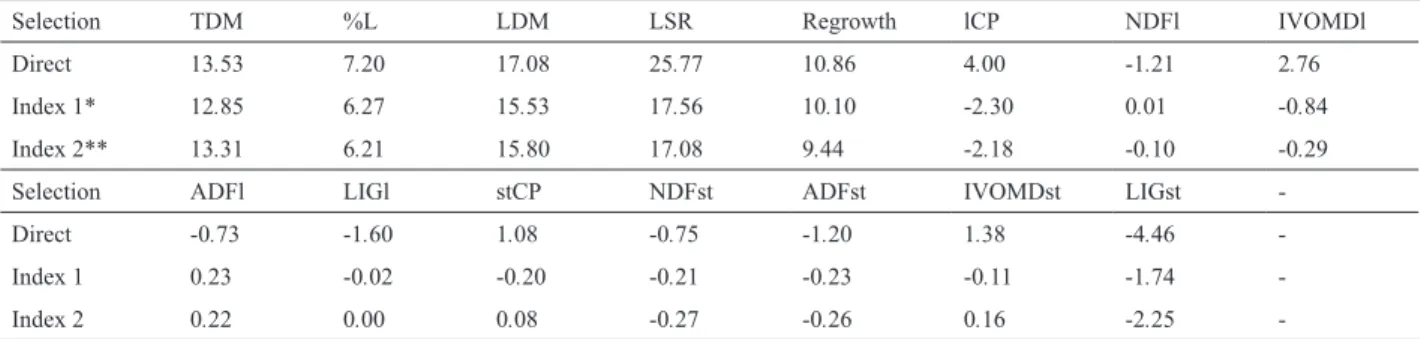
to decrease while those of neutral detergent fiber increase. Using REML/BLUP, the selection gains (SG) can be obtained directly from the BLUP predictions of the progenies, since these reflect the estimated genotypic values already adjusted to the fixed environmental effects. In percentages, the direct SG ranged from 7.20% (%L) to 25.77% (LSR)
among agronomic traits; for the nutritive value traits, the
variation was -4.46 % (LIGst) to 4.00% (lCP), based on the selection of the best 10 progenies (Table 3). It was observed that the SGs for the nutritive traits were lower than for the agronomic traits, but although lower, the gain was positive (Table 3). High direct gains from selection for LDM (17.08)
indicate the great potential of improvement expected for this trait in unimproved species.
In the B. humidicola improvement program, the best
progenies must be selected considering good performance for a number of breeding target traits, so the use of a
selection index is a promising method for simultaneous
selection. The SG for the first index, which only involved agronomic traits with equal weight values, was 10.93%. For the second index, with agronomic traits worth 70% of the
total value and for the traits lCP, NDFl and IVOMDl with
equal weights worth 30%, the SG was 14.96% (Table 3). The SG of progenies based on the indices 1 and 2 for the characters TDM, %L, LDM and regrowth were similar to the respective direct gains, however for LSR, the gain was 70% lower when compared to the direct selection. For the
traits lCP and IVOMDl, gains were negative, and for NDFl,
the gain was virtually zero for both indices (Table 3). These results were confirmed by the coincidence in selection by
the two proposed indices, of nine out of the ten progenies, of which six are apomictic and four are sexual progenies.
The absence of gains in the desired direction for the traits
lCP and IVOMDl was explained by the negative genetic as
the negative genetic correlation does not necessarily imply
that progenies combining good agronomic performance and nutritive value cannot be obtained. Since this correlation is determined by the action of linked genes, success in simultaneous selection could be achieved by evaluating a larger number of progenies to raise the chances of finding promising recombinant genotypes within the population.
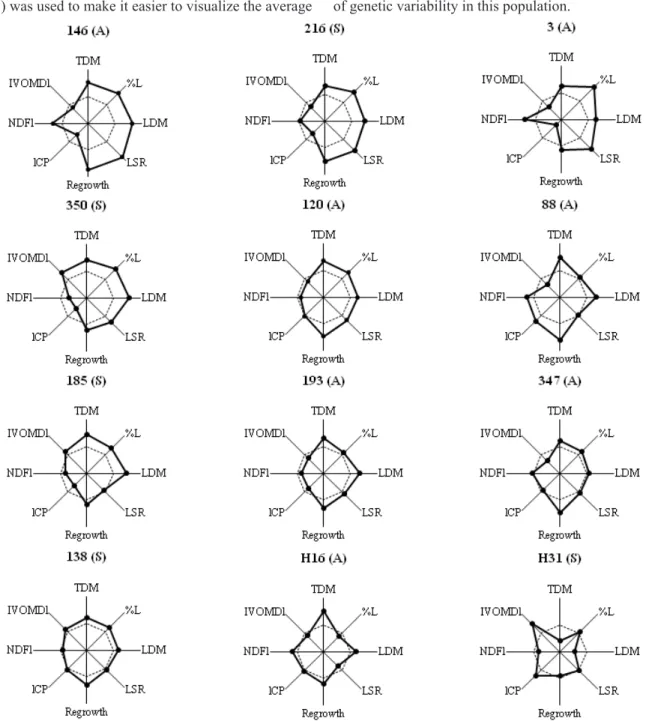
A graphical presentation as proposed by Nunes et al. (2005) was used to make it easier to visualize the average
performance of the progenies selected for the evaluated
traits based on the selection index. The performance of the sexual accession (H31) was below average for all agronomic traits, but superior for lCP, and NDFl and IVOMDl, which
are very important to improve the nutritive value (Figure 1). The male parent (H16) on the other hand stood out with
above-average performance, especially for TDM, LDM and
Regrowth. This complementarity of the parents generated
high variability among the progenies, indicating the potential of genetic variability in this population.
It was shown that for the nutritive-value traits lCP, NDFl and IVOMDl, the performance of most progenies, such as of 146, 216 and 3, was not as good as for the agronomic traits (Figure 1). However, the performance of the selected
progenies (apomictic 120 and 193 and sexual 138 and 350) was better for most traits. It is worth remembering that progenies with lower contents are desirable for the trait neutral detergent fiber, since higher levels would slow down
forage digestion.
From the above, it appears that the genetic variability
among progenies was higher for the agronomic traits than for those related to the nutritive value. In the early stages,
breeding programs for the species B. humidicola should
therefore focus on the agronomic traits, evaluating the nutri-tive value in later stages. In addition, pasture management
practices can contribute significantly to improve the nutritive value of forage, for example, by determining the time when
the animals should start grazing so that the nutritive value
of the plant is maximal (Da Silva and Nascimento Júnior
2007). The use of additive selection indices together with the graphic representation allowed a clear visualization of
the performance of the progenies combining the agronomic and nutritive value traits, allowing for a better selection of
the most promising progenies.
ACKNOWLEDGEMENTS
The authors thank the “Associação para o Fomento à Pesquisa de Melhoramento de Forrageiras Tropicais” -
UNIPASTO and the Foundation for the Development of Education, Science and Technology of the State of Mato Grosso do Sul - FUNDECT for financial support, Embrapa
Beef Cattle for the opportunity to carry out this research and
the Brazilian Federal Agency for Support and Evaluation of Graduate Education - CAPES for granting a scholarship. Nam volorem aliquas eaque perum facessi bea cum explacea
Table 3. Estimates of genetic gains for selection (%) based on direct selection and selection indices 1 and 2, for the agronomic and the nutritive-value traits of the 10 best progenies
Selection TDM %L LDM LSR Regrowth lCP NDFl IVOMDl
Direct 13.53 7.20 17.08 25.77 10.86 4.00 -1.21 2.76 Index 1* 12.85 6.27 15.53 17.56 10.10 -2.30 0.01 -0.84 Index 2** 13.31 6.21 15.80 17.08 9.44 -2.18 -0.10 -0.29
Selection ADFl LIGl stCP NDFst ADFst IVOMDst LIGst
-Direct -0.73 -1.60 1.08 -0.75 -1.20 1.38 -4.46 -Index 1 0.23 -0.02 -0.20 -0.21 -0.23 -0.11 -1.74 -Index 2 0.22 0.00 0.08 -0.27 -0.26 0.16 -2.25
-TDM: total dry matter yield (kg ha-1);% L: percentage of leaves; LDM: leaf dry matter yield (kg ha-1); LSR: leaf: stem ratio; Regrowth: regrowth score; lCP: leaf crude
protein (% DM), NDFl: neutral detergent fiber of leaves (DM%); ADFl: acid detergent fiber of leaves (DM%); IVOMDl: in vitro organic matter digestibility of leaves (%); LIGl : leaf lignin (% DM), stCP: stem crude protein (% DM); NDFst: neutral detergent fiber of stems (% DM); ADFst: acid detergent fiber of stems (% DM); IVOMDst: in vitro organic matter digestibility of stems (%); LIGst: lignin in the stems (% DM).
* based on equal weight values of the five agronomic traits
** considering economic weights proportional to 70% for five agronomic traits and 30% for the nutritive-value traits: crude protein, neutral detergent fiber and in vitro organic matter digestibility of leaves
Estimação de parâmetros genéticos e seleção de progênies de
Brachiaria
humidicola
via índice de seleção
Resumo –Objetivou-se obter parâmetros genéticos para caracteres agronômicos e de valor nutritivo da folha e do colmo de progênies de Brachiaria humidicola e comparar a seleção das melhores por um índice de seleção aditivo considerando-se apenas os caracteres agronômicos e em conjunto com os principais de valor nutritivo. Avaliaram-se 50 progênies do cruzamento cv. BRS Tupi x H31. O delineamento foi em blocos ao acaso com oito repetições. Foram realizados sete cortes em intervalos de 30 a 35 dias no período de chuvas e dois com intervalos de 60 dias no período seco. Observou-se variabilidade genética entre progênies para os caracteres. As herdabilidades médias de progênies variaram de 49,14% a 75,56% para caracteres agronômicos e de 19,59% a 71,11%, para os de valor nutritivo. Houve coincidência de nove das dez melhores progênies quando se usou o índice para somente os caracteres agronômicos ou conjuntamente com os principais caracteres de valor nutritivo.
REFERENCES
Baroni CES, Lana RP, Mancio AB, Queiroz AC, Sverzut CB and Mendonça
BPC (2010) Desempenho de novilhos suplementados e terminados em pasto, na seca, e avaliação do pasto. Arquivo Brasileiro de Medicina Veterinária e Zootecnia 62: 373-381.
Basso KC, Resende RMS, Valle CB, Gonçalves MC and Lempp B (2009)
Avaliação de acessos de Brachiaria brizantha Stapf e estimativas
de parâmetros genéticos para caracteres agronômicos. Acta Scientiarum. Agronomy31: 17-22.
Bernardo R (2010) Breeding for quantitative traits in plants. Stemma, Woodbury, 400p.
Brito CJF, Rodella RA and Deschamps FC (2003) Perfil químico da parede celular e suas implicações na digestibilidade de Brachiaria brizantha e Brachiaria humidicola. Revista Brasileira de Zootecnia 32: 1835-1844.
Cruz CD and Carneiro PCS (2006) Modelos biométricos aplicados ao melhoramento genético. Editora UFV, Viçosa, 585p.
Daher RF, Maldonado H, Pereira AV, Junior ATDA, Pereira MG, Ferreira
CF, Ramos SRR, Tardin FD and Silva MP (2004) Estimativas de parâmetros genéticos e de coeficientes de repetibilidade de caracteres
forrageiros em clones de capim-elefante (Pennisetum purpureum Schum.). Acta Scientiarum. Agronomy 26: 483-490.
Da Silva CS and Nascimento Júnior D (2007) Avanços na pesquisa com plantas forrageiras tropicais em pastagens: características
morfofisiológicas e manejo do pastejo. Revista Brasileira de Zootecnia36: 121-138.
Euclides VPB, Valle CB, Macedo MCM, Almeida RG, Montagner DB
and Barbosa RA (2010) Brazilian scientific progress in pasture research during the first decade of XXI century. Revista Brasileira de Zootecnia 39: 151-168.
Falconer DS and Mackay TFC (1996) Introduction to quantitative genetics. Longman, Malaysia/London, 463p.
Ferreira RDP, Botrel MA, Pereira AV and Cruz CD (1999) Avaliação
de cultivares de alfafa e estimativas de repetibilidade de caracteres
forrageiros. Pesquisa Agropecuária Brasileira34: 995-1002.
Holland JB (2006) Estimating genotypic correlations and their standard errors using multivariate restricted maximum likelihood estimation
with SAS Proc MIXED. Crop Science 64: 642-654.
Keller-Grein G, Maass BL and Hanson J (1996) Natural variation in
Brachiaria and existing germplasm collections. In: Miles JW,
Maass BL and Valle CB(ed.) Brachiaria: biology, agronomy and
improvement.CIAT, Cali, p. 17-42 (Publication 259).
Lédo FJDS, Pereira AV, Souza Sobrinho FD, Auad AM, Jank L and Oliveira JSE (2008) Estimativas de repetibilidade para caracteres forrageiros
em Panicum maximum. Ciência e Agrotecnologia 32: 1299-1303. Macedo MCM (2009) Integração lavoura e pecuária: o estado da arte
e inovações tecnológicas. Revista Brasileira de Zootecnia 38: 133-146.
Marten GC, Shenk JS and Barton FE (1985) Near infrared reflectance
spectroscopy (NIRS), analysis of forage quality. USDA,
Washington, 110p.
Martuscello JA, Jank L, Fonseca DM, Cruz CD and Cunha DNFV (2007)
Repetibilidade de caracteres agronômicos em Panicum maximum Jacq.
Revista Brasileira de Zootecnia36: 1975-1981.
Nunes JAR, Ramalho MAP and Abreu AFB (2005) Graphical method in studies of adaptability and stability of cultivars. Annual Report of the Bean Improvement Cooperative48: 182-183.
Rego FCDA, Damasceno JC, Martins EN, Cortes C, Fukumoto NM,
Roeshi L and Santos TDG (2006) Influência de variáveis químicas e estruturais do dossel sobre a taxa de ingestão instantânea em bovinos
manejados em pastagens tropicais. Revista Brasileira de Zootecnia 35: 691-698.
Resende MDV (2002) Genética biométrica e estatística no melhoramento de plantas perenes. Embrapa Informação Tecnológica, Brasília, 975p.
Resende MDV and Duarte JB (2007) Precisão e controle de qualidade em experimentos de avaliação de cultivares. Pesquisa Agropecuária Tropical37: 182-194.
Resende RMS, Resende MDV, Valle CB, Jank L, Júnior RT and Cançado LJ (2007) Selection efficiency in Brachiaria hybrids using a posteriori blocking. Crop Breeding and Applied Biotechnology 7: 296-303.
Resende MDV (2007a) Software SELEGEN – REML/BLUP: Sistema estatístico e seleção computadorizada via modelos lineares mistos.
Embrapa Florestas, Colombo, 359p.
Resende MDV (2007b) Matemática e estatística na análise de experimentos e no melhoramento genético. Embrapa Florestas, Colombo, 561p.
Resende MDV, Resende RMS, Jank L and Valle CB (2008) Experimentação e análise estatística no melhoramento de forrageiras. In: Resende RMS, Valle CB and Jank L (ed.) Melhoramento de forrageiras tropicais. Embrapa Gado de Corte, Campo Grande, p. 195-287.
Reyes-Purata A, Bolaños-Aguilar ED, Hernández-Sánchez D, Aranda-Ibañez EM and Izquierdo-Reyes F (2009) Producción de materia seca y concentración de proteína en 21 genotipos del pasto humidícola Brachiaria humidicola (Rendle) Schweick. Universidad y Ciencia. Trópico Húmedo 25: 213-224.
Senanayake SGJN (1994) Heritability of quality characters and their
correlations in palisade grass (Brachiaria brizantha Stapf). Tropical Agriculture71: 327-329.
Sobrinho FS, Borges V, Lédo FJS and Kopp MM (2010) Repetibilidade de características agronômicas e número de cortes necessários para
seleção de Urochloa ruziziensis. Pesquisa Agropecuária Brasileira 45: 579-584.
Steel RGD, Torrie JH and Dickey DA (1997) Principles and procedures of statistics: a biometrical approach. The McGraw-Hill, Boston, 666p.
Valle CB, Jank L and Resende RMS (2009) O melhoramento de forrageiras